

|
|
|
|
|
|
|---|---|---|---|---|---|
 |
 |
 |
|---|---|---|
 |
 |
 |
|---|---|---|
New alloys have been discovered that are stronger and ligher than diamond. These alloys have an amorphous structure rather than the crystalline structure of conventional alloys. A crystaline alloy tends to be weak at the boundaries between crystals and this limits its strength. Amorphous alloys don't have these weaknesses and can be stronger.
Pure metals and alloys consisting of 2 or 3 different metals tend to be crystaline while alloys with 5 or more metals tend to be amorphous. The new superalloys are mixes of at least 5 different metals.
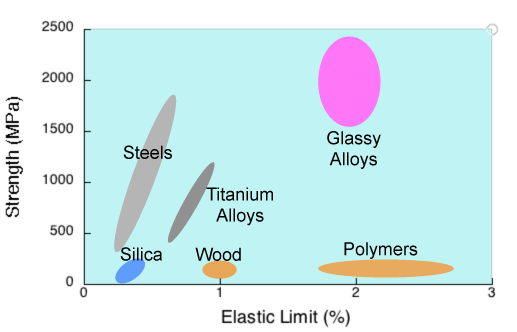
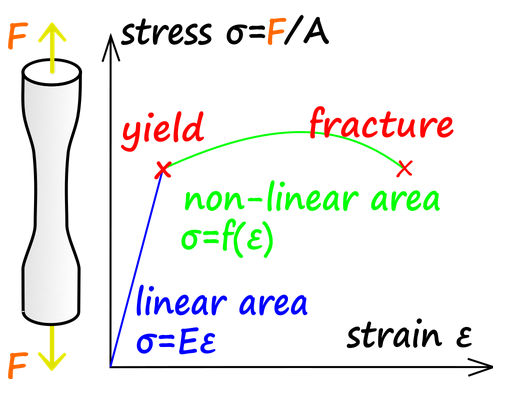
A material's strength is characterized by the "yield strength" and the quality is the ratio of the yield strength to the density. This is often referred to as the "strength to weight ratio".
Yield strength  =  Y            (Pascals)
Density         =  D            (kg/meter3)
Quality         =  Q  =  Y/D    (Joules/kg)
The strongest allyos are:
       Yield strength   Density   Quality
       (GPa)        (g/cm3)    (MJoule/kg)

Magnesium + Lithium             .14        1.43        98
Magnesium + Y2O3                .31        1.76       177
Aluminum  + Beryllium           .41        2.27       181
Amorphous LiMgAlScTi           1.97        2.67       738
Diamond                        1.6         3.5        457
Titanium  + AlVCrMo            1.20        4.6        261
Amorphous AlCrFeCoNiTi         2.26        6.5        377
Steel     + Cobalt, Nickel     2.07        8.6        241
Amorphous VNbMoTaW             1.22       12.3         99
Molybdenum+ Tungsten, Hafnium  1.8        14.3        126
The strongest pure metals are weaker than the strongest alloys.
       Yield strength   Density   Quality
       (GPa)        (g/cm3)    (MJoule/kg)

Magnesium                        .10       1.74        57
Beryllium                        .34       1.85       184
Aluminum                         .02       2.70         7
Titanium                         .22       4.51        49
Chromium                         .14       7.15        20
Iron                             .10       7.87        13
Cobalt                           .48       8.90        54
Molybdenum                       .25      10.28        24
Tungsten                         .95      19.25        49
Beryllium + Li           →  Doesn't exist. The atoms don't mix
Beryllium + Al           →  Improves strength
Magnesium + Li           →  Weaker and lighter than pure Mg. Lightest existing alloy
Magnesium + Be           →  Only tiny amounts of beryllium can be added to magnesium
Magnesium + Carbon tubes →  Improves strength, with an optimal tube fraction of 1%
Aluminum  + Li,Mg,Be,Sc  →  Stronger and lighter than aluminum
Titanium  + Li,Mg,Sc     →  Stronger and lighter than titanium
Steel     + Cr,Mo        →  Stronger and more uncorrodable than steel. "Chromoly"
Copper    + Be           →  Stronger than beryllium and is unsparkable
          Melting point (Celsius)

Tungsten    3422
Rhenium     3186
Osmium      3033
Tantalum    3017
Molybdenum  2623
Niobium     2477
Iridium     2446
Ruthenium   2334
Hafnium     2233
Technetium  2157
Rhodium     1964
Vanadium    1910
Chromium    1907
Most alloys weaken with increasing temperature except for a small subset called "superalloys" that strengthen with temperature, such as Ni3Al and Co3Al. This is called the "yield strength anomaly".
Nickel alloys in jet engines have a surface temperature of 1150 Celsius and a bulk temperature of 980 Celsius. This is the limiting element for jet engine performance. Half the mass of a jet engine is superalloy.
Current engines use Nickel superalloys and Cobalt superalloys are under development that will perform even better.
Yield strength in GPa as a function of Celsius temperature.
                   20   600   800  900  1000  1100 1200  1400  1600 1800  1900  Celsius

VNbMoTaW          1.22         .84        .82       .75  .66   .48   .4
AlMohNbTahTiZr    2.0   1.87  1.60  1.2   .74  .7   .25
Nickel superalloy 1.05        1.20   .90  .60  .38  .15
Tungsten           .95   .42   .39        .34  .31  .28  .25   .10   .08  .04
Below 1100 Celsius AlMohNbTahTiZr has the best strength-to-mass ratio and above
this VNbMoTaW has the best ratio. Both alloys supersede nickel superalloy
and both outperform tungsten, the metal with the highest melting point.
Data:
Entropy, nickel superalloy
                  Yield strength (GPa)

Copper                  .27
Brass                   .41     30% zinc
Bronze                  .30     5% tin
Phosphor bronze         .69     10% tin, .25% phosphorus
Copper + beryllium     1.2      2% beryllium, .3% cobalt
Copper + nickel + zinc  .48     18% nickel, 17% zinc
Copper + nickel         .40     10% nickel, 1.25% iron, .4% manganese
Copper + aluminum       .17     8% aluminum
 |
 |
 |
|
|---|---|---|---|
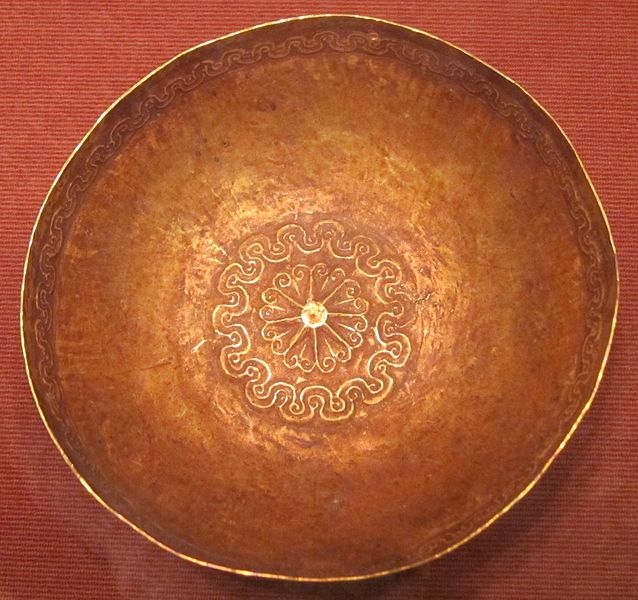
Bells and cymbals are made from bell bronze, 4 parts copper and 1 part tin.
 |
|---|
Carbides are the hardest metallic materials.
10     Diamond
 9.5   BN, B4C, B, TiB2, ReB2
 9.25  TiC, SiC
 9.0   Corundum, WC, TiN
 8.5   Cr, TaC, Si3N4
 8     Topaz, Cubic zirconia
 7.5   Hardened steel, tungsten, emerald, spinel
 7     Osmium, Rhenium, Vanadium, Quartz
                       Min   Max

Valence compounds     1000  4000     carbides, borides, silicides
Intermetallic          650  1300
BCC lattice            300   700
FCC lattice            100   300
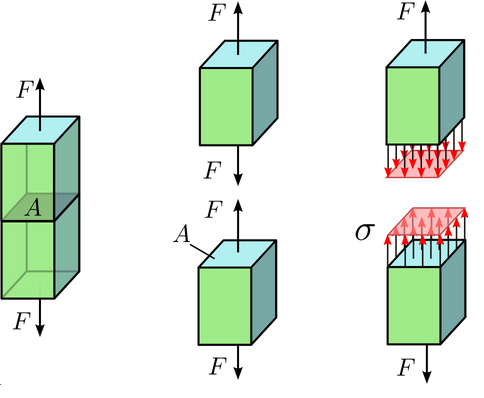
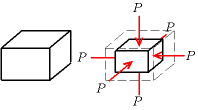
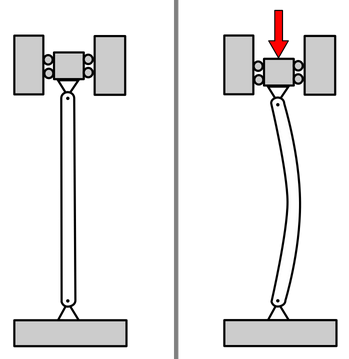
The deformation of a solid is characterized by shear strain, tensile strain, and bulk compression.
 |
 |
 |
|---|---|---|
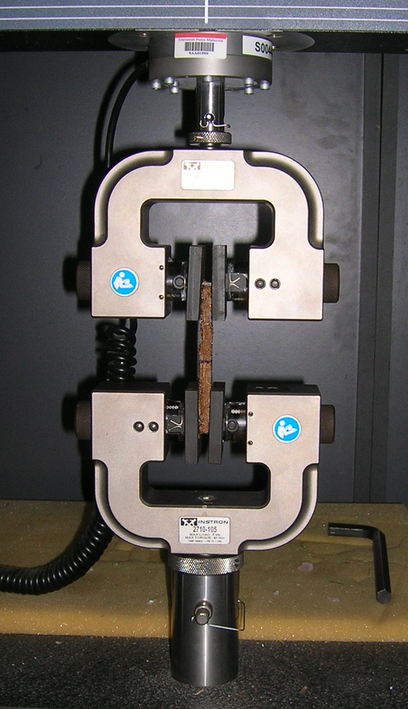
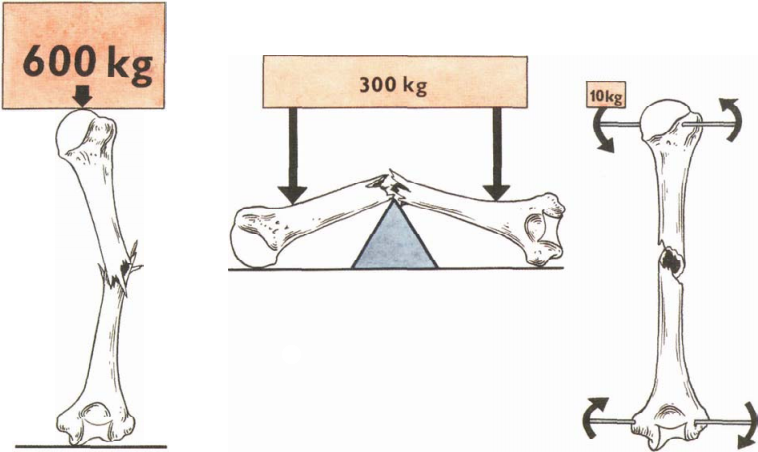
Tensile strength relates to the strength of wires.
 |
|---|
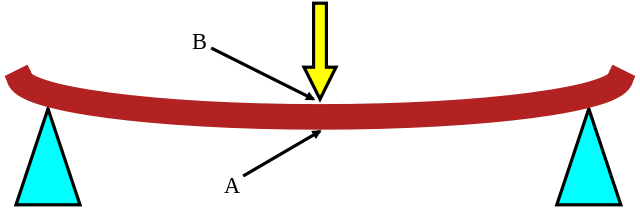
Shear strength relates to the strength of beams and columns.
 |
 |
 |
|---|---|---|
 |
|---|
Concrete and ceramics typically have much higher compressive strengths than tensile strengths. Composite materials, such as glass fiber epoxy matrix composite, tend to have higher tensile strengths than compressive strengths.
Primary  Added   Yield  Break  Stiff  Strain  Poi-  Density Vick  Elong  Yield/   Melt
metal    metals  (GPa)  (GPa)  (Gpa)          sson  (g/cm3)              density  (C)

Magnesium  Li              .16    45                 1.43             .098
Magnesium  Y2O3     .312   .318                      1.76             .177
Magnesium  Tube     .295   .39    49                 1.83        .05  .161
Beryllium           .345   .448  287  .0016  .032    1.85             .186
Aluminum   Be40     .41    .46   185                 2.27        .07  .181
Aluminum   Mg Li    .21    .35    75  .0047          2.51
Aluminum   Cu Li    .48    .53                       2.59             .185
Aluminum   Mg Sc    .433   .503                      2.64        .105 .164
LiMgAlScTi         1.97                              2.67  5.8        .738
Titanium   Be Al                                     3.91
Titanium   Al6V4    .89   1.03   114         .33     4.43   .34  .14          1660
Titanium   VCrMoAl 1.20   1.30                       4.6         .08  .261
Vit 1              1.9                               6.1   5.7
AlCoCrFeNiTih      2.26   3.14                       6.5         .23  .377
Zirconium  Liquid  1.52   1.52    93                 6.57   .56  .018 .231
AlCoCrFeNiMo       2.76                              7.1              .394
AlMohNbTahTiZr     2.0    2.37                       7.4              .270
Inconel 718                                          8.19
Copper     Be      1.2    1.48   130         .30     8.25             .145     866
CrFeNiV.5W                2.24                      ~8.5
Iron       Co Ni   2.07   2.38                       8.6         .11  .241
Iron       Cr Mo                                     9      .32
Nickel     Cr      1.2    2.3    245         .32     8.65  6.6
TiZrNbHfTa          .93                              9.94  3.83  .5
TiVNbMoTaW                                          11.70  4.95
VNbMoTaW                                            12.36
NbMoTaW                                             13.75
Molybdenum W45Hf1 ~1.8    2.14                     ~14.3   3.6   .126
Tungsten   MoNiFe   .62    .90   365                17.7         .10  .035

Yield:     Yield modulus
Break:     Tensile strength (breaking point)
Stiffness: Young's modulus
Strain:    Fractional strain at the breaking point
Poisson:   Poisson ratio
Many properties of alloys are approximately equal to a linear sum of the properties of its constituent elements. This applies for density, stiffness modulus, and Poisson's ratio.
Many properties of alloys can be dramatically different from those of its constiuent elements. This applies for the yield modulus, the tensile breaking modulus, and the hardness.
For aluminum alloys, density = 2.71 - .01 Mg - .079 Li.
Magnesium strengthens when alloyed with aluminum, nickel, copper, and neodymium.
Data: TiVNbMoTaW AlTiNbMo½Ta½Zr Mg Be+Al Aluminum+Mg+Li Table Al+Be Mg + Li Mg alloys Elasticity Ti alloy Ti alloy Ti alloy textbook Liquidmetal Mg + tubes
Elasticity table Al Cu Li Al + tubes Mg + tubes W + Mo Al Mg Sc Fe + Co + Ni Li2MgSc2Ti3Al2 Entropy survey Entropy survey Entropy survey * CrFeNiV½W Entropy rev 2014 Nickel Chromium Copper textbook TiZrNbHfTa