
|
|
|
|
|
|
|---|---|---|---|---|---|
 |
 |
 |
 |
 |
 |
|---|---|---|---|---|---|
 |
 |
|
|---|---|---|
 |
 |
 |
 |
 |
 |
|---|---|---|---|---|---|
 |
 |
 |
|---|---|---|
 |
 |
 |
 |
||
|---|---|---|---|---|---|
 |
 |
 |
 |
 |
||
|---|---|---|---|---|---|---|
 |
 |
 |
 |
 |
|
|---|---|---|---|---|---|
 |
 |
 |
|---|---|---|
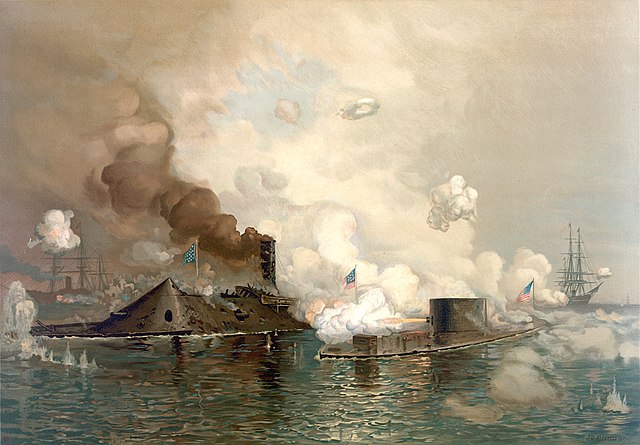
In Civil War I, the North was economically stronger than the
South.
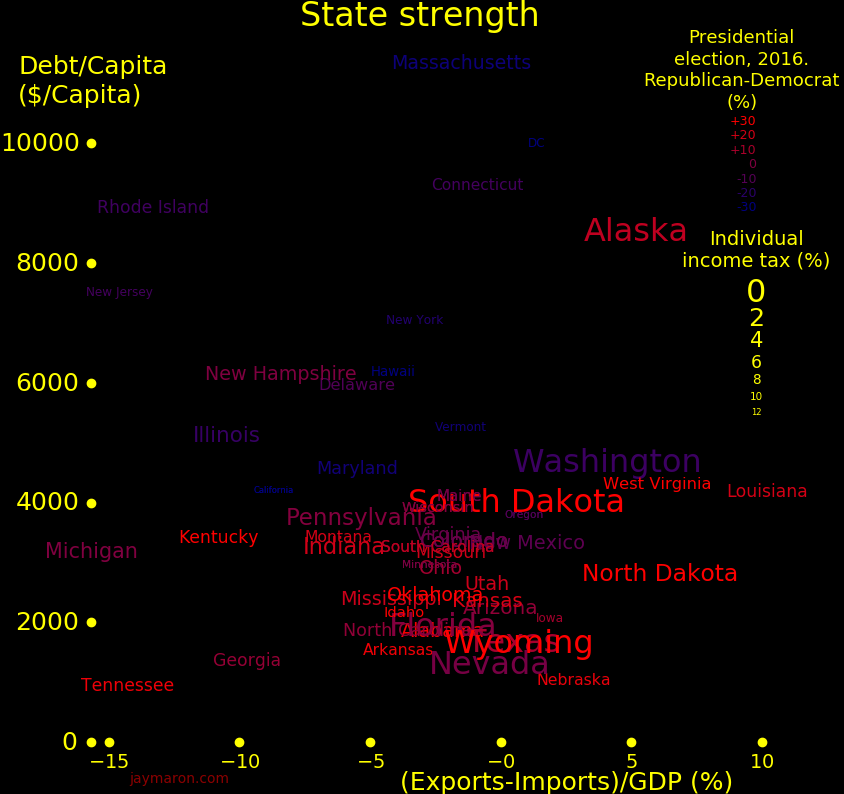
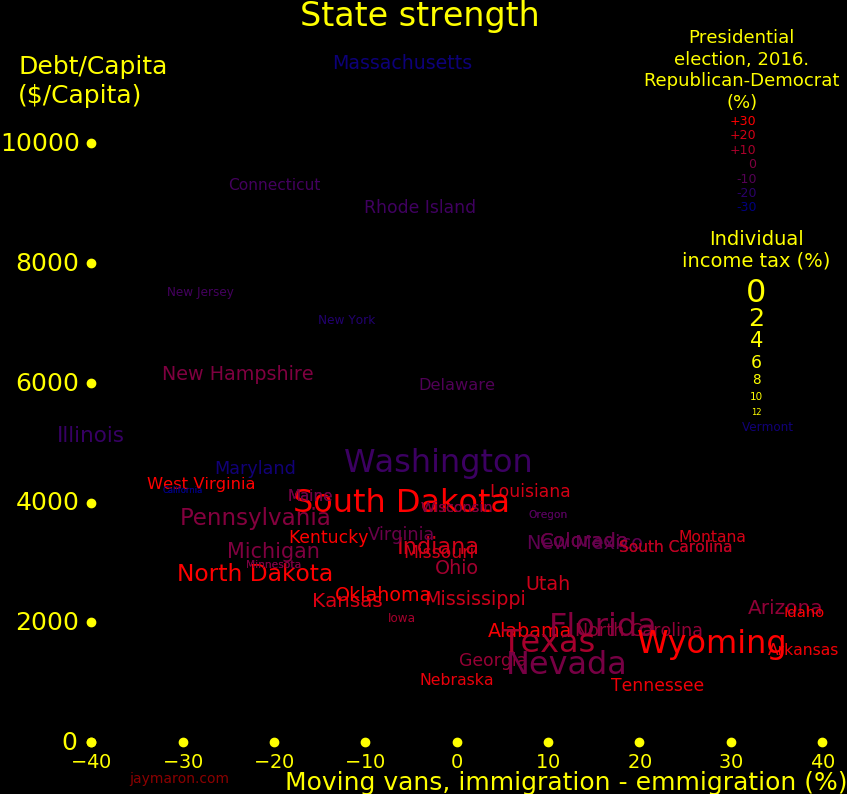
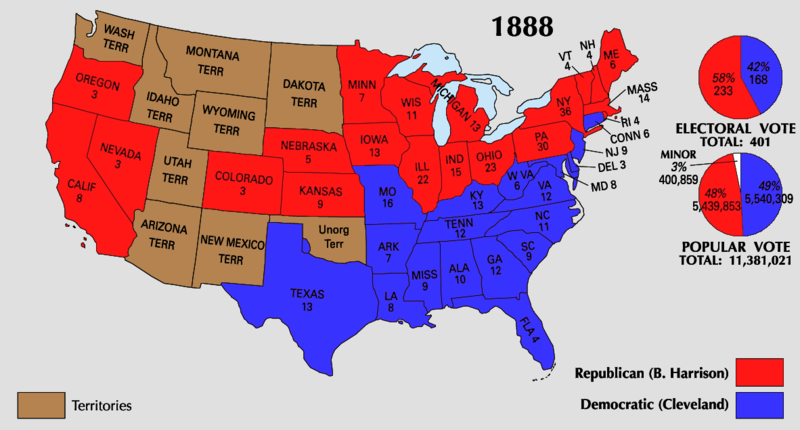
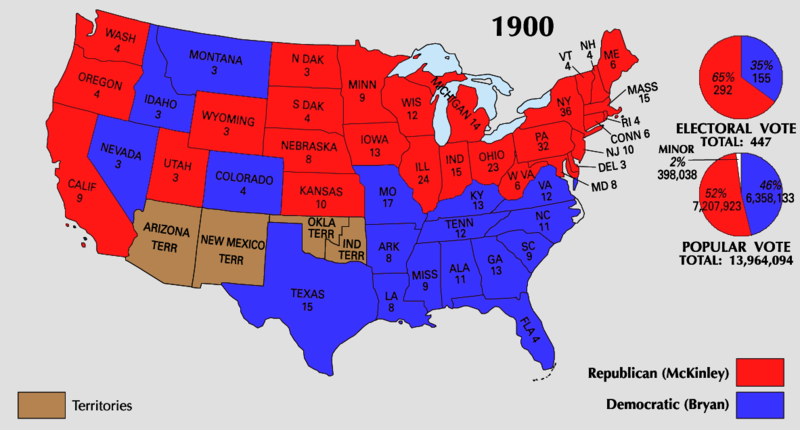
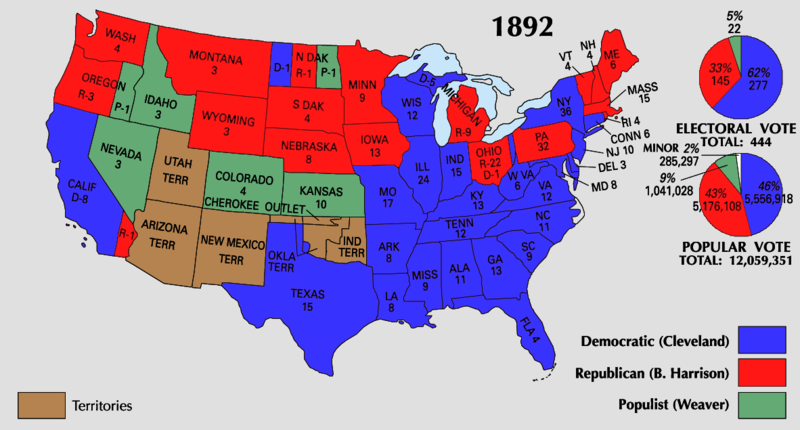
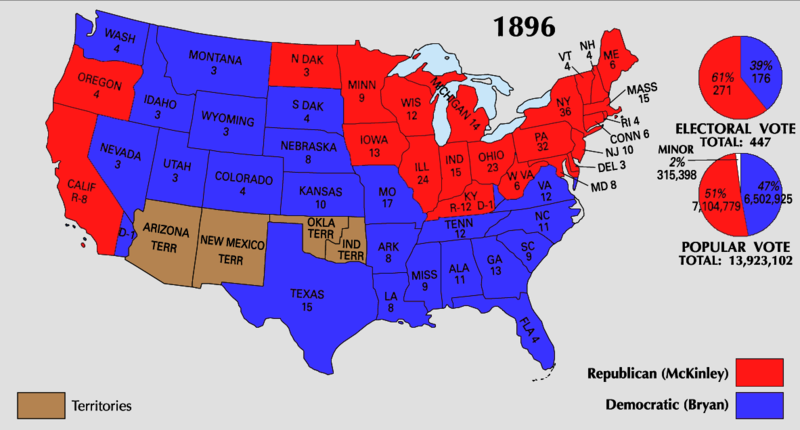
In Civil War II, Republican cities and states are economically stronger than
Democrat cities and states. Republican cities and states tend to have less debt/capita than Democrat
states, less taxes, and a larger value for exports minus imports.
 |
|---|
Civil War I:
      Soldiers  Railroad  Manufacturing  Arms production
        mil      miles     % of total      % of total

North    2.1      21800         90             97
South    1.06      8800         10              3
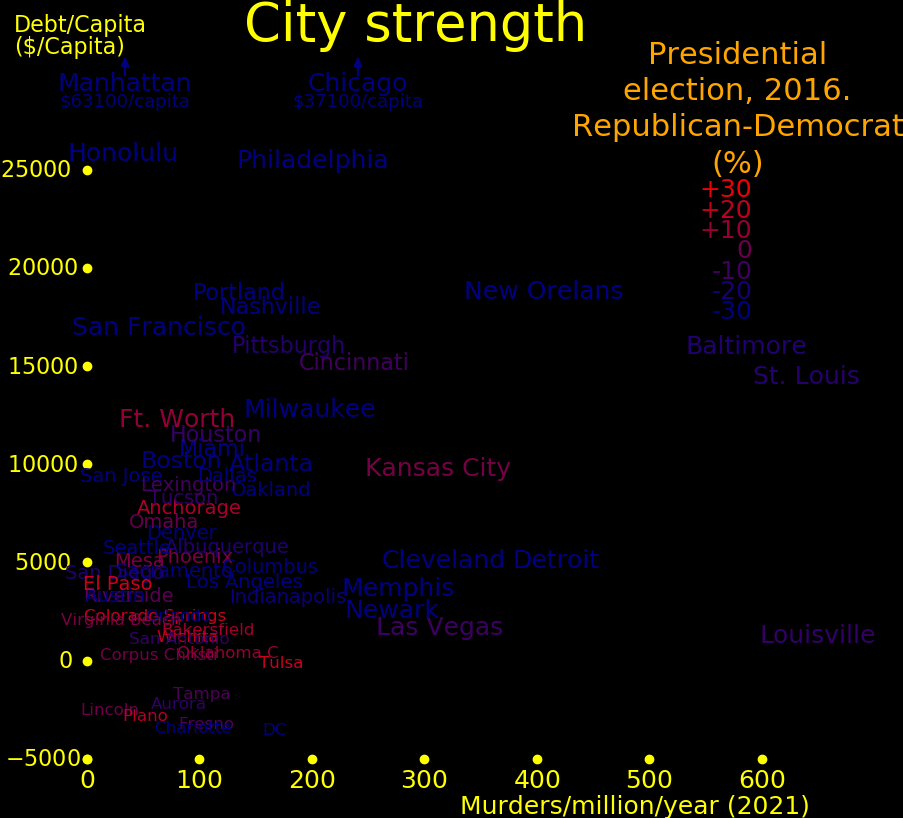
Republican cities are economically stronger than Democrat cities. All the high-debt and high-murder cities are Democrat cities.
 |
|---|
People are migrating from blue to red states. The data comes from the moving industry, which tracks moving vans that move between states. Data.
 |
|---|
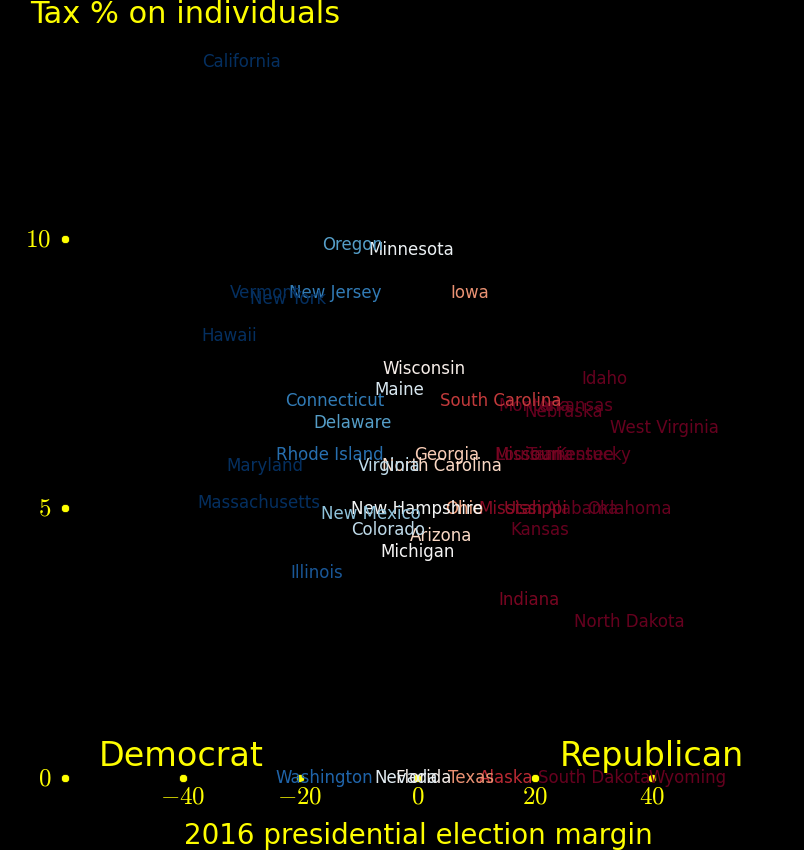
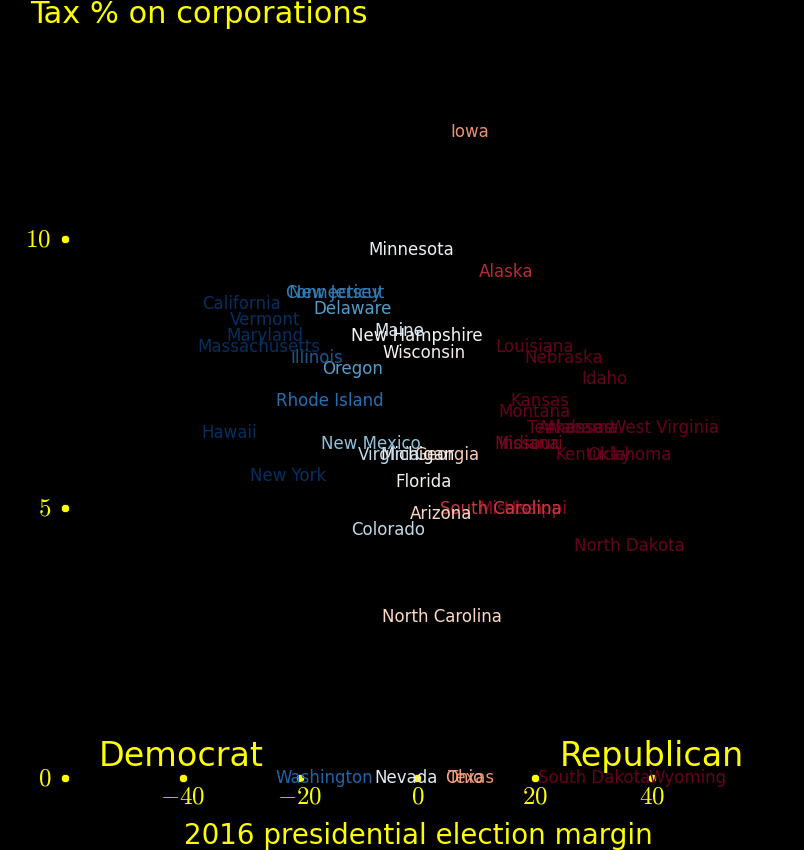
Blue states tax more than red states.
 |
 |
|---|---|
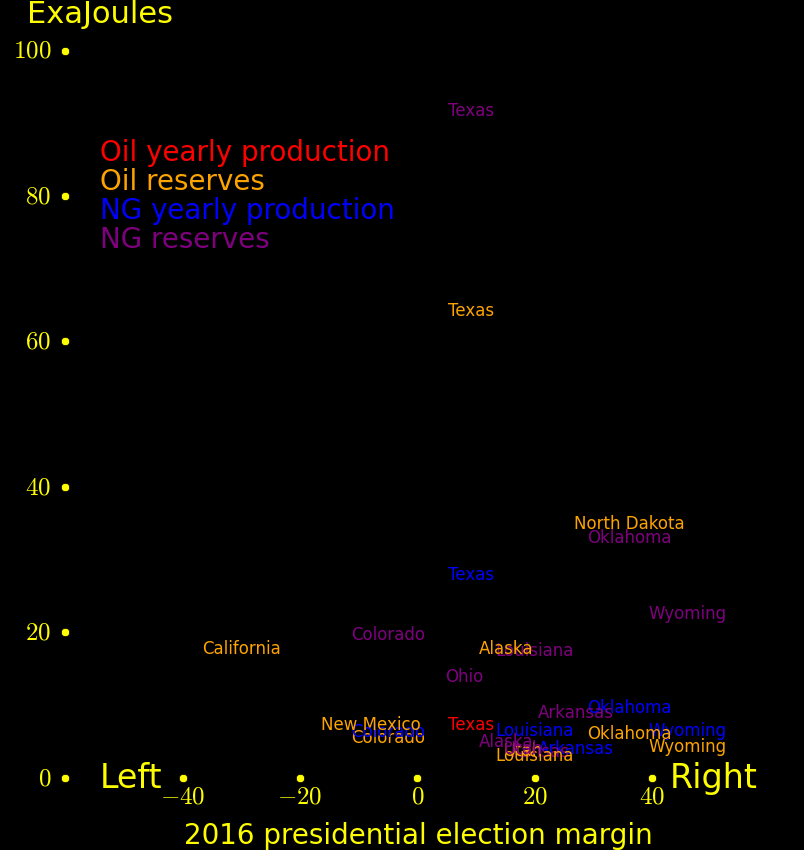
Most of the oil and natural gas is in red states.
 |
|---|
 |
|---|
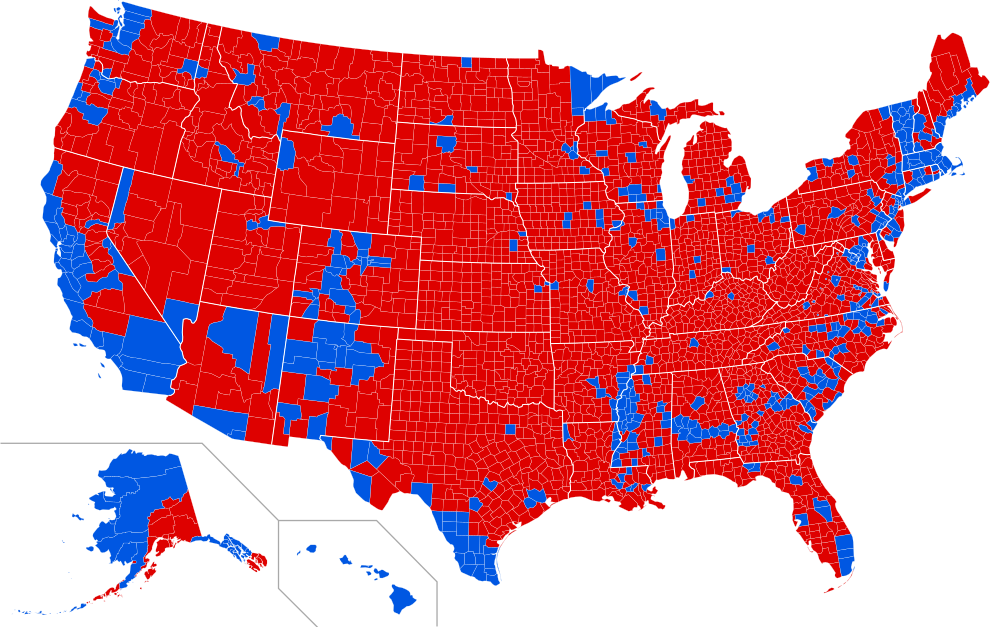
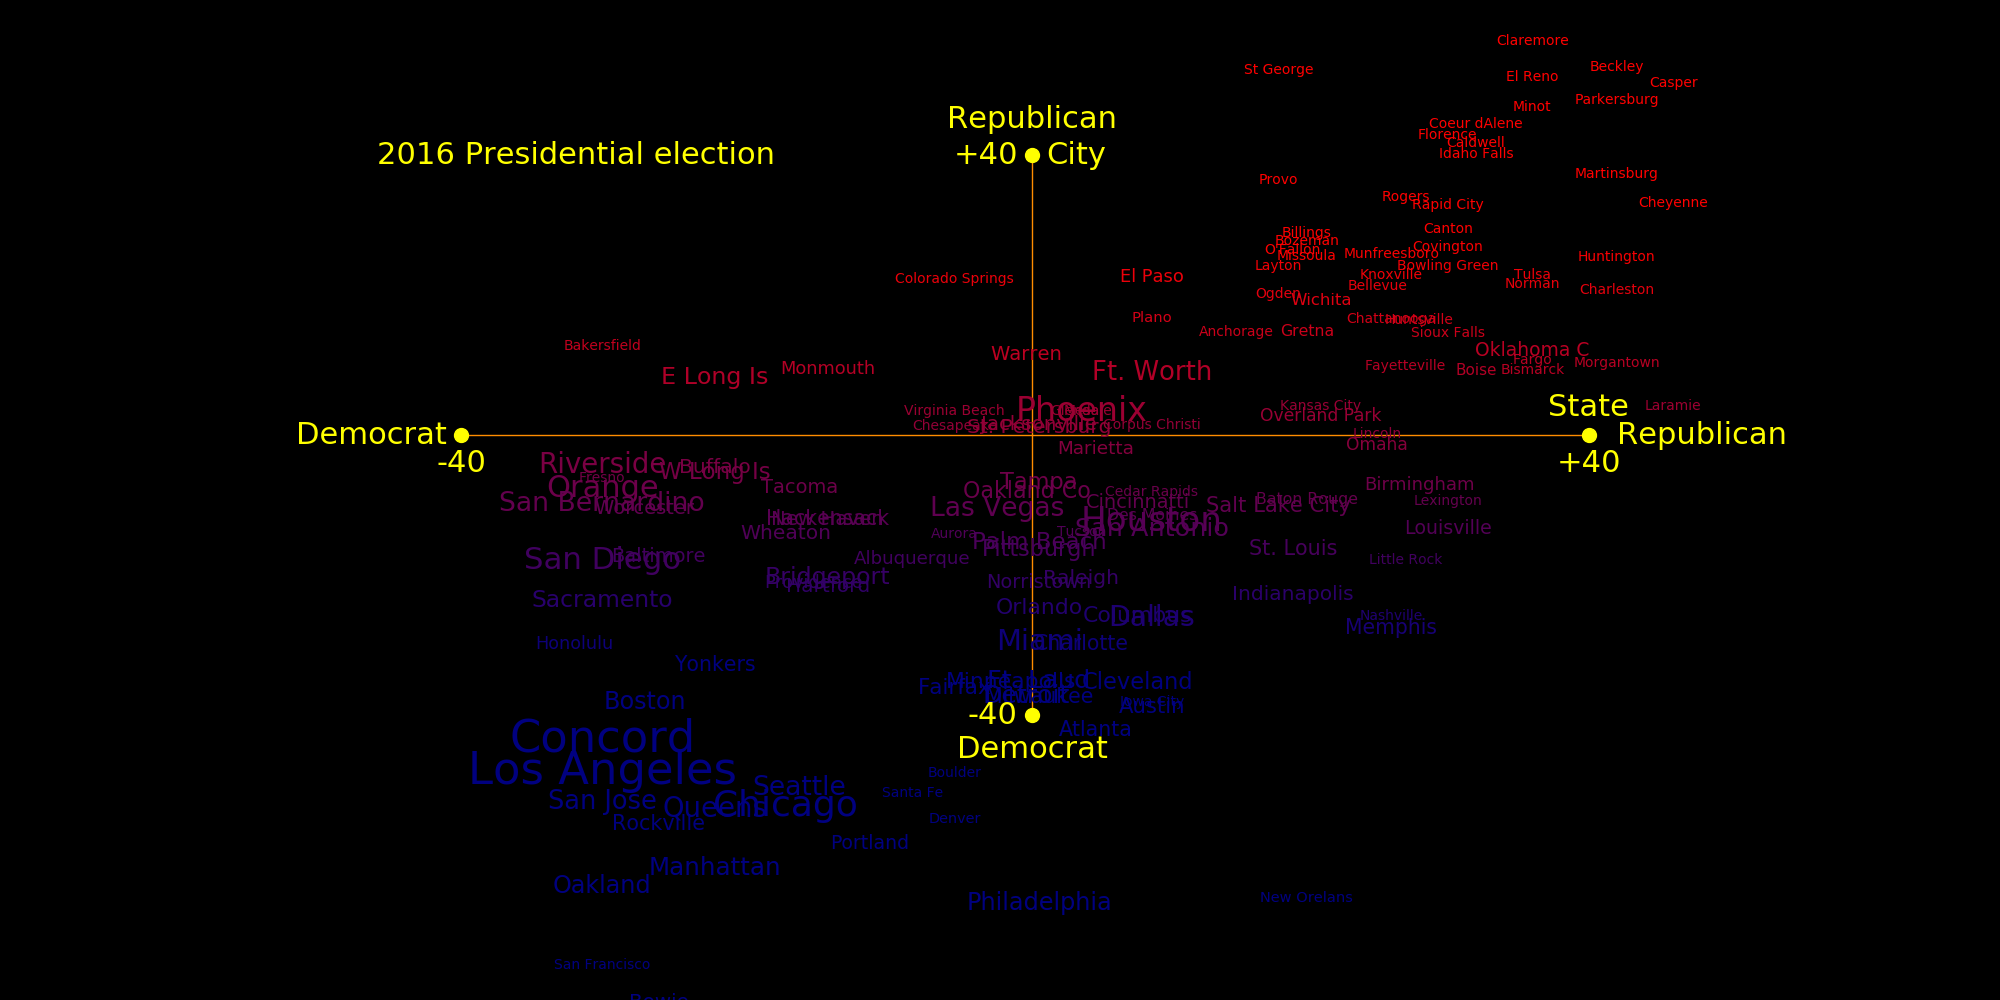
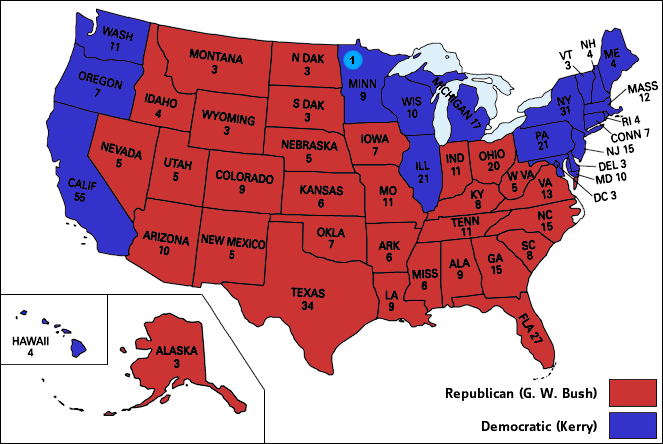
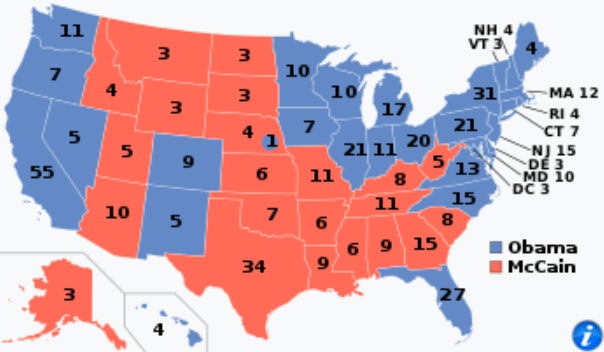
Urban areas tend to be blue and rural areas tend to be red. Almost all large cities are blue, even the ones in red states.
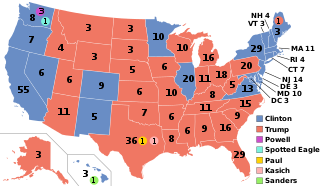
The following plot shows how each city voted in the 2016 presidential election, with Republican cities toward the top and Democratic cities toward the bottom. Most cities are Democratic. The horizontal axis indicates how the state voted. Text size indicates city size.
 |
|---|
 |
|---|
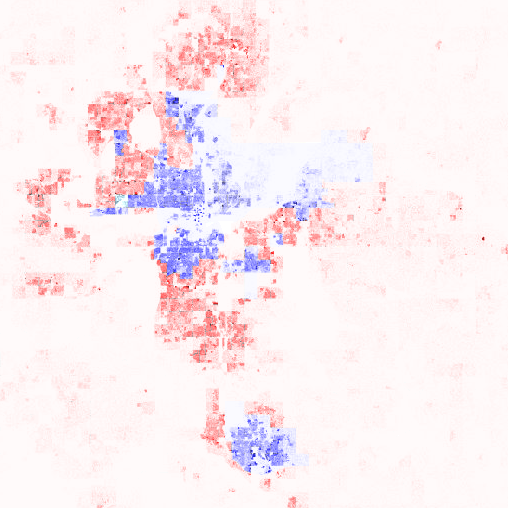
The largest red city is Oklahoma City. The city center is blue and the suburbs are red. The blue splotch to the southeast is the University of Oklahoma.
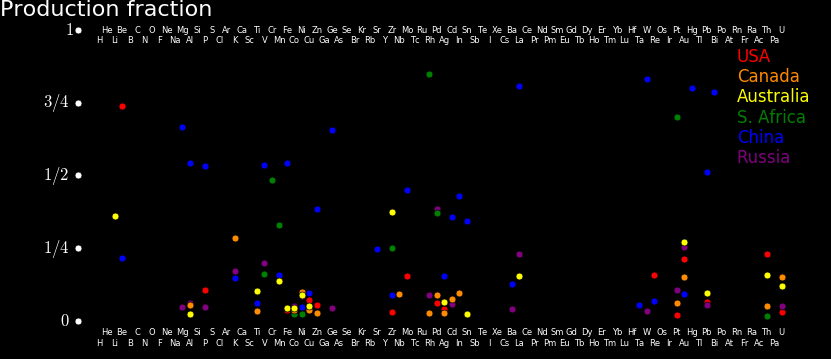
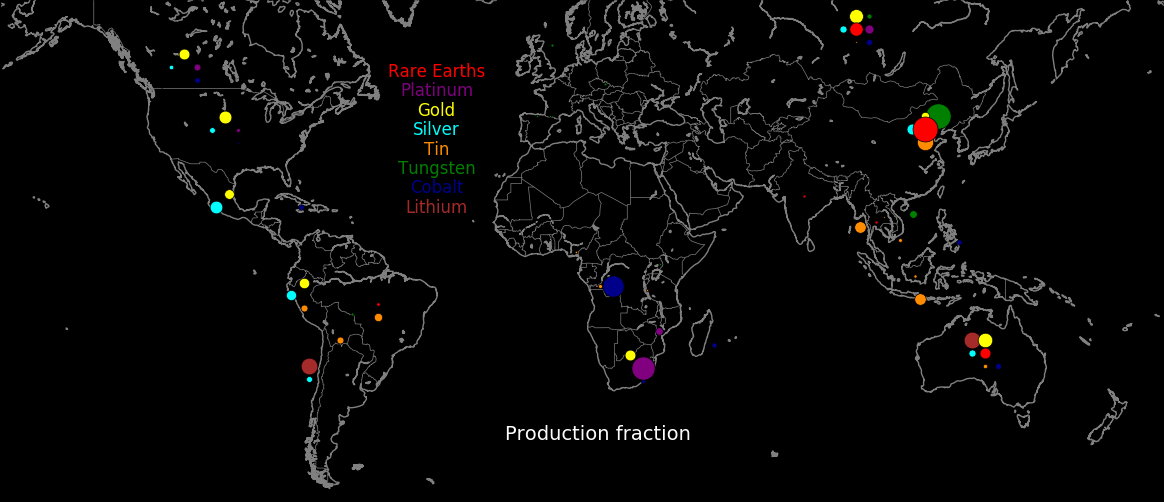
China dominates the production of most elements, with South Africa in second place. America dominates for only beryllium, rhenium, and thorium. The plot shows the fraction of world production for each element.
 |
|---|
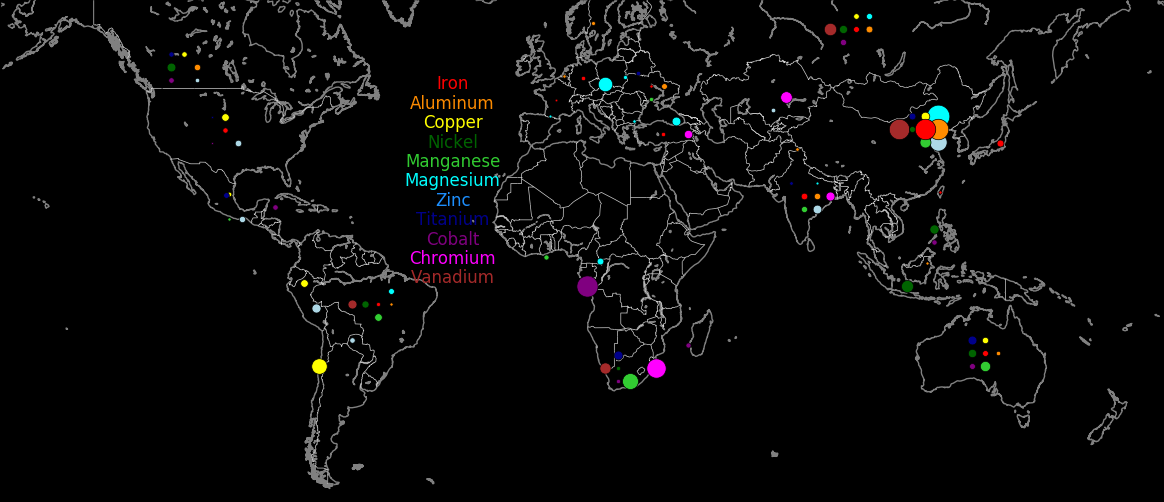
Macrometals are the metals mined by greatest mass. The macrometal superpowers are China, South Africa, Australia, Russia, India, and Canada. America has feeble production. The following plot shows each nation's fraction of world production for each metal. Data is from USGS 2018.
 |
|---|
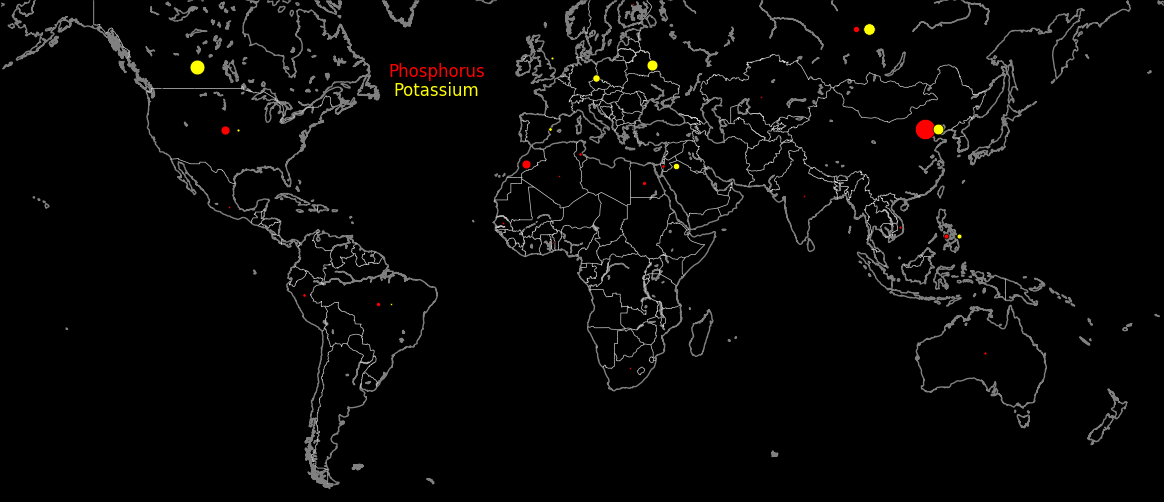
The plot shows the most endangered elements and where they are produced. Many come from conflict zones or from hostile nations. Most come from China.
 |
|---|
The endangered elements are:
Element       Source                   Use

Cobalt        DR Congo                 Lithium-ion batteries, steel alloy
Lithium       Australia, Chile         Lithium-ion batteries
Rare-earths   China                    All of the electronics industry, especially solar cells and magnets
Germanium     China                    Fiber optics
Tin           China                    Solder and bronze
Tungsten      China                    Superhard materials in the form of tungsten carbide
Scandium      China, Ukraine, Russia   Aluminum alloy
Phosphorus    China, Israel, Canada    Fertilizer
Potassium     China, Israel, Canada    Fertilizer
There isn't enough lithium and cobalt to build an electric car for everyone in the world.
The ultimite limit to how much food we can grow is from fertilizer, and this hinges on phosphorus and potassium. Biomass power is vast, hence phosphorus and potassium are critically important.
Most endangered elements are endangered because they're produced primarily in China.
Elements that are important but not endangered include:
Platinum     Canada South Africa     Catalyst
Palladium    Canada South Africa     Catalyst
Rhodium      Canada South Africa     Catalyst
Rhenium      Chile USA Peru Poland   Aircraft turbines
Osmium                               Superhard metal
Iridium                              Superhard metal
Molybdenum                           Strong metal
Beryllium    USA                     Strong lightweight metal
Tantalum     Australia Brazil Canada Capacitors and is produced in Australia, Brazil, and Canada.
Nickel       Worldwide               Steel alloy. Turbines
Caesium      Canada                  Drilling lubricant in the form of caesium formate
Gold         USA Canada Australia    Currency
Silver       Mexico Peru             Solar cells
Copper       Chile Peru USA Aus Chi  Power wires
Gallium      Worldwide               Extracted from aluminum ore
Uranium      Worldwide               Nuclear energy
Thorium      Worldwide               Nuclear energy
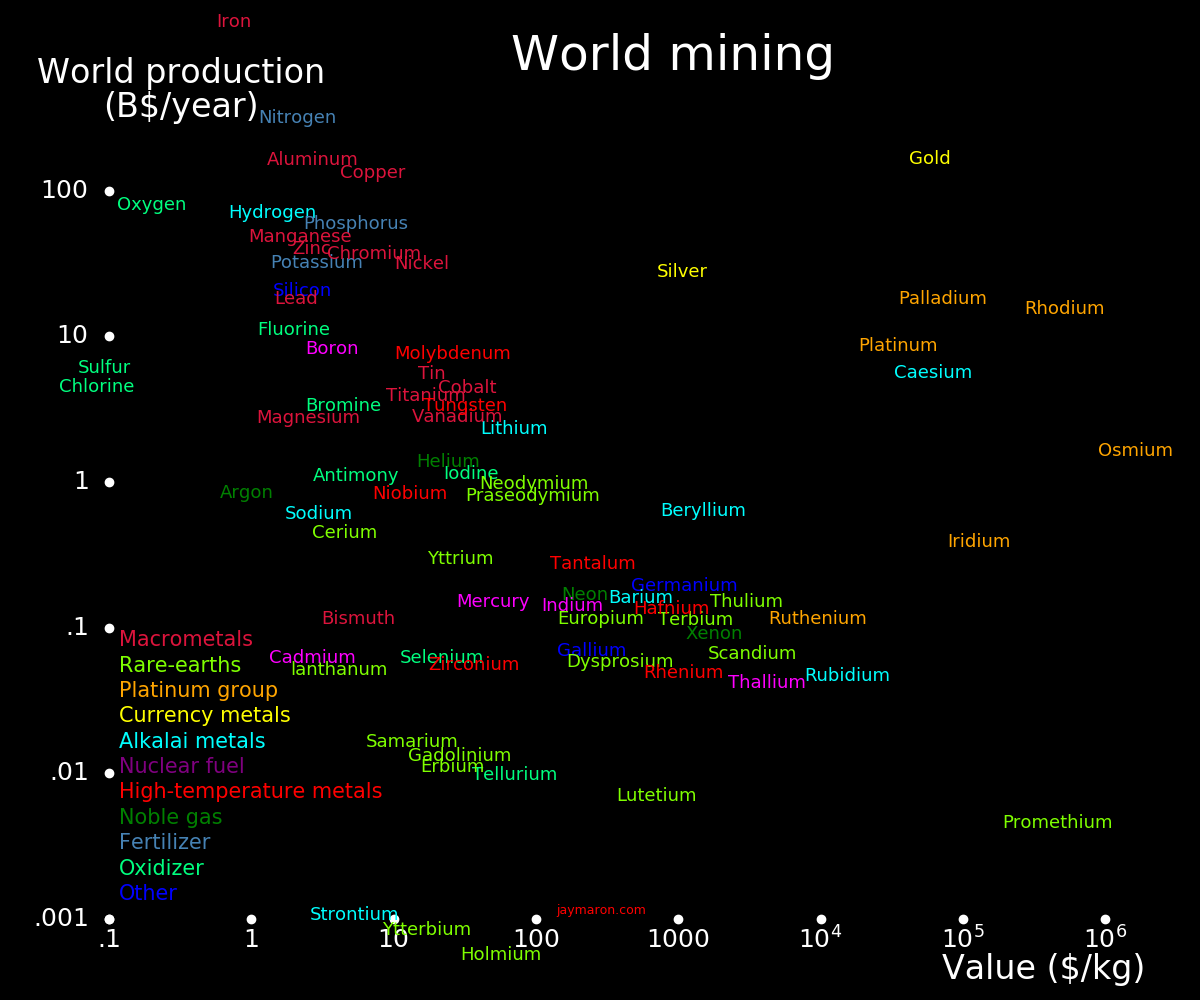
The following plot shows world production for each element. Endangered elements tend to be near the bottom.
 |
|---|
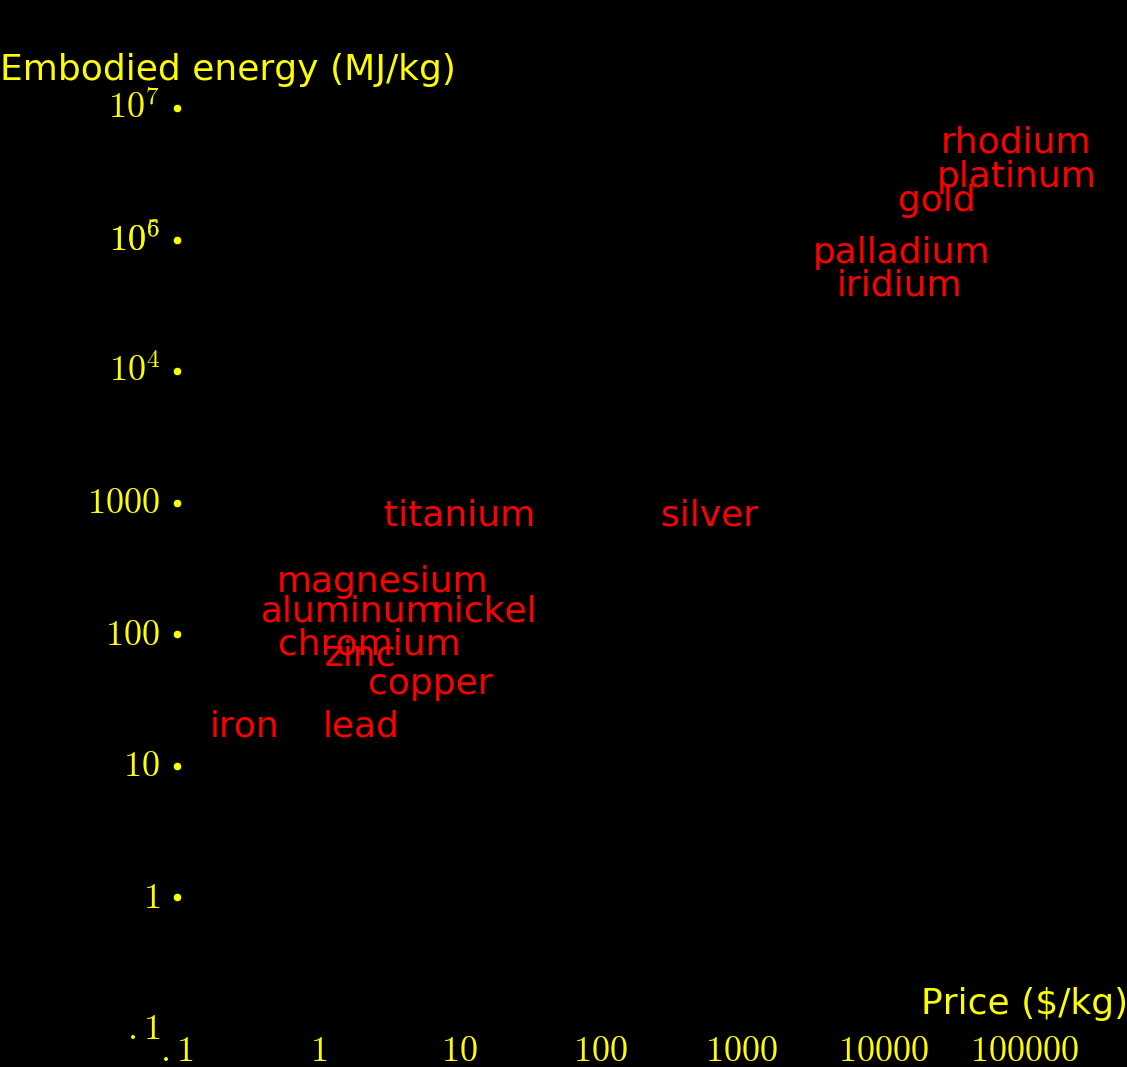
The embodied energy of an element is the energy required to extract the element from ore, in Joules/kg. Most of the price of elements is from energy. For steel, the energy comes from coal smelting and for most of the other elements the energy comes from electricity.
 |
|---|
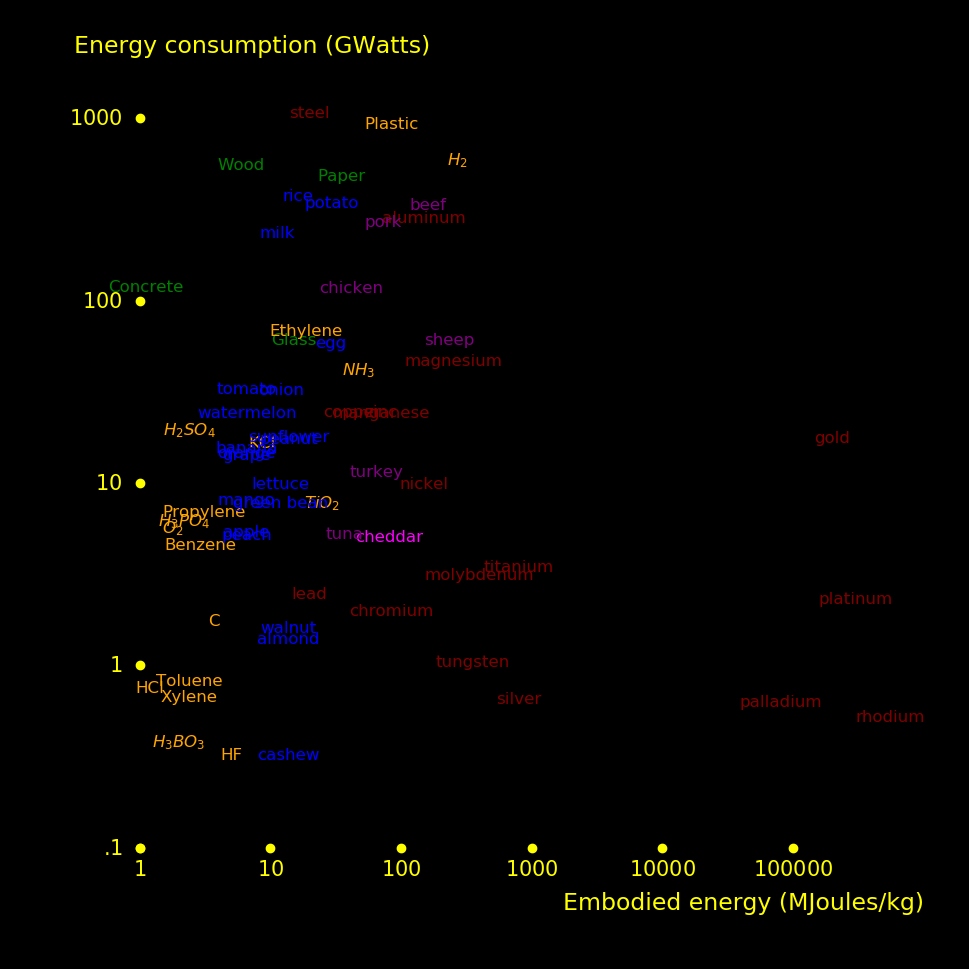
Energy is used in every stage of industry. It's used in the production of primary materials, such as elements, chemicals, plastics, and lumber. It's used again to manufacture things with the primary materials.
The plot shows how much energy the world expends per year for primary materials.
 |
|---|
 |
 |
|---|---|
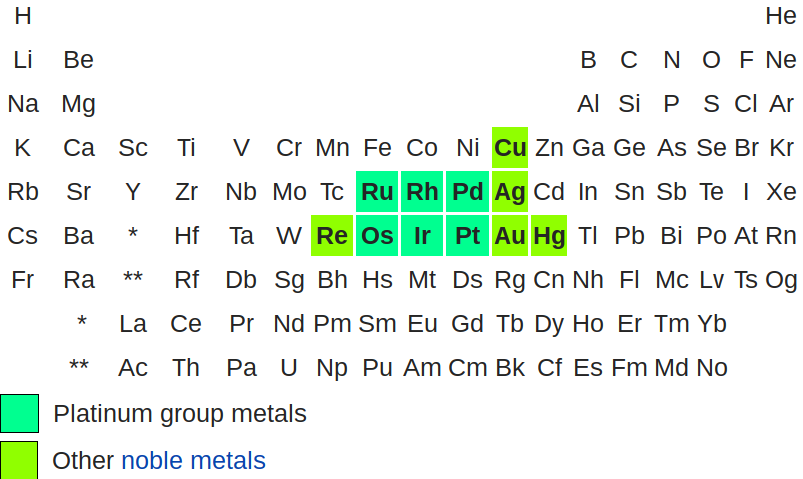
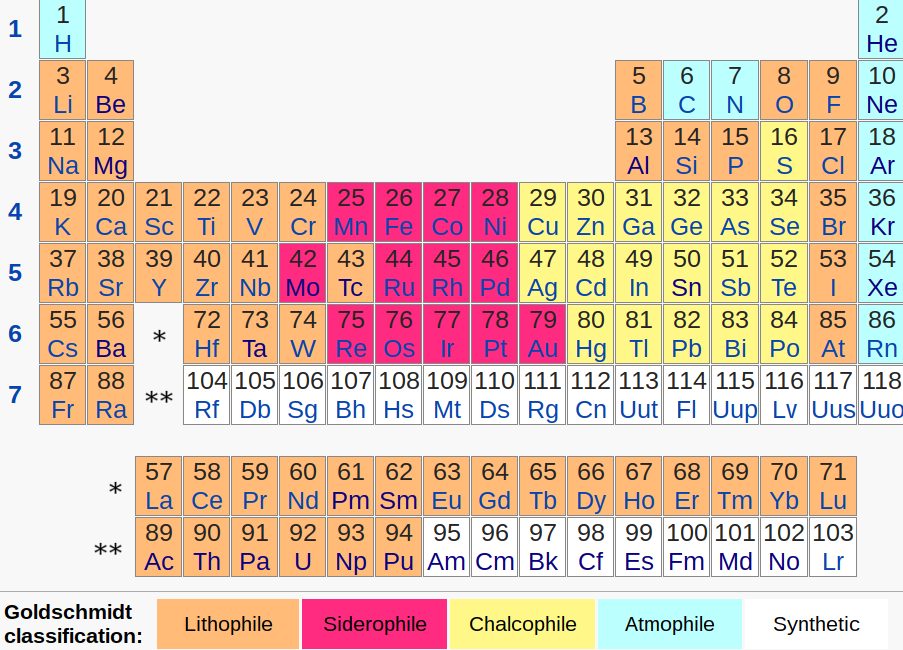
Platinum group metals are rare because they are dense and they tend to sink to the Earth's core. They are mostly mined from metal asteroid craters such as the Sudbury crater in Canada and the Vrodefort Crater in South Africa. Metallic asteroids are rich in platinum group elements because they used to be part of the core of a planet.
Siderophile:  Iron-living. Tends to sink to the core along with the iron.
Lithophile:   Rock-loving. Tends to become included in rock and escapes sinking
              to the core.
Chalcophile:  Ore-loving. Tends to combine with oxygen and sulfur and escapes sinking
              to the core.
Atmophile:    Is a gas at room temperature and tends to escape the crust into the
              atmosphere.
 |
|---|
 |
|---|
 |
 |
|---|---|
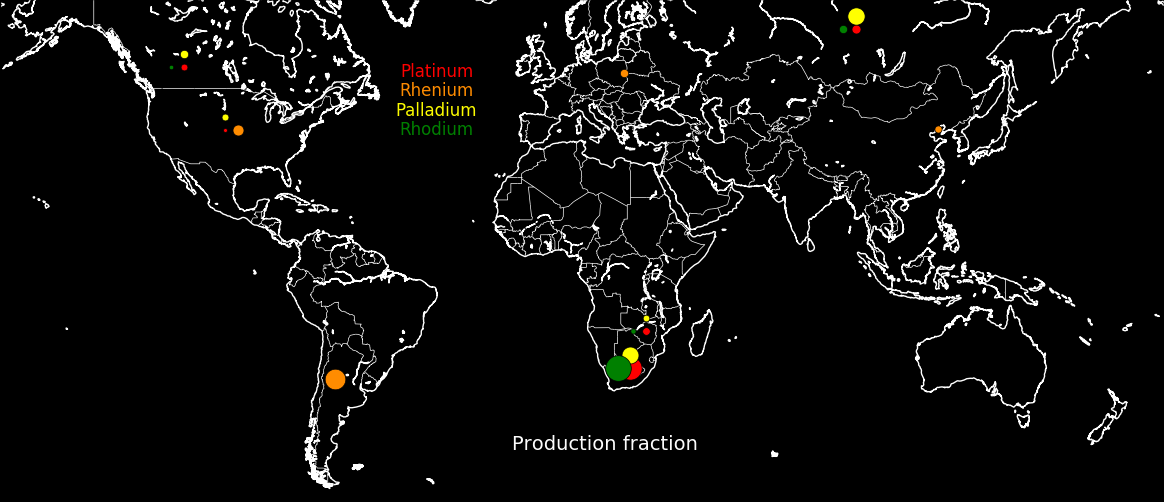
A 300 meter metallic asteroid has 30 billion dollars of platinum group elements, equal to world annual production.
-178918.jpg) |
 |
 |
 |
|---|---|---|---|
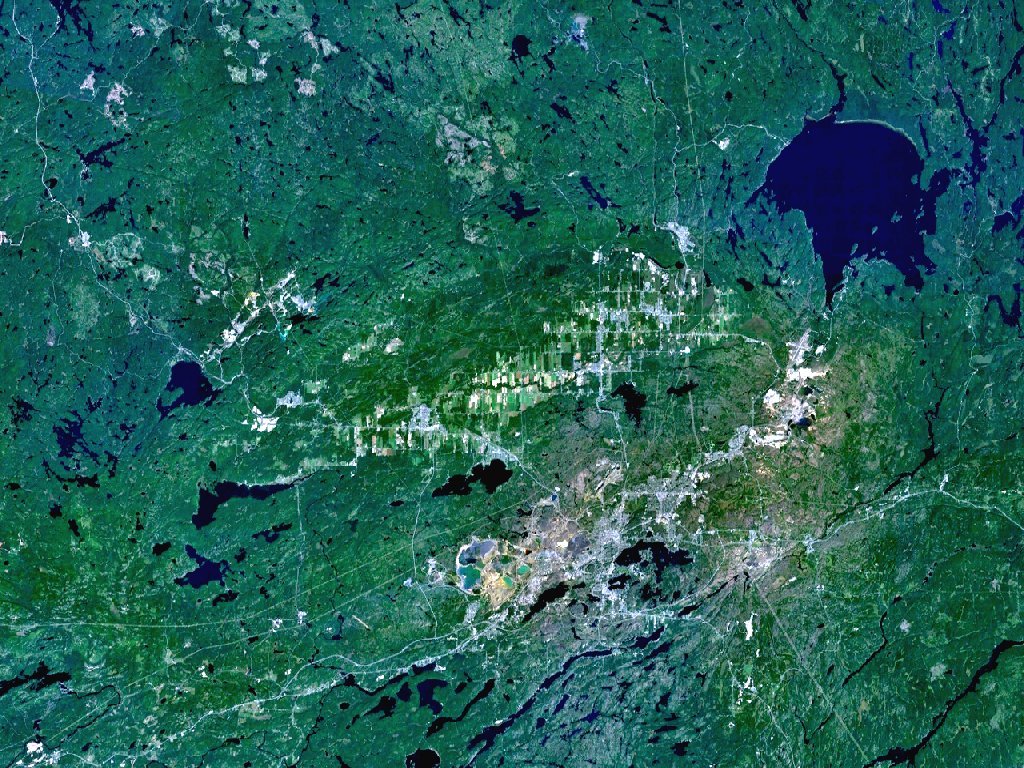
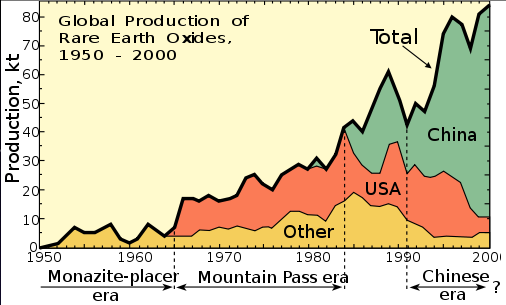
The rare Earth elements are the ones in the row from Lanthanum to Lutetium and they tend to occur together in minerals. They are vital to electronics and 95% of the world's supply comes from the Bayan Obo deposit in China. Uranium and thorium are often found in rare Earth ore.
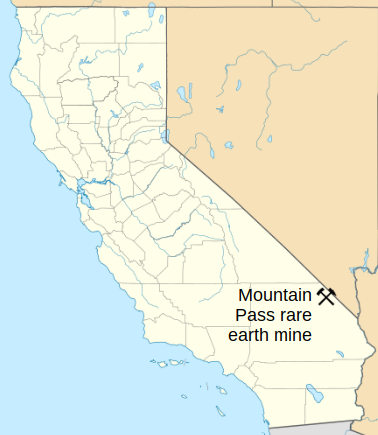
The Californa Mountain Pass mine closed in 2002. In 2010 China restricted rare Earth exports, prompting subsidies from the U.S. Government to reopen the mine. Mining resumed in 2015 and then ceased in 2016 when the mining corporation went bankrupt.
 |
|---|
Population on 2014 July 1    =  317.7  million people
Present workforce            =  154.4  million people
Gross Domestic Product       =  17.02  trillion $/year
Net worth of citizens        =  87.25  trillion $/year    (2015)
Government revenue           =   3.02  trillion $/year
Government spending          =   3.50  trillion $/year
Deficit                      =    .48  trillion $/year
Dept                         =  18.23  trillion $/year
Net worth per citizen        = 275000  $/person/year
Tax per working-age person   =  15200  $/person/year
                           B$/year
Individual income tax        1395
Social Security tax          1023
Corporate income tax          321
Federal Reserve System         99
Excise tax                     93
Customs duties                 34
Estate and gift taxes          19
Misc                           37
Total individual + corporate 2739
Total                        3021
                       B$                     B$                             B$

Defense              526.6    Agriculture    21.5    EPA                     8.2
Health & Human serv.  78.3    NASA           17.7    Nat. Science Found.     7.6
Education             71.2    Justice        16.3    Army Corps of Engineers 4.7
Veterans affairs      63.5    Transportation 16.3    Corp. Nat & Comm serv   1.1
Homeland Security     39.0    Treasury       12.9    Small Business Admin     .8
Housing & Urban Dev   33.1    Labor          12.1    Disaster costs          6
Intelligence          48.2    Interior       11.7    Other                  19.4
State                 48.1    Social Security 9.1    Total                1235
Energy                28.4    Commerce        8.6
Health & Human Services inclues medicare and medicade.
 |
|---|
 |
 |
|---|---|
 |
 |
|---|---|
 |
|---|
 |
|---|
Export Import Balance Export Import
B$ B$ B$ frac frac
% %
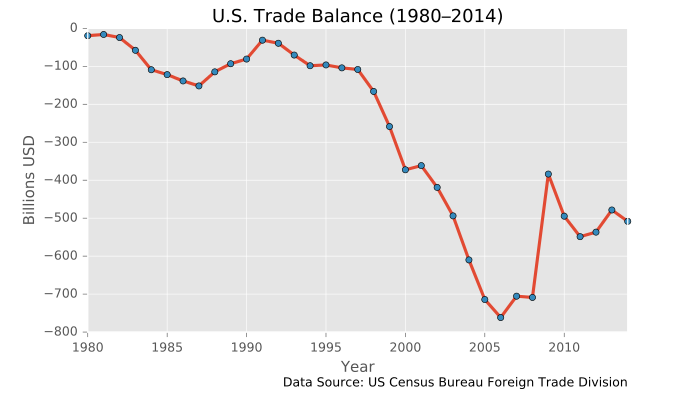
World 1621 2348 -727
EU 276 418 -142
Canada 312 348 -35 76.8 54.5
China 124 467 -343 16.9
Mexico 240 294 -54 80.2 48.8
Japan 67 124 -67 18.9
Germany 49 123 -74
South Korea 44 70 -25
UK 54 54 -1
France 31 47 -16
Saudi Arabia 19 47 -28
India 22 45 -24 13.4
Italy 17 42 -25
Taiwan 27 41 -14
Ireland 8 34 -26 20.6
Switzerland 22 31 -9
Brazil 42 31 12
Malaysia 13 30 -17
Thailand 12 27 -15
Israel 15 23 -8 26.9 11.8
Netherlands 43 21 22
Belgium 35 21 14
Colombia 20 18 2 26.3 28.5
Singapore 30 16 14
Australia 27 11 16
Chile 17 9 7
Hong Kong 41 6 35
Venezuela 34.6 24.2
Sri Lanka 25.0
Vietnam 20.0
Panama 19.8 25.1
Pakistan 12.4
Other 290 357 -67
Export frac: Fraction of the given country's exports that go to the USA
Import frac: Fraction of the given country's imports that come from the USA
                     B$                           B$

Cars                53.4    Delivery trucks      18.9    Liquid pumps         8.3
Refined oil         51.9    Blood                18.9    Industrial machinery 8.2
Planes & spacecraft 39.6    Aircraft parts       17.0    Chemical instruments 8.1
Pharmaceuticals     37.9    Coal                 16.2    Centrifuges          8.0
Gas turbines        29.0    Telephones           13.5    Wheat                7.8
Gold                27.2    Valves               10.7    Combustion engines   7.8
Soybeans            23.7    Corn                 10.2    Insulated wire       7.7
Medical instruments 19.8    Orthopaedic devices  10.1    Ethylene             7.6
Integrated circuits 19.4    Scrap iron            9.0    Air pumps            7.3
Computers           19.3    Construction vehicles 8.5    Tractors             6.9
         Export  Import  Balance
           B$      B$      B$

World       310    448    -138
China        11.9   60.4   -48.5
USA          42.4   21.8    20.6
UAE          33.0   26.1     6.7
Saudi Arabia 11.2   28.1   -16.9
Switzerland   1.1   22.1   -21.1
Germany       7.5   12.8    -5.3
Hong Kong    13.6    5.6     8.0
Indonesia     4.0   15.0   -11.0
South Korea   4.6   13.5    -8.9
Japan         5.4   10.1    -4.7


                Commodity  Commodity
                export B$  import B$

Refined petroleum  61.2
Oil                41.2     177.5
Vehicles           14.5
Prec. metal, gems  41.2      60
Electronics         9.1      32
Machines, engines  13.6      31
Pharmaceuticals    11.7
Cereals            10.1
Clothing            9.1
Organic chem       12.1      18.3
Plastics                     11.8
Iron, steel         9.1      11.4
Electronics         9.1
         Export  Import  Balance
           B$      B$      B$

EU          356    212     145
USA         325    122     202
Hong Kong   268     16     252
Japan       148    195     -46
South Korea  83    163     -80
Brazil       32     52     -21
India        50     23      27
Russia       39     40      -1
Taiwan       35    125     -90


                 Export (B$/yr)                       Export (B$/yr)

Computers            210.2            Transformers          25.2
Broadcast equipment  111.0            Furniture             25.1
Phones                91.8            Knit sweaters         24.2
Office machine parts  47.1            Trunks and cases      23.8
Integrated circuits   41.7            Video displays        21.9
Broadcast accessories 29.5            Vehicle parts         21.7
Semiconductor devices 29.0            Seats                 21.5
         Export  Import  Balance
           B$      B$      B$

Netherlands  46     <8
China        35     44      -9
Germany      31     46     -15
Ukraine      29     20       9
USA          25     11       4
Italy        24     13      11
Belarus      23     13      10
Poland       21      8      13
Japan        17     14       3
Kazakhstan   16     <8
South Korea <16     12
France      <16     11


                 Export (B$/yr)                 Export (B$/yr)

Crude petroleum    183.7         Wheat                6.2
Refined petroleum   70.6         Gold                 5.8
Natural gas         42.3         Diamonds             4.7
Coal                14.1         Nickel               4.2
Fertilizer          11.7         Copper               5.5
Iron                10.3         Wood                 3.4
Aluminum             6.6         Rubber               2.9
           Export  Import
             B$      B$

China       127.1  182.0
USA         129.4   71.8
S. Korea     51.8   33.6
Taiwan       40.2   24.4
Australia    14.3   48.4
S. Arabia     7.6   47.8
Thailand     31.6   21.9
UAE           9.6   42.0
Malaysia     14.2   29.4


                 Export (B$/yr)

Cars                 104.3
Vehicle parts         42.2
Integrated circuits   19.2
Industrial printers   17.5
Machinery             13.6
Construction veh.     13.2
Trucks                12.2
Refined petroleum     11.5
Vid recording equip.  11.2
Data for 2014.
_in_2014.svg.png) |
|---|
        Currency  Currency  Wealth  Wealth    GDP   GDP/prsn  G7   G20
           B$        %        T$    k$/prsn  T$/yr   k$/yr

World                                        73.99
Eurozone   1035    24.3     250.1    52
EU                                           16.48            *    *
USA         851    20.0      85.9   353      18.56   55.8     *    *
China       492    11.6      22.8    22.5    11.38   14.1          *
Japan       762    17.9      19.8   190       4.41   38.1     *    *
UK           87.5   2.05     15.6   320       2.85   41.2     *    *
France                       12.7   262       2.42   41.2     *    *
Germany                      11.9   178       3.47   46.9     *    *
Italy                        10.0   204       1.81   35.7     *    *
Canada       43.8   1.03      6.9   248       1.55   45.6     *    *
Australia    32.4    .76      6.2   365       1.34   47.4          *
Spain                         4.4   112       1.20   34.8
Taiwan                        3.59  195              46.8
S. Korea                      3.54   91       1.38   36.5          *
Switz.       40.3    .95      3.49  567        .66   58.6
India       140     3.29      3.45    4.4     2.07    6.2          *
Brazil       37.3    .88      2.44   17.6     1.77   15.6          *
Neth.                         2.38  183        .75   49.2
Sweden                        2.29  311        .49   47.9
Belgium                       2.19  259        .45   43.6
Russia      111     2.60                      1.33   25.4          *
Poland       37.7    .89                       .47   26.5
Mexico       34.3    .81      1.96   25.9     1.14   17.5          *
Indonesia                     1.46    9.0      .86   11.1
Pakistan     17.6    .42                       .27    5.0
Argentina                                      .55   22.6          *
Indonesia                                      .86   11.1          *
S. Arabia                                      .65   53.6          *
S. Africa                                      .31   13.2          *
Turkey                                         .72   20.4          *
Other       537    12.9
Total      4259   100
Currency data for 2008
 |
 |
|---|---|
 |
 |
|---|---|
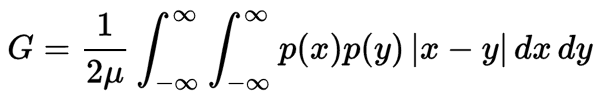
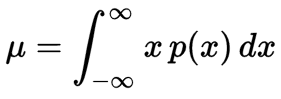
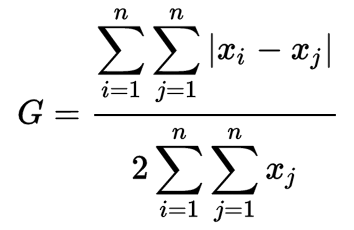
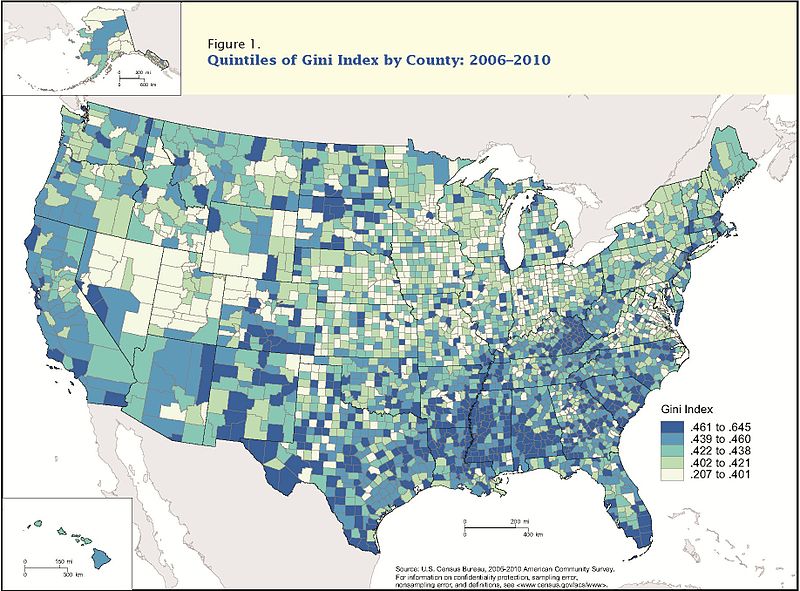
The Gini number characterizes inequality in a distribution. G=0 corresponds to perfect equality (wealth is shared equally) and G=1 corresponds to perfect inequality (all wealth is possessed by one person).
 |
 |
 |
|---|---|---|
 |
|
|---|---|
 |
|---|
 |
|---|
 |
 |
 |
|---|---|---|
 |
 |
|---|---|
Fraction of fatalities that are men          =  93%
Fatality rate averaged over all professions  =  35 fatalities per 1 million workers
Total fatalities in 2011                     =  4609

                 Men (%)   Fatalities per million workers

Logging           97.2      1024
Coal mining       94.8       124
Sawmills          94.8
Construction      91.1        97
Steel production  89         269
Sewage            88.9
Truckers          88.6       240
Fishing, hunting  88.4      1212
Taxi driver       87.4       197
Paper mills       87.4
Mining            86.9       124
Oil mining        81.7
Power lines       77.9       203
Farming           76.3       232
Pilots            66.3       570
Baker             34.6
Nurse              9.4
Receptionist       8.5
Secretary          4.7
Garbage collection           412
Roofers                      318
Finance                        9
Information                   15
Education                      7
Hospitality                   19

Average                       33
Men work on average 53 more minutes per day than women.
New jobs per year (%)
Harding/Coolidge 4.23
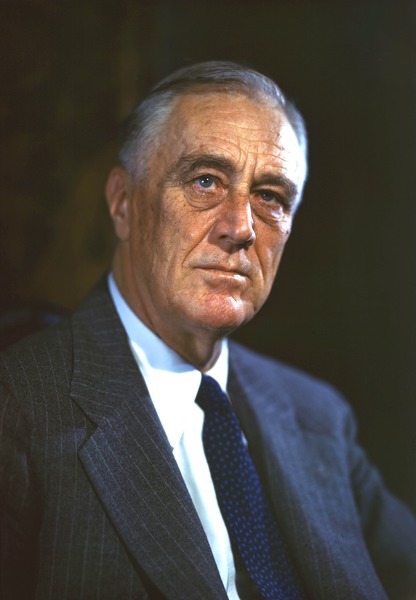
Roosevelt 4.17
Johnson 3.90
Kennedy/Johnson 2.64
Clinton 2.59
Truman 2.27
Coolidge 2.13
Reagan 2.06
Eisenhower 1.10
Nixon/Ford 1.84
Obama 1.12
Bush I .62
Bush II .12
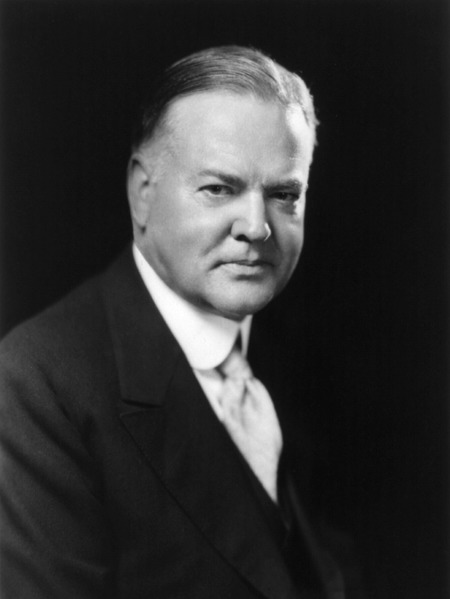
Hoover -5.41
Present workforce = 154.4 million people
                        GDP %   Job %

Real estate & renting     13      1
State & local government   9      6
Finance and insurance      8      4
Health/social care         8      9
Durable manufacturing      6     <1
Retail trade               6     10
Wholesale trade            6      4
Non-durable manufacturing  6      3
Federal government         5      2
Information                4      2
Arts & entertainment       4      1
Construction               4      4
Waste services             3      5
Other services             3     29
Utilities                  2     <1
Mining                     2     <1
Corporate management       2      1
Education services         1      3
Agriculture                1      ?
Data for 2011. The total is 13.56 trillion dollars.
               Thousands                  Thousands                     Thousands

Wal Mart          2200     JPMorgan Chase     241     Starbucks             191
McDonalds          420     Citigroup          241     Ford Motor            187
IBM                413     Deloitte           225     Starwood Hotels       180
Kroger             400     Bank of America    224     Walt Disney           180
Home Depot         371     Lowe's             220     CVS Health            178
Target             347     General Motors     216     Verizon               177
UPS                336     Aramark            216     Publix Super Markets  175
Berkshire Hath.    316     Walgreens          213     UnitedHealth Group    170
General Electric   305     Ernst & Young      212     Johnson Controls      168
Yum! Brands        303     United Tech.       212     Macy's                167
Hewlett-Packard    302     Cognizant Tech.    212     Boeing                166
FedEx              298     PricewaterhouseC.  208     Hilton World Holdings 157
PepsiCo            271     Darden Restaurants 206     Amazon.com            154
Albertsons         265     TJX                198     Costco Wholesale      154
Wells Fargo        264     HCA Holdings       197     Cargill               153
AT&T               244     Sears Holdings     196     Xerox                 148
 |
 |
|---|---|
                Assets   Profit    Employees
                  B$       B$      thousands

JP Morgan Chase   2359    21.3      259
Bank of America   2209     4.2      277
Citigroup         1865     7.4      259
Wells Fargo       1422    18.9      265
Goldman Sachs      923     7.5       58
Morgan Stanley     750     -.1       58
U.S. Bancorp       353     5.6       63
Bank of NY Mellon  359     2.6       49
HSBC N. America    319     n/a       43
Capital One        287     3.5       36
Data for 2012.
           Index  Red/Blue            Index  Red/Blue             Index  Red/Blue

North Dakota  40    2      Ohio          22   -1       Alaska        17    3
DC            30   -3      Wyoming       22    3       Montana       17    1
South Dakota  30    2      Indiana       22    1       New Jersey    17   -2
Delaware      29   -2      Georgia       22    1       Mississippi   17   +2
Nebraska      29    3      Maryland      21   -2       Pennsylvania  17   -1
Minnesota     28   -1      Colorado      21    0       Arkansas      16    0
Texas         27    2      California    21   -2       Alabama       16    2
Iowa          25    0      Illinois      21   -2       Kentucky      16    1
Michigan      25   -1      Oklahoma      21    3       New Hampshire 16    0
Arizona       23    1      Oregon        20   -2       N. Carolina   16    1
Wisconsin     23   -1      S. Carolina   20    2       Maine         16   -2
Hawaii        23   -3      Idaho         19    3       Connecticut   15   -2
Utah          22    3      Missouri      19    0       New York      15   -3
Washington    22   -2      Louisiana     19    1       West Virginia 14    0
Florida       22    0      Nevada        18    0       Vermont       13   -3
Tennessee     22    1      Kansas        18    2       New Mexico    13   -1
Massachusetts 22   -3      Virginia      18    1       Rhode Island  12   -3

The Red/Blue column denotes the average margin of victory for the past 5
presidential elections.

+3   Republican  >20
+2   Republican 10-20
+1   Republican  3-10
+0   Neutral
-1   Democrat    3-10
-2   Democrat   10-10
-3   Democrat    >20
Data for the job creation index
 |
 |
 |
|---|---|---|
Percentile  Income  Payroll  Capital  Frac of US    Frac of US      Tax
             (k$)   tax (%)  tax (%)  earnings (%)  tax income (%)  paid
                                                                    (k$)
 1-20        18.4    2.0       1.3      4.0         1.0              .607
21-40        42.5    9.1       1.6      8.4         4.4             4.55
41-60        64.5   12.7       2.5     13.1         9.2             9.80
61-80        94.1   15.7       3.7     19.3        16.5            18.26
81-100      265.7   20.1      21.4     53.9        68.9           110.3
91-100      394.5   20.7      26.7     42.0        55.0           187.0
96-100      611.2   20.9      32.1     32.3        44.3           323.9
100-100    1873     20.6      43.4     19.4        28.1          1199
Top 400  344832     16.6      81.3                             337600

Income                =  Mean income for the tax bracket
Payroll tax           =  Mean payroll tax for the tax bracket
Capital tax           =  Fraction of payroll earnings going to tax
Capital tax           =  Fraction of capital gains going to tax
Frac of US earnings   =  Fraction of individual and corporate earnings
Frac of US tax income =  Fraction contributed to total US tax income

Tax revenue           =  2400 billion $
Tax paying households = 118.7 million
Tax per household     = 20200 $
          1-20   21-40   41-60   61-80   81-100   96-100   1-100

Asian      .624    .593    .786    .871   1.265    .366    4.140
White    16.940  18.424  18.978  19.215  19.721   5.029   92.702
Hispanic  3.023   3.130   2.863   1.931   1.204    .269   12.838
Black     4.474   3.339   2.637   2.053   1.287    .236   13.792
Numbers in millions of people.
 |
|---|
Percent change from 2007 to 2014.
Health care       24.8
Food at home      -3.6
Housing           -6.0
Transport         -6.4
Total food        -7.6
Food not at home -13.4
Clothing         -18.8
Total             -6.3
 |
|---|
 |
 |
|---|---|
           2015  2016   % change

Bronze      292   319     9
Silver      341   389    14
Gold        397   459    16
Age    Fraction

0-14    .198         Each year of age contains a fraction of .0132 of the population
15-64   .668
65-200  .134
        Population   Births/women/year
         fraction

White      .724       .0188
Hispanic   .163       .0213
Black      .126       .0187
Asian      .0475      .0172
Native     .0112      .0129
Data from Wikipedia for 2014.
 |
.jpg) |
.jpg) |
 |
 |
 |
 |
 |
|---|---|---|---|---|---|---|---|
 |
.jpg) |
 |
 |
 |
 |
 |
|
|---|---|---|---|---|---|---|---|
 |
 |
 |
 |
 |
.jpg) |
 |
 |
|---|---|---|---|---|---|---|---|
 |
 |
 |
 |
 |
 |
 |
|
|---|---|---|---|---|---|---|---|
 |
 |
 |
 |
 |
 |
 |
 |
|---|---|---|---|---|---|---|---|
 |
 |
 |
.jpg) |
|---|---|---|---|
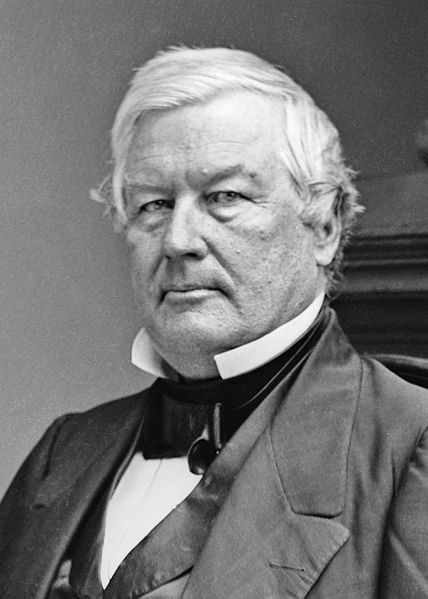
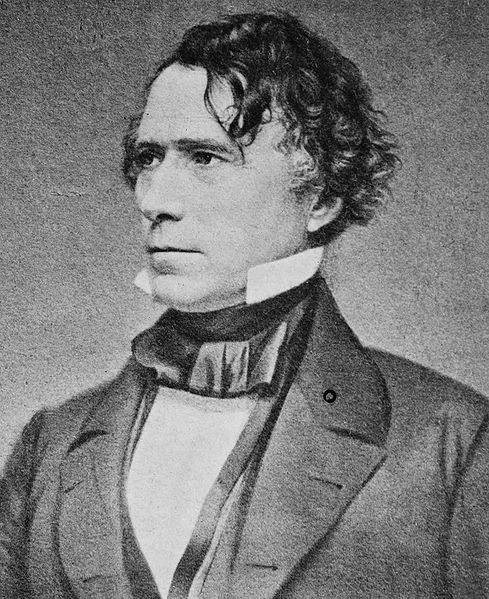
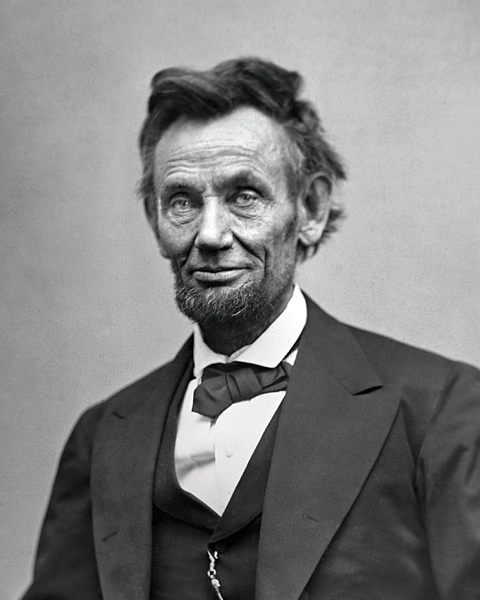
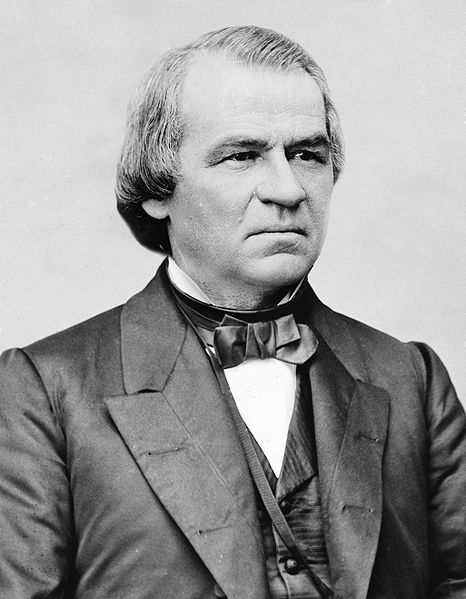
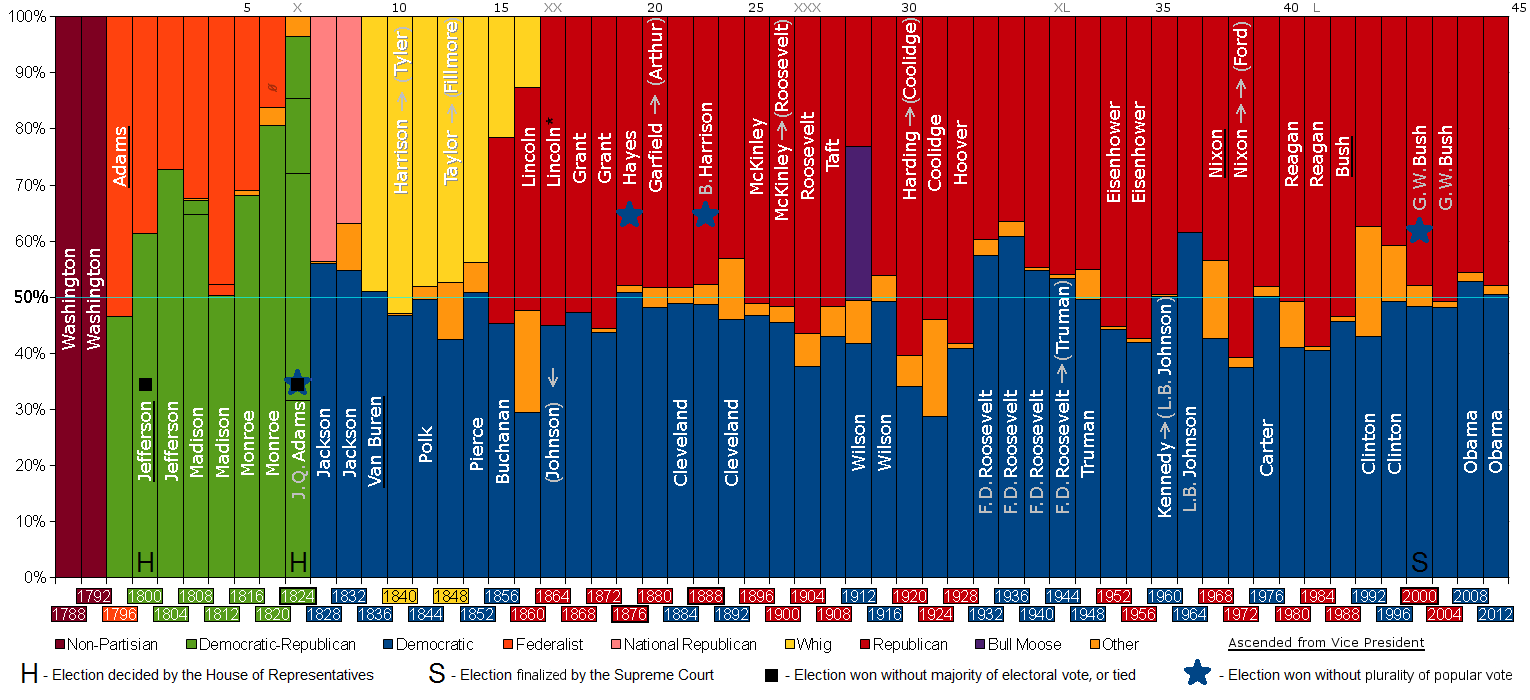
Party Rank Losing Party Electoral Fate
candidate margin
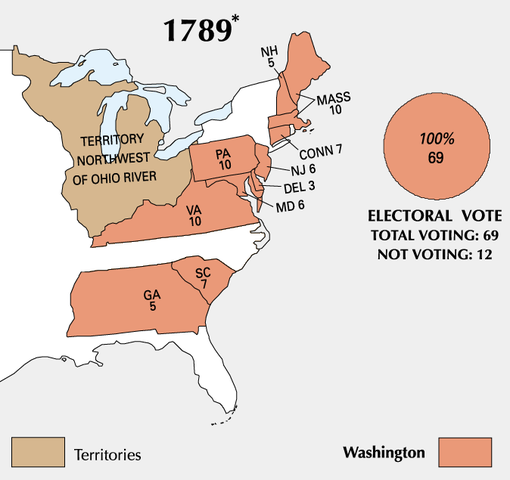
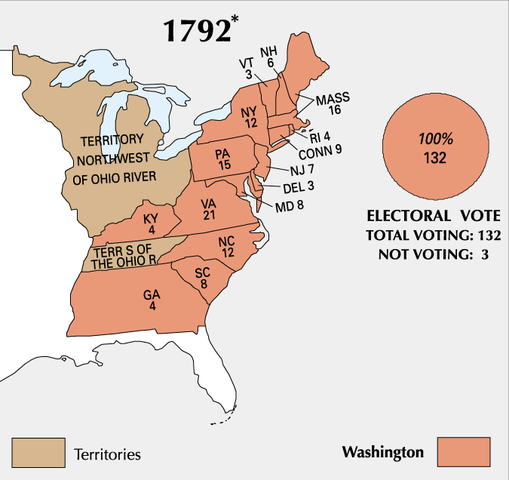
1 1789 Washington - 3 J. Adams - 69 0
1793 Washington - J. Adams F 132 0 Retired
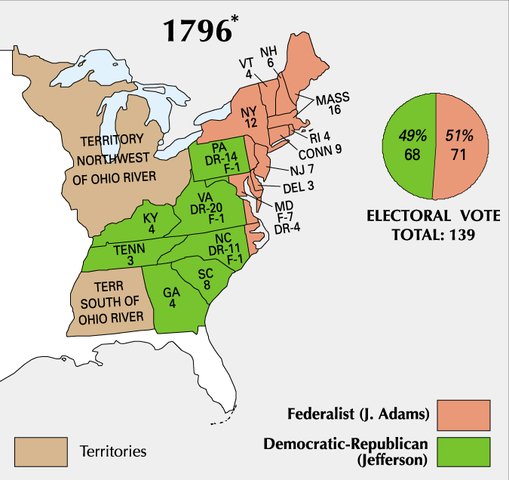
2 1797 J. Adams F 12 Jefferson DR 71 68 Defeated in presidential election
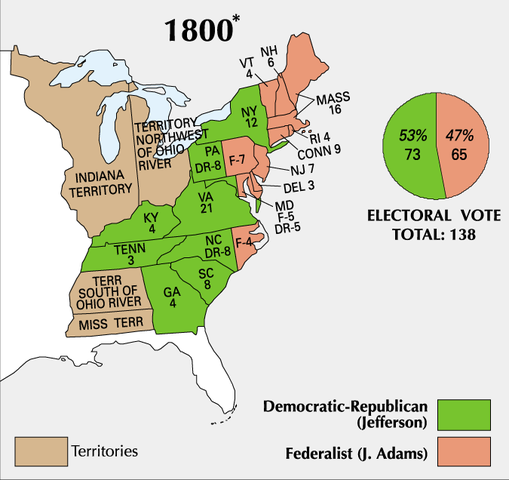
3 1801 Jefferson DR 4 Burr DR 73 65
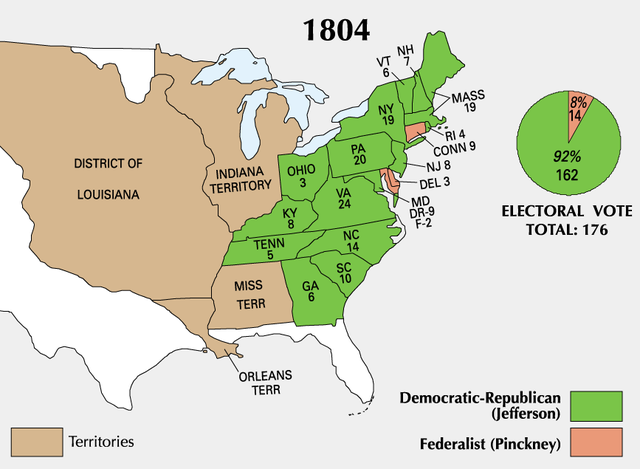
1805 Jefferson DR Pinckney F 162 14 Retired
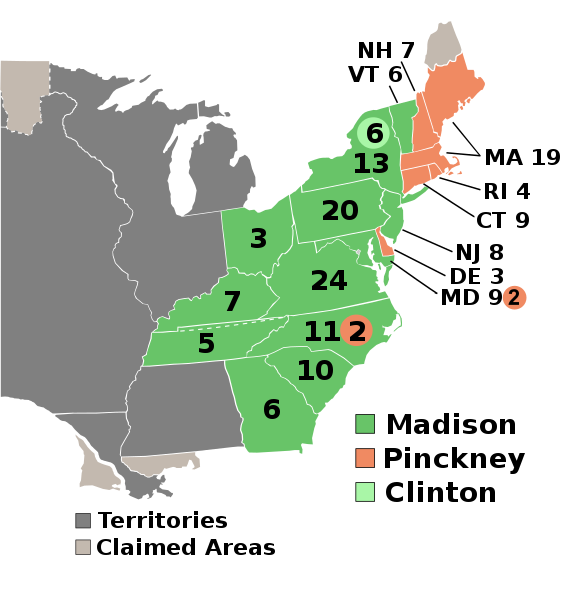
4 1809 Madison DR 14 Pinckney F 122 47 6
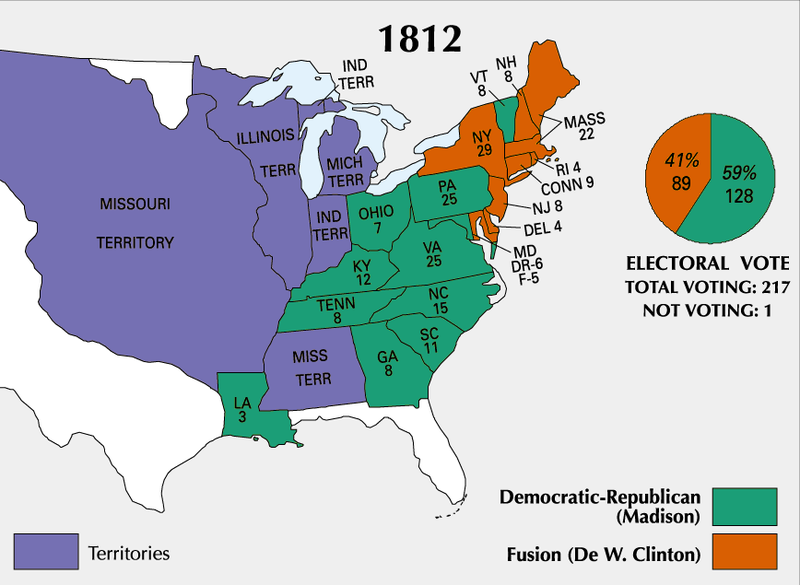
1813 Madison DR Clinton F 128 89 Retired
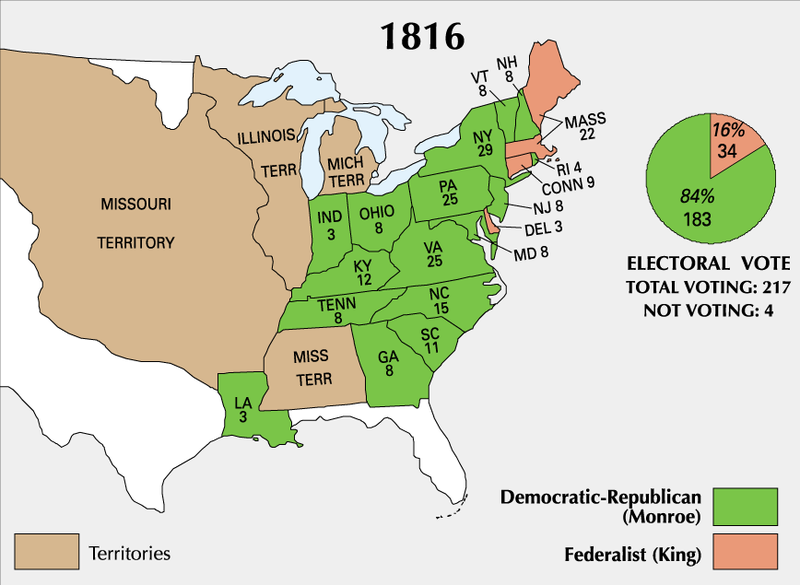
5 1817 Monroe DR 16 King F 183 34
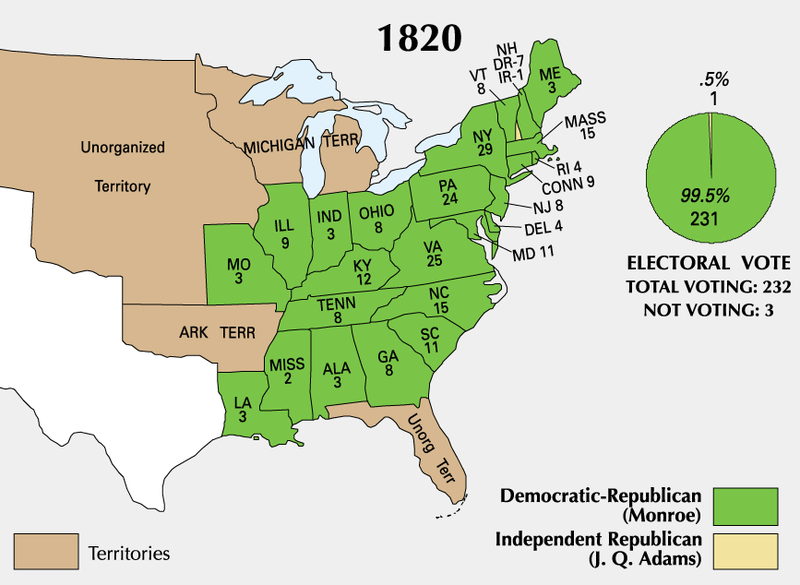
1821 Monroe DR J.Q. Adams DR 231 1 Retired
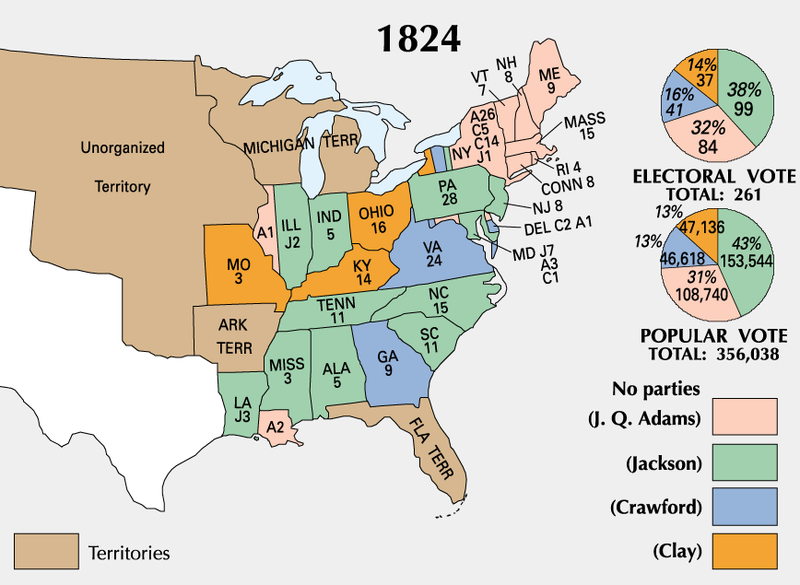
6 1825 J.Q. Adams DR 21 Jackson DR 84 99 41 37 Defeated in presidential election
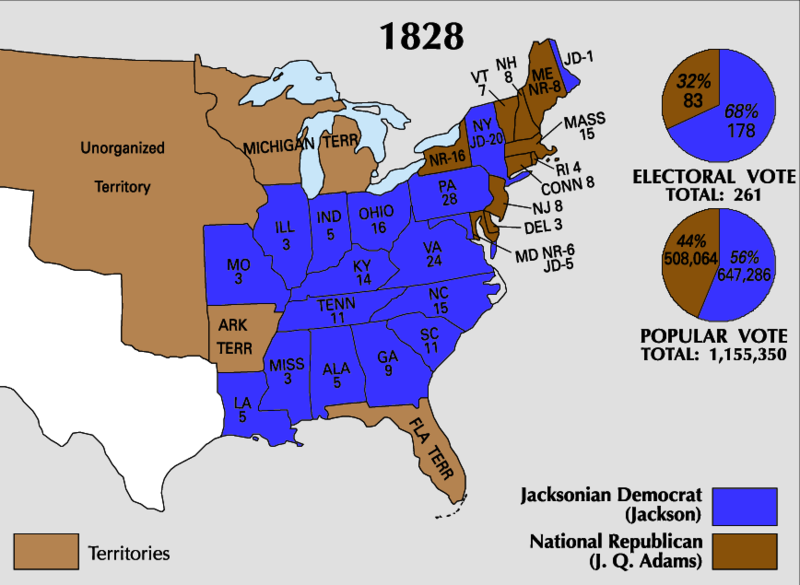
7 1829 Jackson D 8 J.Q. Adams NR 178 83
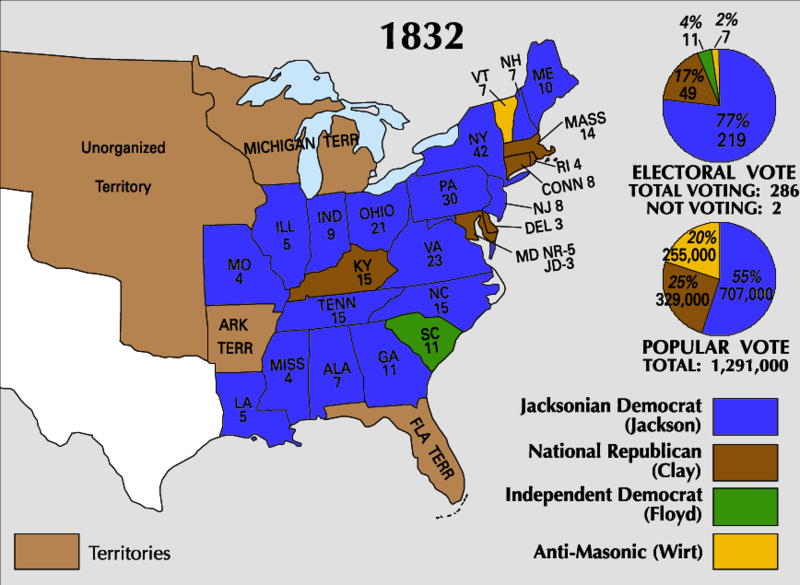
1833 Jackson D Clay NR 219 49 11 7 Retired
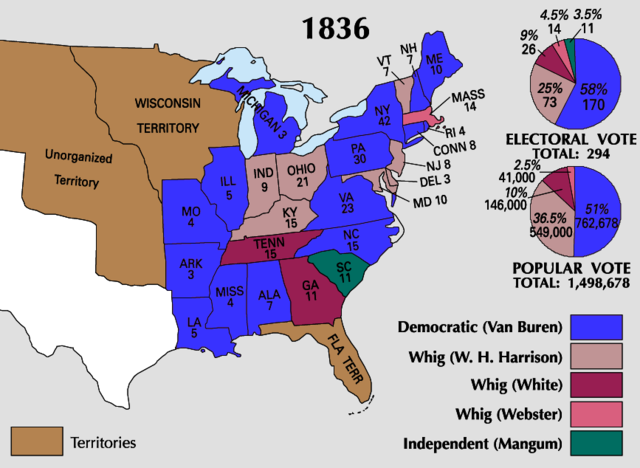
8 1837 Van Buren D 24 W.Harrison W 170 73 26 14 11 Defeated in presidential election
9 1841 W. Harrison W 39 Van Buren D 234 60 Died in office
10 VP Tyler W 37 Defeated in primary
11 1845 Polk D 10 Clay W 170 105 Retired
12 1849 Tayler W 35 Class D 163 127 Died in office
13 VP Filmore W 38 Defeated in primary
14 1853 Pierce D 41 Scott W 254 42 Defeated in primary
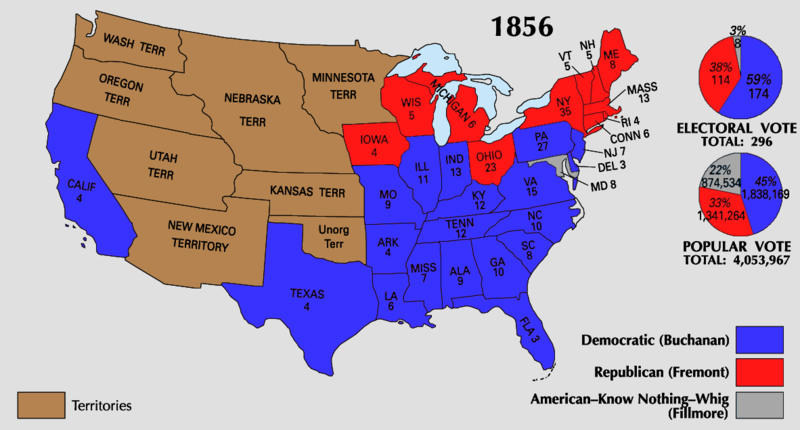
15 1857 Buchanan D 43 Fremont R 174 114 8 Retired
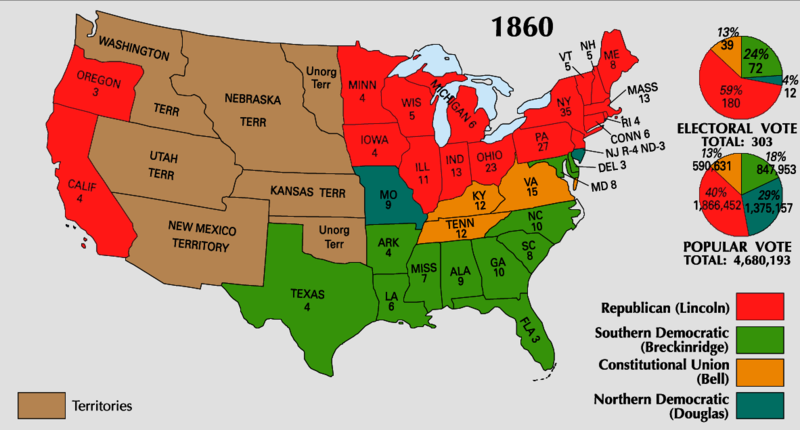
16 1861 Lincoln R 1 Breckin. SD 180 72 39 12
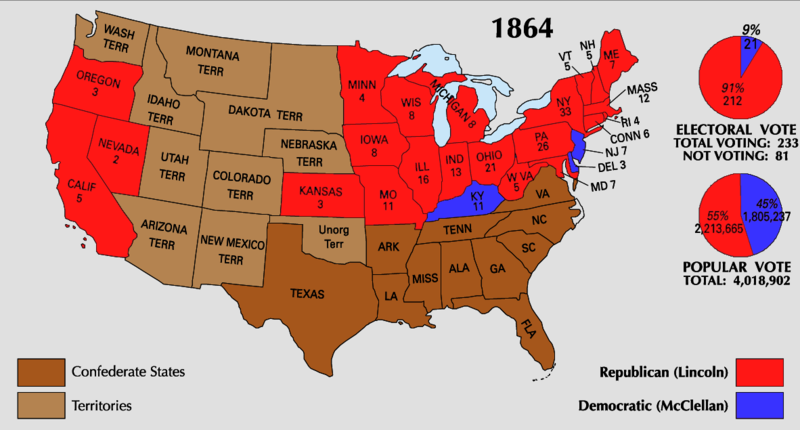
1865 Lincoln NU McClellan D 212 21 Assassinated
17 VP Johnson NU 40 Defeated in primary
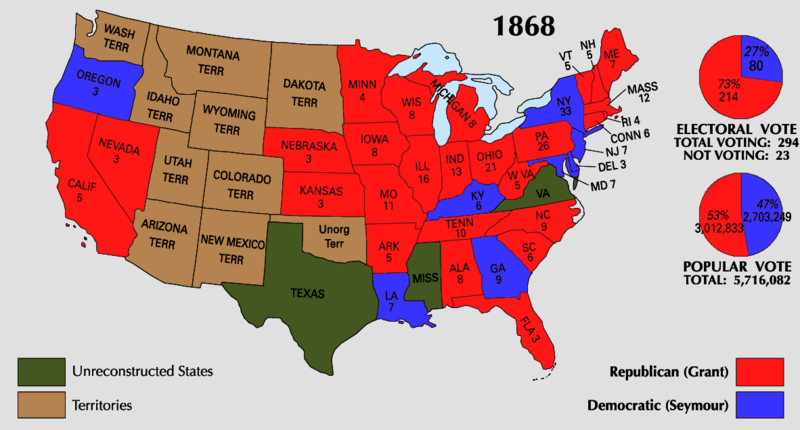
18 1869 Grant R 36 Seymour D 214 80
1873 Grant R Hendricks D 286 42 18 2 Retired
19 1877 Hayes R 25 Tilden D 185 184 Retired
20 1881 Garfield R 31 Hancock D 214 155 Assassinated
21 VP Arthur R 28 Defeated in primary
22 1885 Cleveland D 18 Blaine R 219 182 Defeated in presidential election
23 1889 B. Harrison R 29 Cleveland D 233 168 Defeated in presidential election
24 1893 Cleveland D 18 B.Harrison R 277 145 22 Defeated in primary
25 1897 McKinley R 19 Bryan DP 271 176
1901 McKinley R Bryan D 292 155 Assassinated
26 VP T. Roosevelt R 5
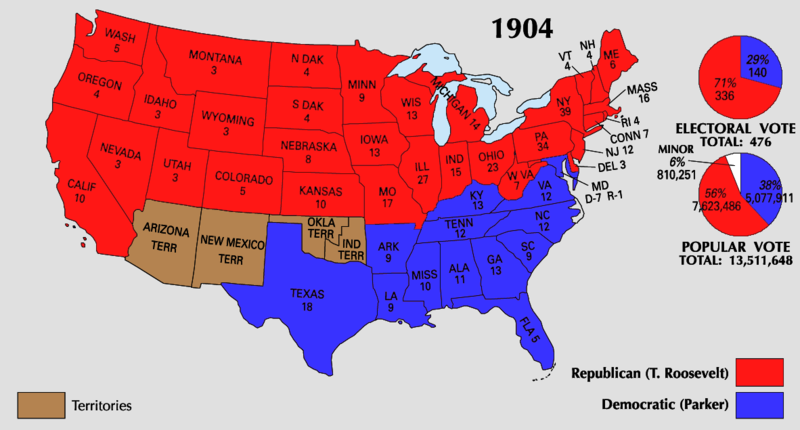
1905 T. Roosevelt R Parker D 336 140 Retired. Had pledged not to seek a third term
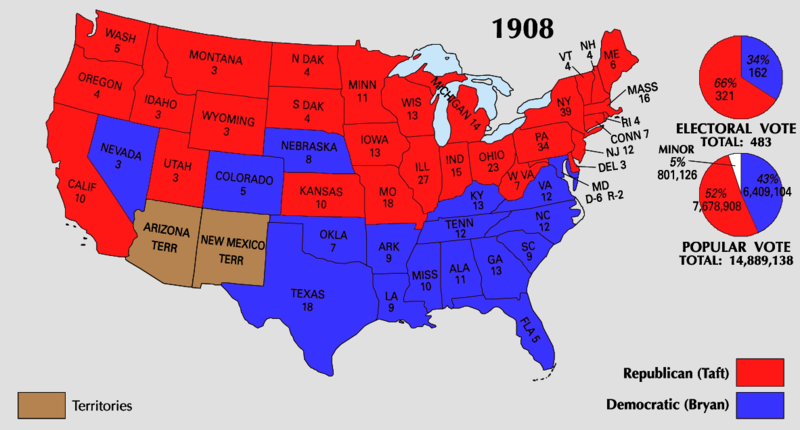
27 1909 Taft R 23 Bryan D 321 162 Lost in presidential election
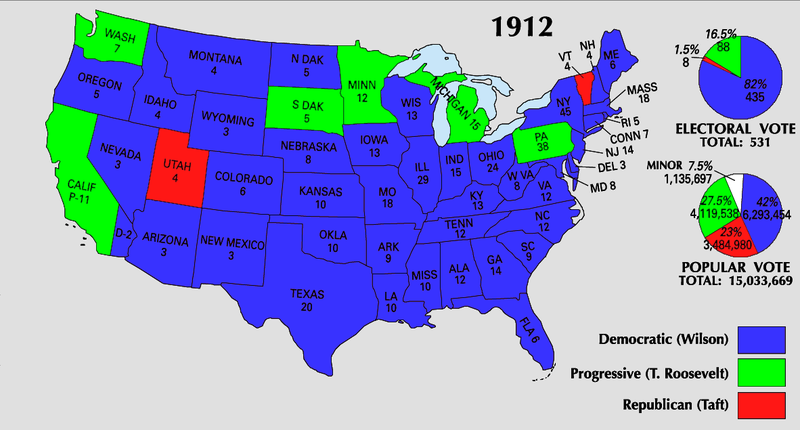
28 1913 Wilson D 7 Roosevelt P 435 88 8
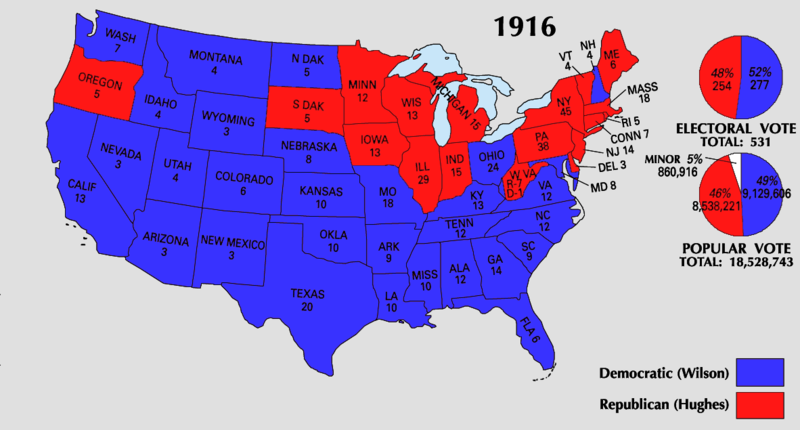
1917 Wilson D Hughes R 277 254 Would not have been nominated by his party
29 1921 Harding R 42 Cox D 404 127 Died in office
VP Coolidge R 30
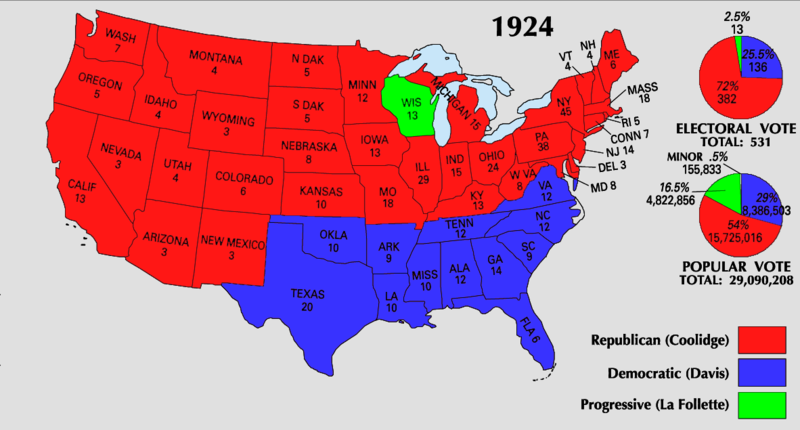
1925 Coolidge R Davis D 382 136 13 Retired
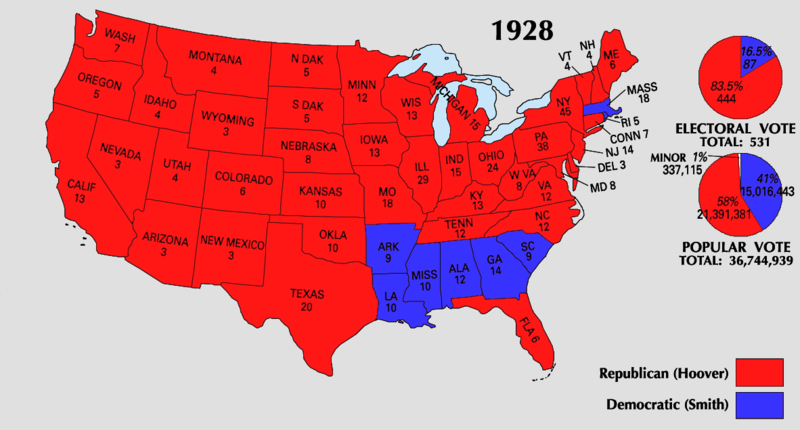
31 1929 Hoover R 32 Smith D 444 87 Defeated in presidential election
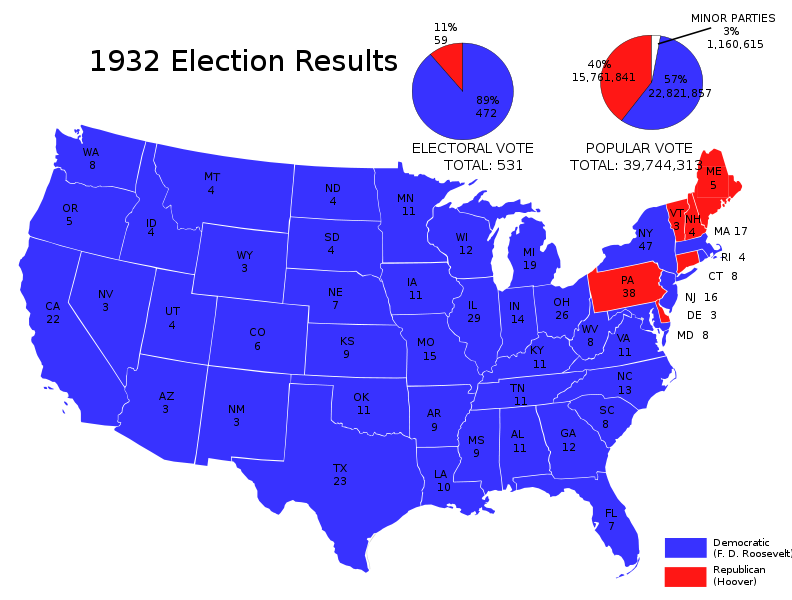
32 1933 F. Roosevelt D 2 Hoover R 472 59
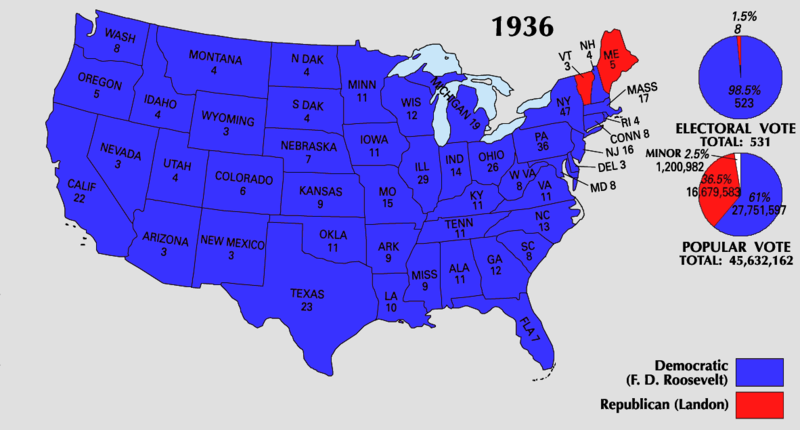
1937 F. Roosevelt D Landon R 523 8
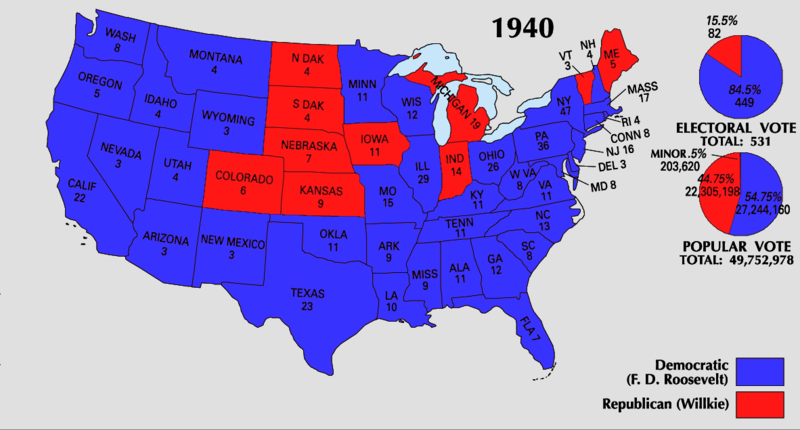
1941 F. Roosevelt D Willkie R 449 82
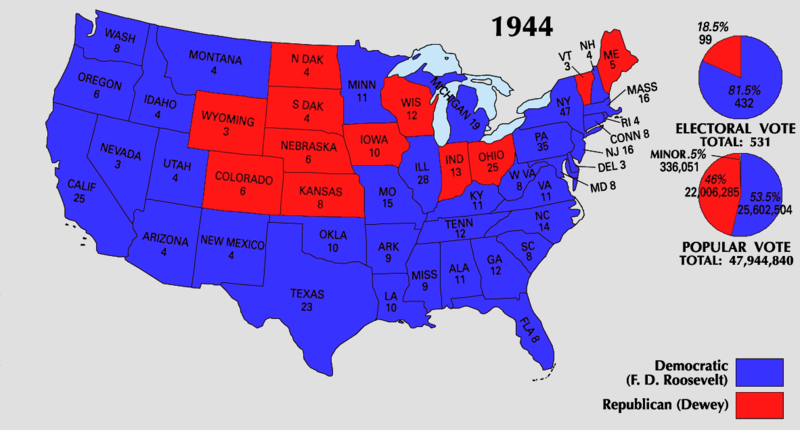
1945 F. Roosevelt D Dewey R 432 99 Died in office
VP Truman D 6
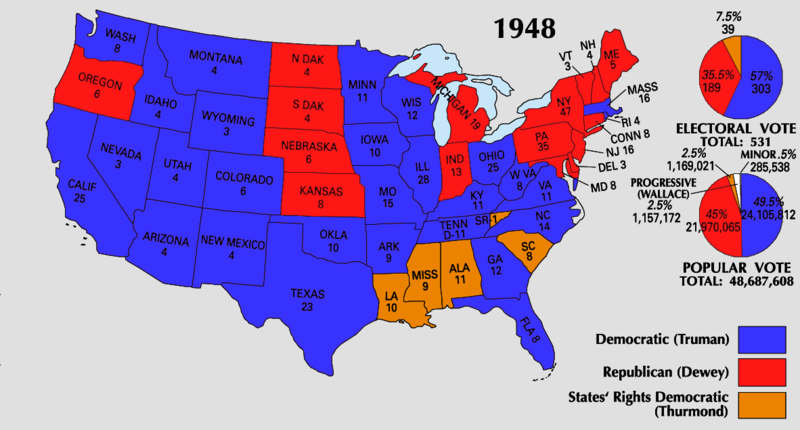
33 1949 Truman D Dewey R 303 189 39 Defeated in primary
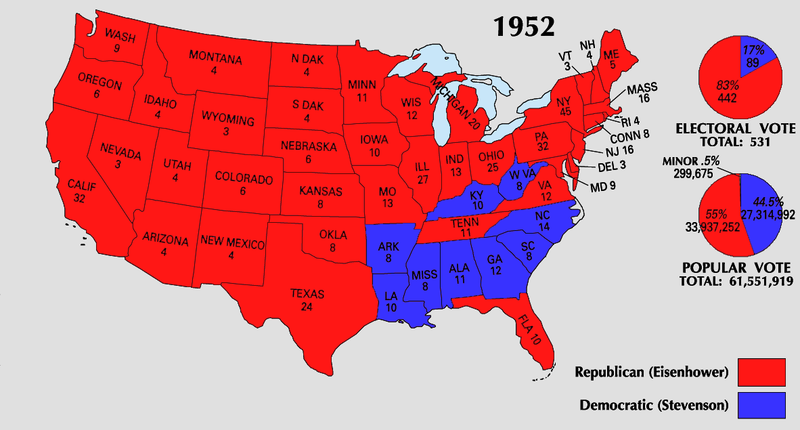
34 1953 Eisenhower R 9 Stevenson D 442 89
1957 Eisenhower R Stevenson D 457 73 Term limited
35 1961 Kennedy D 11 Nixon R 303 219 15 Assassinated
36 VP Johnson D 13
1965 Johnson D Goldwater R 486 52 Defeated in primary
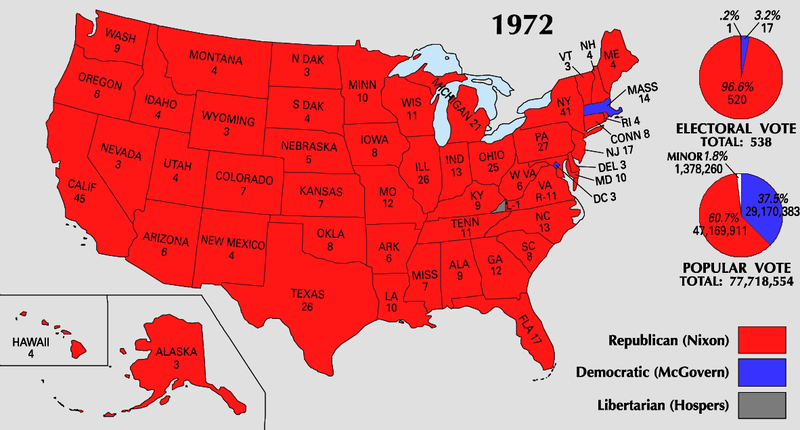
37 1969 Nixon R 33 Humphrey D 301 191 46
1973 Nixon R McGovern D 520 17 1 Resigned
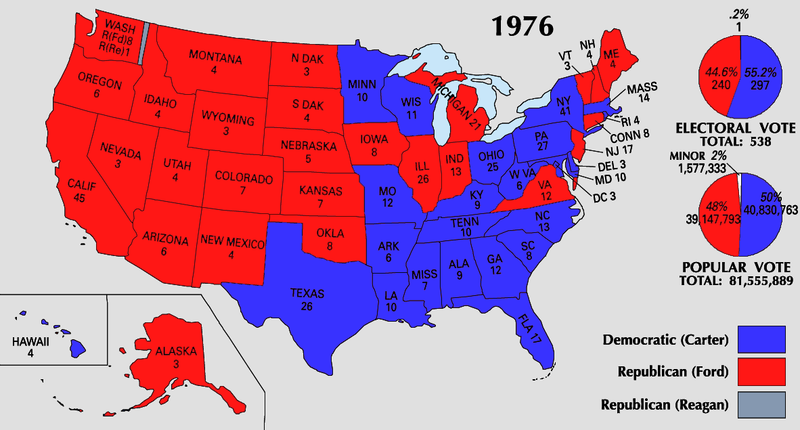
VP Ford R 26 Defeated in presidential election
39 1977 Carter D 27 Ford R 297 240 Defeated in presidential election
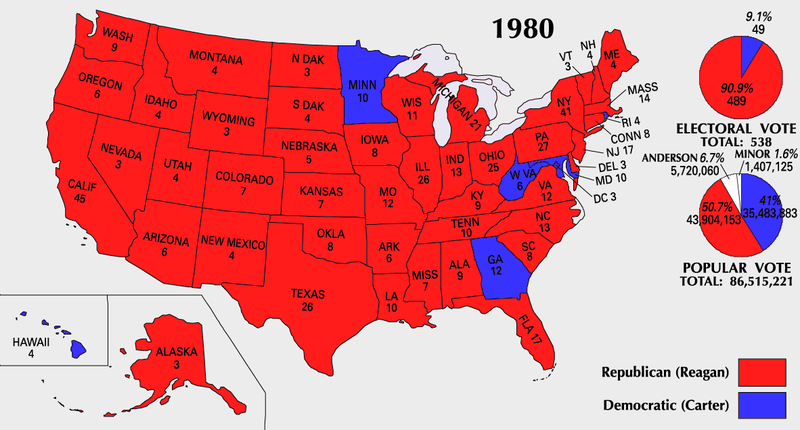
40 1981 Reagan R 15 Carter D 489 49
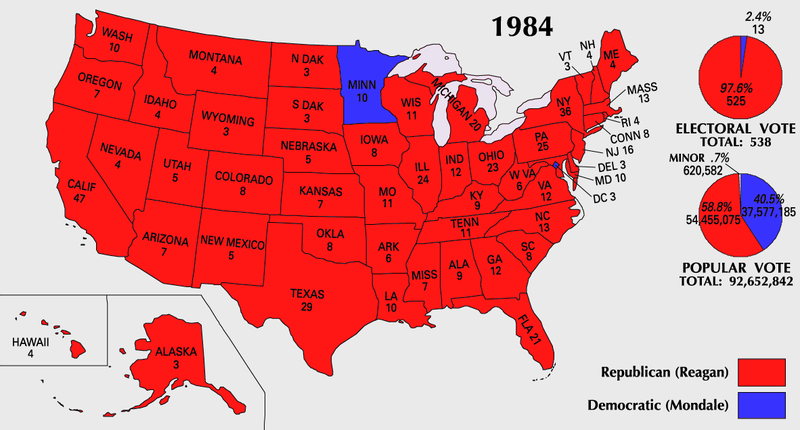
1985 Reagan R Mondale D 525 13 Term limited
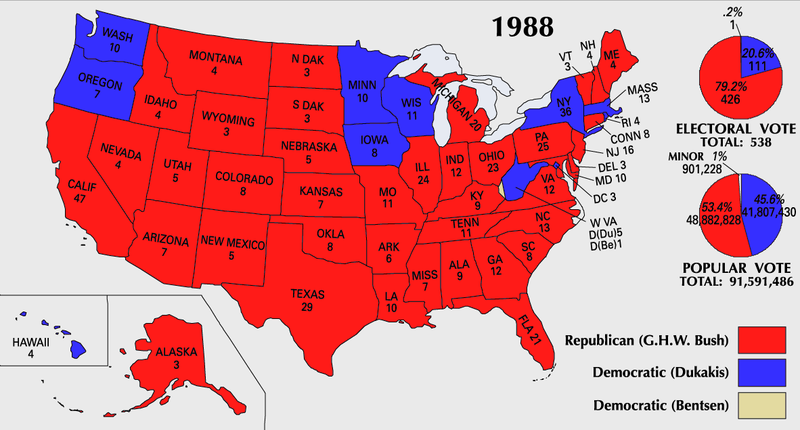
41 1989 Bush R 22 Dukakis D 426 111 Defeated in presidential election
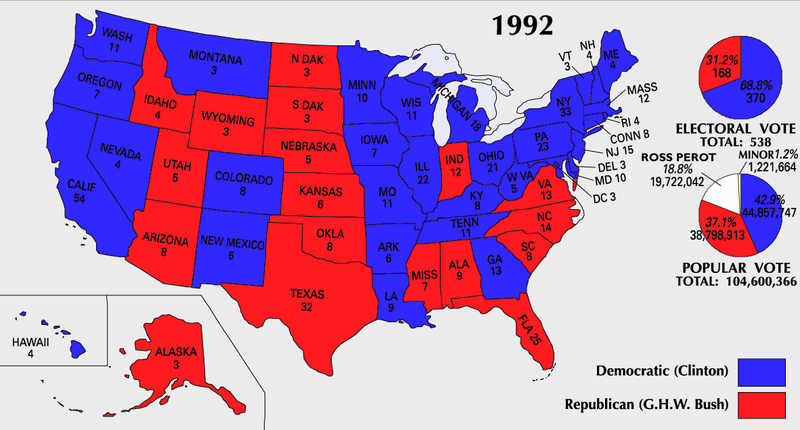
42 1993 Clinton D 20 Bush R 370 168
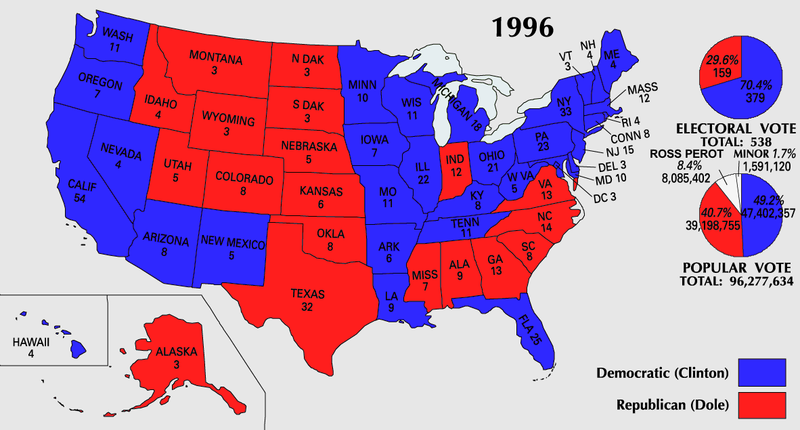
1997 Clinton D Dole R 379 159 Term limited
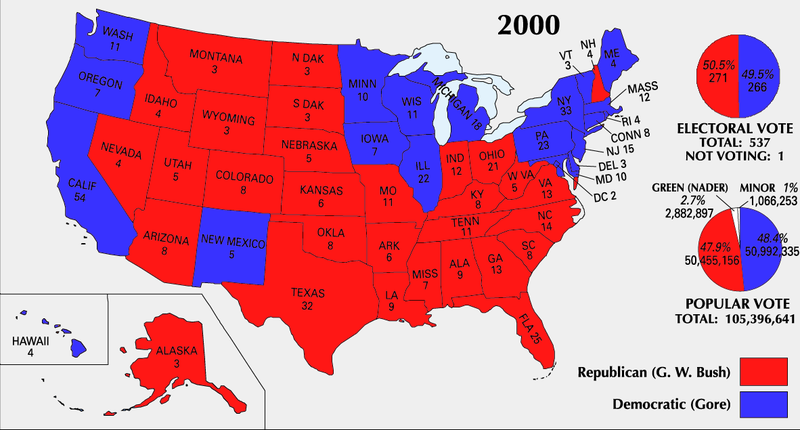
43 2001 Bush R 34 Gore D 271 266
2005 Bush R Kerry D 286 251 Term limited
44 2009 Obama D 17 McCain R 365 173
2013 Obama D Romney R 332 206 Term limited
45 2017 Trump R Clinton D 306 232
Rank Party Rank Party Rank Party
Lincoln 1 R Monroe 16 D-R Garfield 31 R
Roosevelt, F. 2 D Obama 17 D Hoover 32 R
Washington 3 I Cleveland 18 D Nixon 33 R
Jefferson 4 D-R McKinley 19 R Bush II 34 R
Roosevelt, T. 5 R Clinton 20 D Taylor 35 W
Truman 6 D Adams, JQ 21 D-R Grant 36 R
Wilson 7 D Bush I 22 R Tyler 37 W
Jackson 8 D Taft 23 R Fillmore 38 W
Eisenhower 9 R Van Buren 24 D Harrison, W 39 W
Polk 10 D Hayes 25 R Johnson, A 40 D
Kennedy 11 D Ford 26 R Pierce 41 D
Adams, J. 12 F Carter 27 D Harding 42 R
Johnson, L. 13 D Arthur 28 R Buchanan 43 D
Madison 14 D-R Harrison, B 29 R
Reagan 15 R Coolidge 30 R
R Republican
D Democrat
W Whig
D-R Democratic-Republican party
I Independent
Presidental 4-year terms:
Republican 23
Democrat 22
Democratic Republican 7
Whig 4
Independent 2
Federalist 1
National Union 1
|
|
|---|---|
                    Party  Rank     Losing     Party   Electoral       Fraction
                                    candidate          margin          of votes

1793  Washington    -   3       J. Adams   F   132    0             1
1789  Washington    -   3       J. Adams   -    69    0             1
1821  Monroe        DR 16       J.Q. Adams DR  231    1              .996
1937  F. Roosevelt  D   2       Landon     R   523    8              .985
1985  Reagan        R  15       Mondale    D   525   13              .976
1973  Nixon         R  33       McGovern   D   520   17              .97
1805  Jefferson     DR  4       Pinckney   F   162   14              .92
1981  Reagan        R  15       Carter     D   489   49              .91
1865  Lincoln       NU  1       McClellan  D   212   21              .91
1965  Johnson       D  13       Goldwater  R   486   52              .90
1933  F. Roosevelt  D   2       Hoover     R   472   59              .89
1957  Eisenhower    R   9       Stevenson  D   457   73              .86
1853  Pierce        D  41       Scott      W   254   42              .86
1941  F. Roosevelt  D   2       Willkie    R   449   82              .85
1817  Monroe        DR 16       King       F   183   34              .84
1929  Hoover        R  32       Smith      D   444   87              .84
1953  Eisenhower    R   9       Stevenson  D   442   89              .83
1873  Grant         R  36       Hendricks  D   286   42  18   2      .82
1913  Wilson        D   7       Roosevelt  P   435   88   8          .82
1945  F. Roosevelt  D   2       Dewey      R   432   99              .81
1841  W. Harrison   W  39       Van Buren  D   234   60              .80
1989  Bush          R  22       Dukakis    D   426  111              .79
1833  Jackson       D   8       Clay       NR  219   49  11   7      .77
1921  Harding       R  42       Cox        D   404  127              .76
President     Secretary of State

Washington    Jefferson
Jefferson     Madison
Madison       Monroe
Monroe        J.Q. Adams
Jackson       Van Buren
Polk          Buchanan
The possible outcomes at the end of a presidential term are:
Won reelection                 22   Washington   Jefferson   Madison    Monroe      Jackson      Lincoln  Grant
                                    McKinley     T Roosevelt Wilson     Coolidge    F Roosevelt(x3)       Truman
                                    Eisenhower   Johnson     Nixon      Reagan      Clinton      Bush II  Obama
Retired                        12   Washington   Jefferson   Madison    Monroe      Jackson      Polk     Buchanan
                                    Grant        Hayes       Arthur     T Roosevelt Coolidge
Lost reelection                11   J Adams      JQ Adams    Van Buren  Cleveland   B Harrison   Taft     Hoover
                                    Ford         Carter      Bush I     Trump
Lost in primary                 8   Tyler        Filmore     Pierce     A Johnson   Cleveland    Wilson   Truman
                                    L Johnson
Term limited                    5   Eisenhower   Reagan      Clinton    Bush II     Obama
Died of natural causes          4   W Harrison   Tayler      Harding    F Roosevelt
Assassinated                    4   Lincoln      Garfield    McKinley   Kennedy
Resigned                        1   Nixon
Total                          67
Former presidents who ran for the presidency after a term out of office: Cleveland, Van Buren, Fillmore, Grant, T. Roosevelt, Hoover. Only Cleveland succeeded.
People that lost a presidential election but later became president: J. Adams, Jefferson, J.Q. Adams, Jackson, W. Harrison, Cleveland, F. Roosevelt, Nixon.
In 1884, Arthur placed 2nd in primary voting but he didn't campaign. He had health problems and wished to retire.
In 1888, Cleveland was the incumbent president and he was renominated, and he lost the general election. In 1896, Cleveland was the incumbent president and he lost the primary.
          GDP     Job    Workforce  Home  Fed spend  Budget surplus
         growth  growth  particip.  own    per GDP      per GDP
          %/yr    %/yr     %/yr     %/yr      %           %/yr

Carter     3.0    3.1     .8        .2      19.5        -2.0
Reagan     3.8    2.2     .4       -.2      21.0        -3.5
Bush I     2.0     .6     .0        .1      20.5        -3.5
Clinton    4.2    2.6     .1        .4      18.5        -2.0
Bush II    2.1     .0    -.2        .0      18.5        -1.5
Obama      2.0     .9    -.5       -.5      22.0        -5.5
Data
 |
 |
 |
|---|---|---|
 |
 |
 |
|---|---|---|
 |
 |
 |
|---|---|---|
 |
 |
 |
|---|---|---|
 |
 |
 |
|---|---|---|
 |
 |
 |
|---|---|---|
 |
 |
 |
|---|---|---|
 |
 |
 |
|---|---|---|
 |
 |
 |
|---|---|---|
 |
 |
|
|---|---|---|
 |
 |
 |
|---|---|---|
 |
 |
 |
|---|---|---|
 |
 |
 |
|---|---|---|
 |
 |
 |
|---|---|---|
 |
 |
 |
|---|---|---|
 |
 |
 |
|---|---|---|
 |
 |
 |
|---|---|---|
 |
 |
 |
|---|---|---|
 |
 |
 |
|---|---|---|
 |
 |
|---|---|
We show a subset of the history to illustrate the evolution.
|
|
|
|
|---|---|---|---|
|
|
|---|---|
|
|---|
 |
|---|
 |
|---|
 |
|---|
 |
 |
 |
|---|---|---|
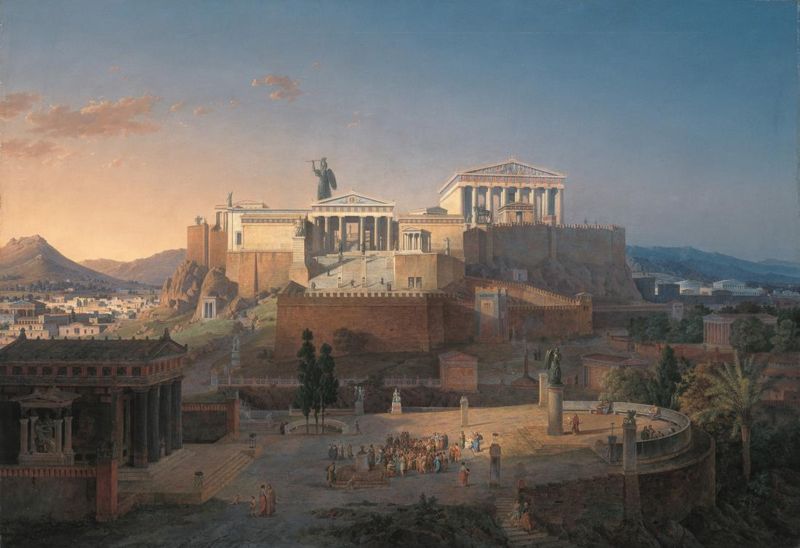
 ~800     Oracle of Delphi established in Ancient Greece
 ~770     Spartan democracy established with a constitution written by Lycurgus and endorsed
             by the Oracle of Delphi
 -510     Athenian democracy established by Cleisthenes, after the overthrow of King Hippias
 -509     Roman Republic founded, replacing monarchy rule
 1215     English Magna Carta
 1660     Royal Society founded by Christopher Wren
 1666     French Academy of Sciences founded
 1688     England, Revolutionary Settlement.  Parliament enacts laws limiting
          the power of the king.
 1689     England, Bill of Rights and Mutiny Bill
 1694     England, Triennial Bill
 1696     England, Treason Act
 1701     England, Act of Settlement
 1769     Golden age of the American Philosophical Society begins as Benjamin
             Franklin becomes president.  Members included Jefferson, Washington,
             Hamilton, Adams, Madison, Paine, and McHenry.
 1775     American patriots form Provisional Congresses in each of the 13 colonies that are
             independent of Great Britain, and they form a unified Continental Congress
 1776     American Declaration of Independence, July 4
 1781     American Articles of Confederation
 1787     Federalist Papers published by Hamilton, Madison, & Jay
 1788     American Constitution established
 1791     American Bill of Rights
 1810     Modern era of British Prime Ministers begins when King George III goes insane
 1830     England, Westminster system of government established (Parliament)
 1911     England, Parliament Act, lessening the power of the House of Lords
 1949     British Parliaments acts of 1949
 2014     British House of Lords Reform Act of 2014
 |
|---|
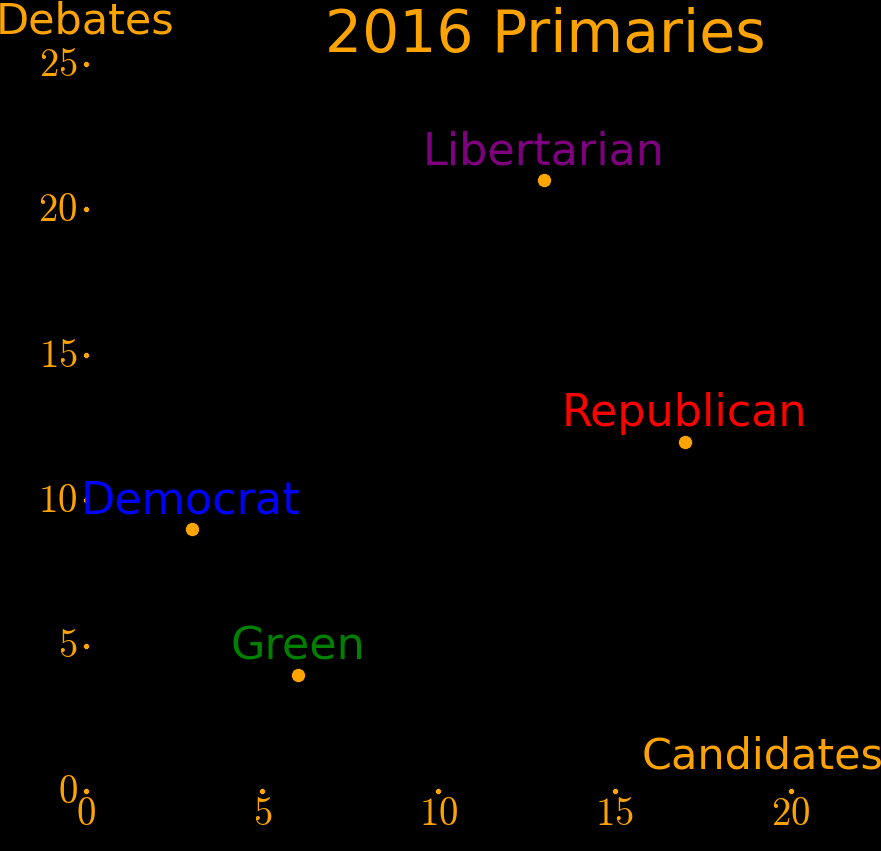
           Votes   Candidates  Debates  States   Popular     Super
         (millions)                             delegates  delegates

Democrat     31.22       3        9      50      4051        712
Republican   30.64      17       12      50      2472          0
Libertarian    .03      13       21       6       n/a        n/a
Green          .02       6        4      35       402          0


          Votes   Vote %    Total     Popular     Super     States
                          delegates  delegates  delegates

Trump    14013998   44.9     1441      1441          -        36      Republican
Cruz      7822100   25.1      551       551          -        11
Kasich    4290448   13.8      161       161          -         1
Rubio     3515576   11.3      173       173          -         1

Clinton  16912545   55.2     2842      2271.5      570.5      28      Democrat
Sanders  13206428   43.1     1865      1821.5       44.5      22
O'Malley        ?    ?          0                    1         0

Johnson     22642   59.6      n/a       n/a          -         5      Libertarian
McAfee       3391    8.9      n/a       n/a          -         0
Peterson     3066    8.1      n/a       n/a          -         0

Stein       13231    ?        269.5     269.5        -        34      Green
Kreml           ?    ?         18.5      18.5        -         1
 |
 |
_under_the_Verrazano_Narrows_Bridge.jpg) |
 |
|---|---|---|---|
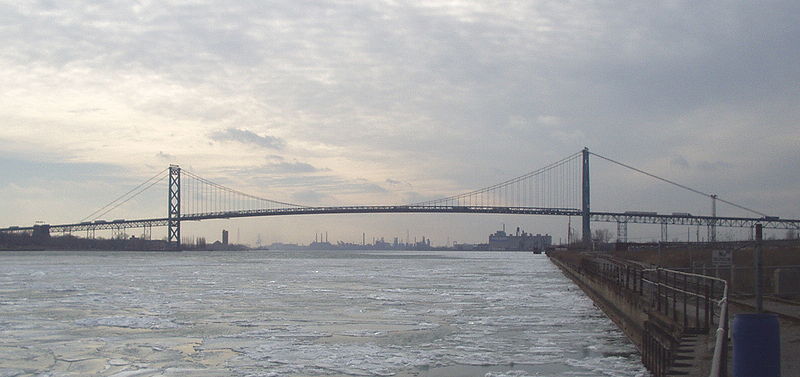
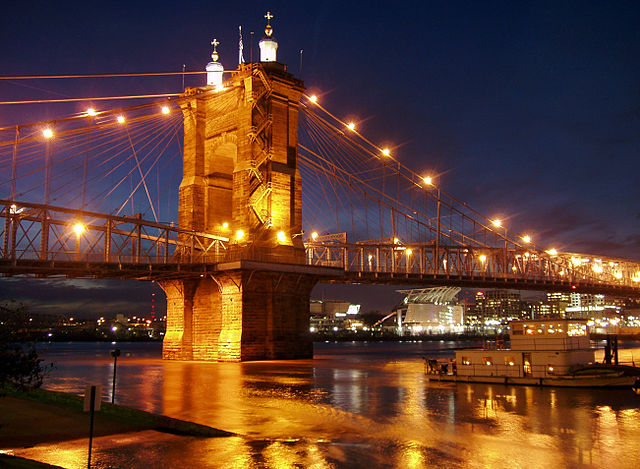
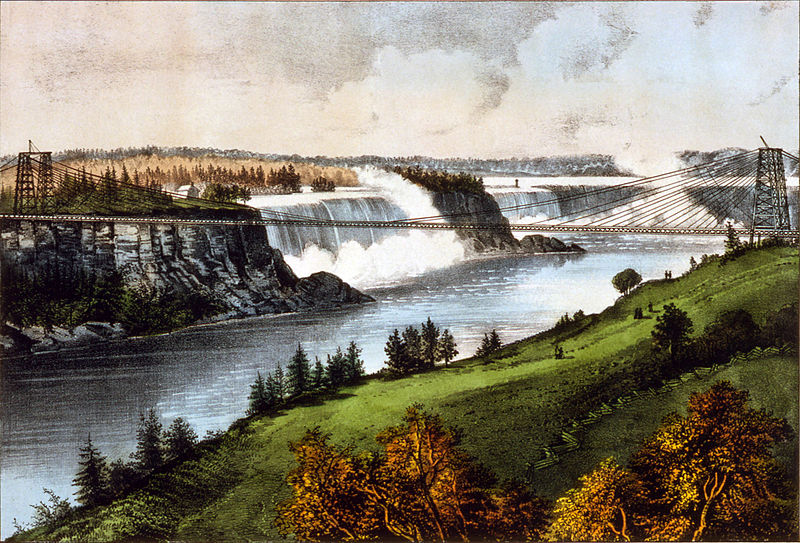
American suspension bridges have held the world record for length from 1849 to 1981.
In 1939 the world's 9 longest suspension bridges were American.
                    Year  Length   World record

Wheeling            1849   308          *       West Virginia
Queenston-Lewiston  1851   317          *       Niagara
John A. Roebling    1866   322          *       Kentucky, Ohio
Niagara Clifton     1869   384          *       Niagara
Brooklyn            1883   486          *       New York City
Williamsburg        1903   488          *       New York City
Bear Mountain       1924   497          *       New York, Hudson River
Benjamin Franklin   1926   534          *       Pennsylvania, New Jersey
Ambassador          1929   564          *       Detroit, Ontario
George Washington   1931  1067          *       New York City
Oakland Bay         1936   704                  San Francisco Bay
Triborough Bridge   1936   421                  Queens and Wards Island
Golden Gate         1937  1280                  San Francisco Bay
Bronx-Whitestone    1939   701                  New York City
Tacoma Narrows II   1950   853                  New York City
Delaware Memorial   1951   656                  Delaware River
Mackinac            1957  1158                  Michigan, Upper and Lower Penninsula
Walt Whitman        1957   610                  Delaware River
Throggs Neck        1961   549                  New York City
Verrazano-Narrows   1964  1298          *       New York City
 |
 |
 |
|---|---|---|
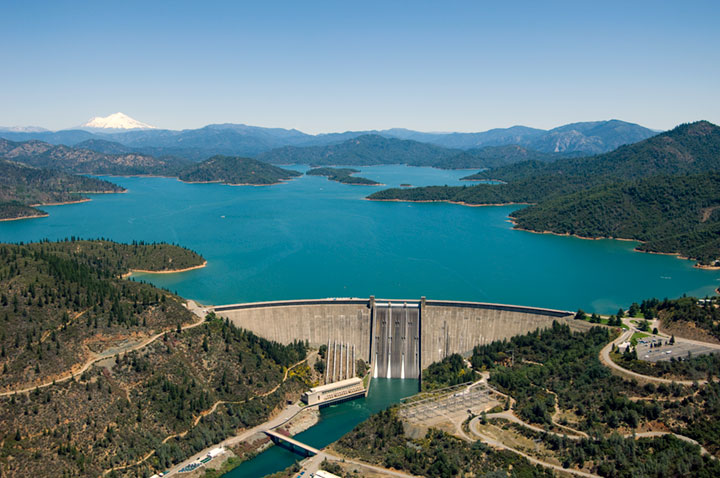
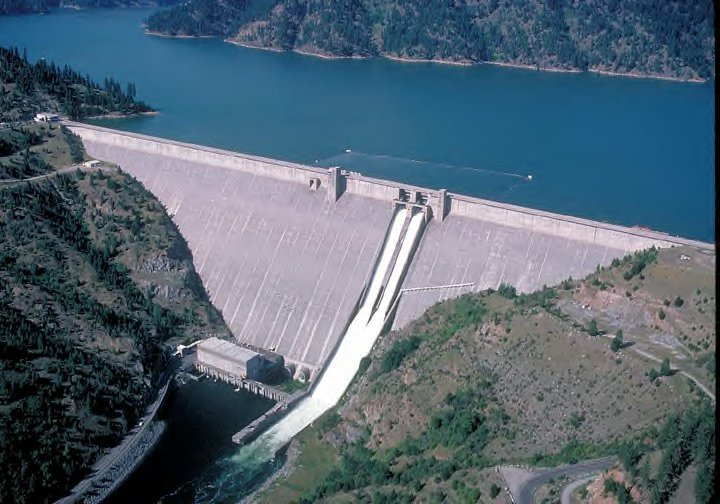
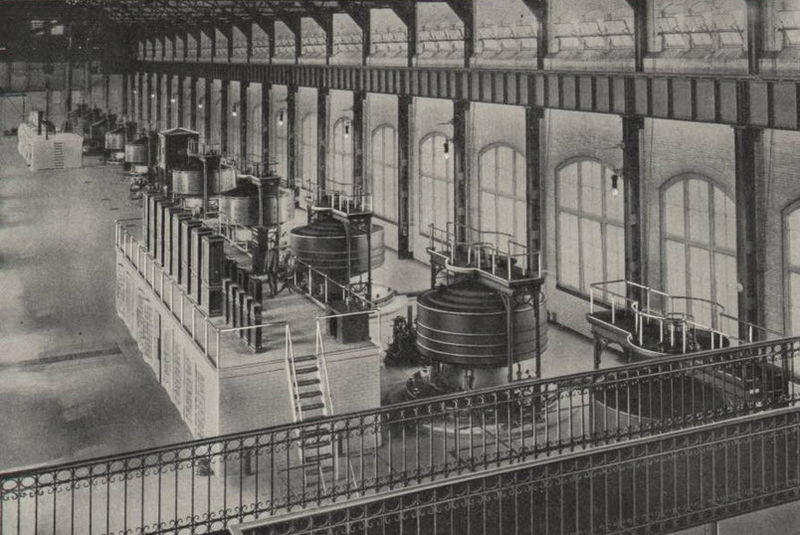
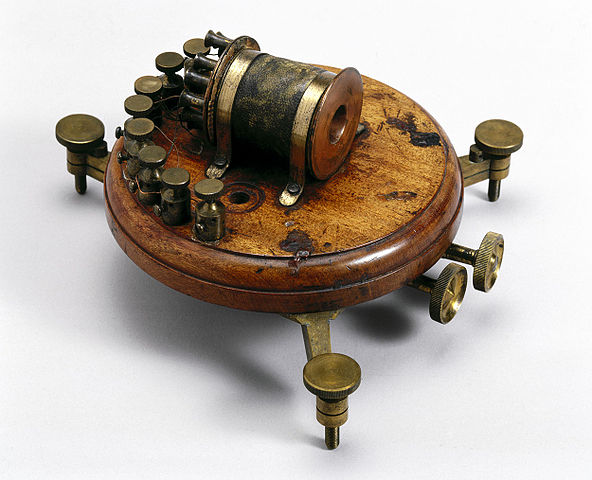
America was the first to harness large-scale hydroelectric power when Westinghouse and Tesla built a 37 MWatt plant at Niagara falls in 1895. They also solved the problem of long-distance transfer of electricity, inventing the alternating current method.
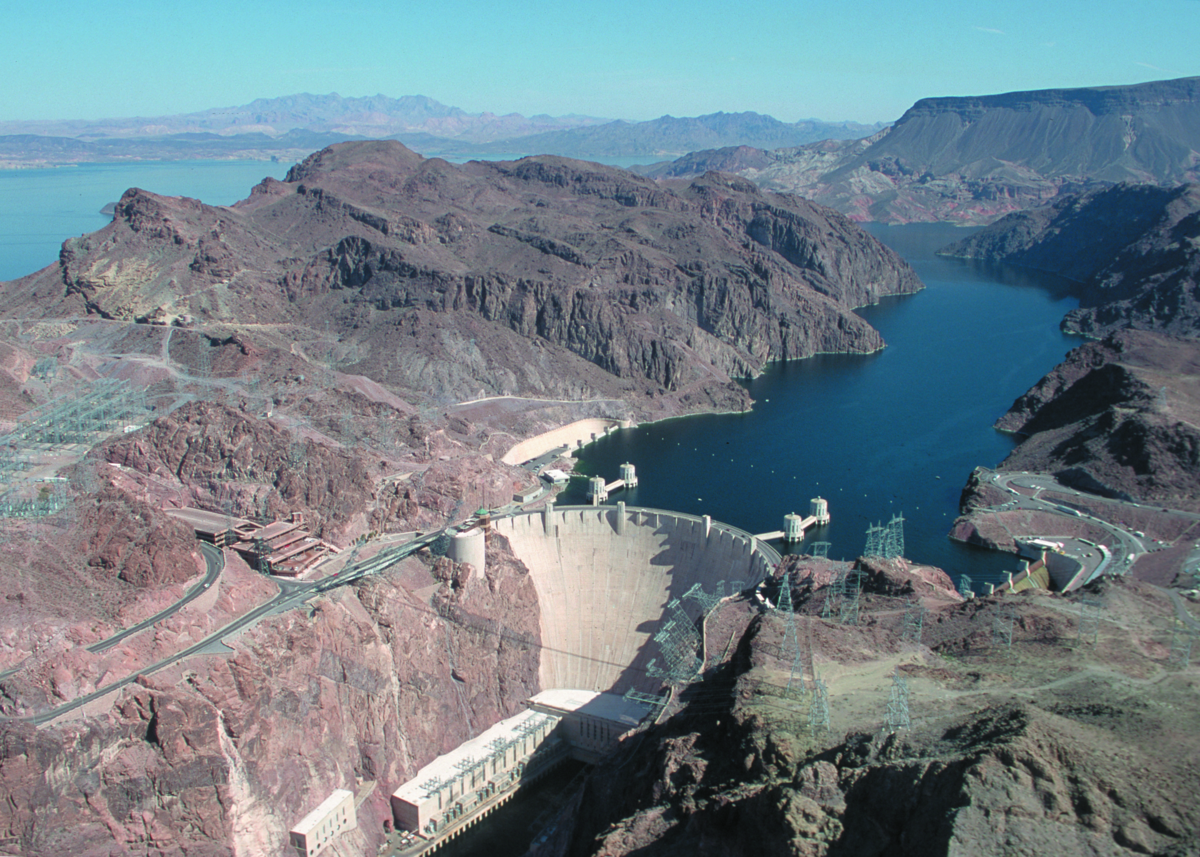
By 1930 America had built 10 dams with a height of at least 90 meters.
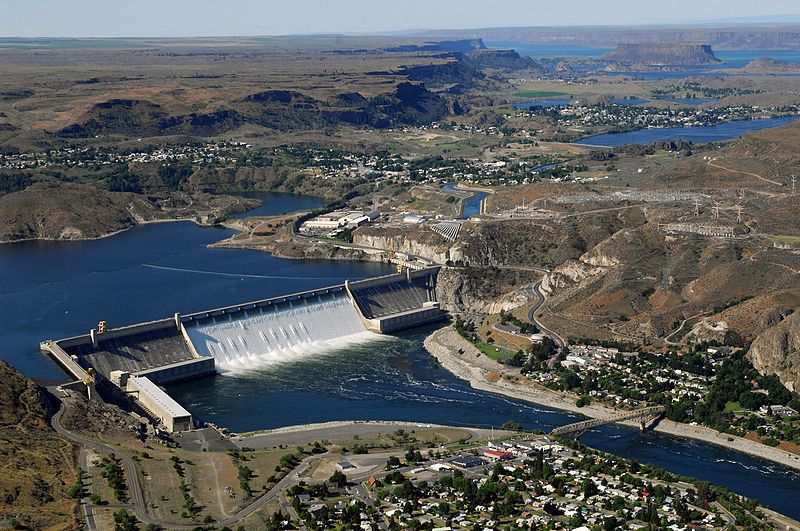
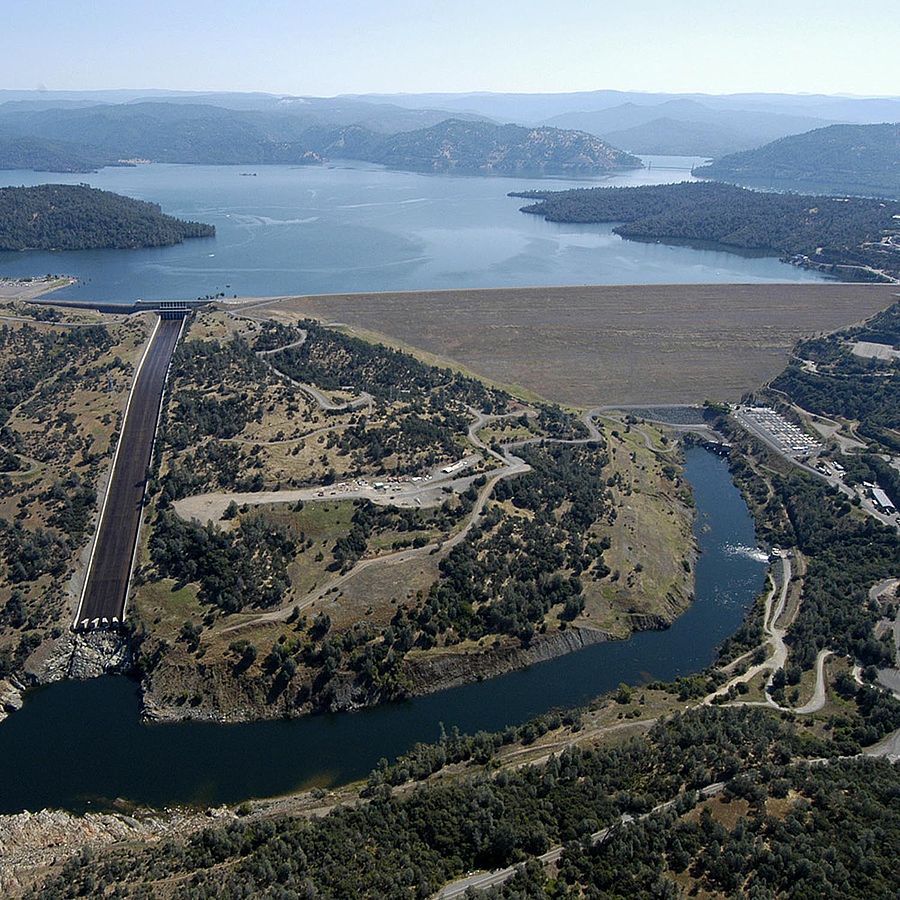
In 1945 America had the three highest dams in the world, the Hoover Dam, the Shasta Dam, and the Grand Couleee Dam.
              Height    Year     Power
               (m)    completed  (MW)

Niagara Adams           1895      37
Buffalo Bill    110     1910
Roosevelt       109     1911
Arrowrock       110     1915
Elephant Butte   92     1916
O'Shaughnessy   130     1923
Gorge            91     1924
Horse Mesa       93     1927      15
Canyon          109     1927      18
Pacoima         111     1929
Diablo          119     1930
Owyhee          127     1932
Hoover          221     1936     480
Grand Coulee    170     1942
Shasta          184     1945
Oroville Dam    187     1968     170
New Bullards    197     1969     150
Dworshak Dam    219     1973
 |
 |
|---|---|
 |
 |
|
|---|---|---|
Tesla and Westinghouse built the first large-scale hydro-powered electricity plant at Niagara falls in 1895. It generated 37 megawatts of power and turbocharged American manufacturing.
 |
 |
|---|---|
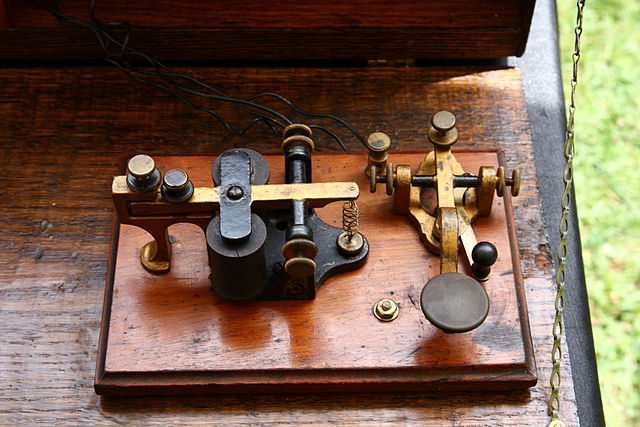
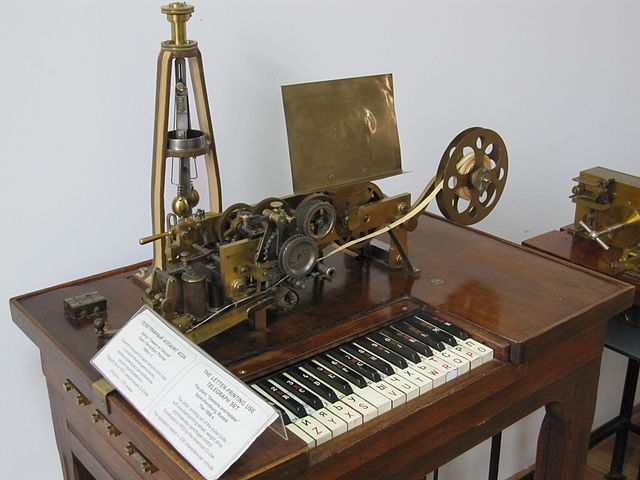
Telegraph km in 1852.
USA       37000
UK         2500
Prussia    2300
Austria    1600
Canada     1400
France     1100
 |
 |
|---|---|
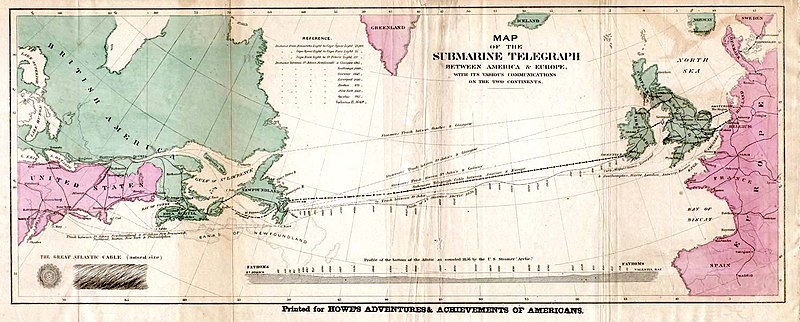
The first successful transatlantic cable linking America and the UK was completed in 1866. It was made possible by William Thompson's invention of the mirror galvanometer in 1857, for detecting telegraph signals.
The transcontinental railway was started in 1863 and completed in 1869, opening up the West to rail transport.
In 1828, rail crossed the Appalachian mountains.
By 1860 The North and Midwest constructed networks that linked every city. In the heavily settled Midwestern Corn Belt, over 80 percent of farms were within 8 km of a railway. The USA had 28900 railroad miles and the UK had 10400.
 |
 |
|---|---|
The first naval battle involving iron ships was in the civil war in 1862, between the North's Merrimac and the South's Virginia.
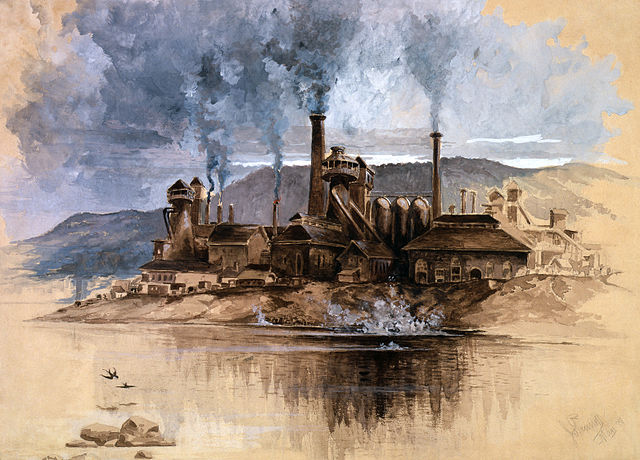
Steel production in 1913 in billion kg.
USA      31.5
Germany  19.3
UK       10.4
 |
 |
|---|---|
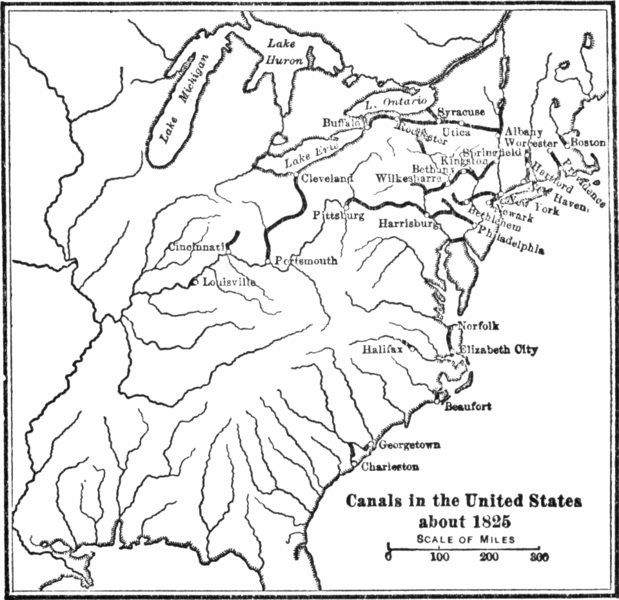
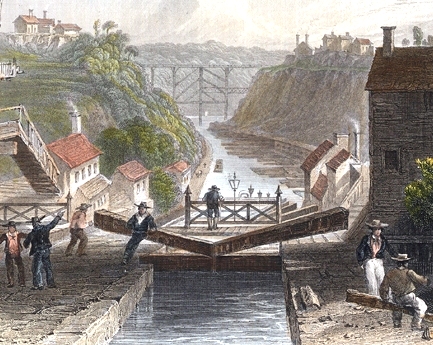
The Erie Canal, completed in 1825, was the second longest canal in the world.
 |
 |
 |
|---|---|---|
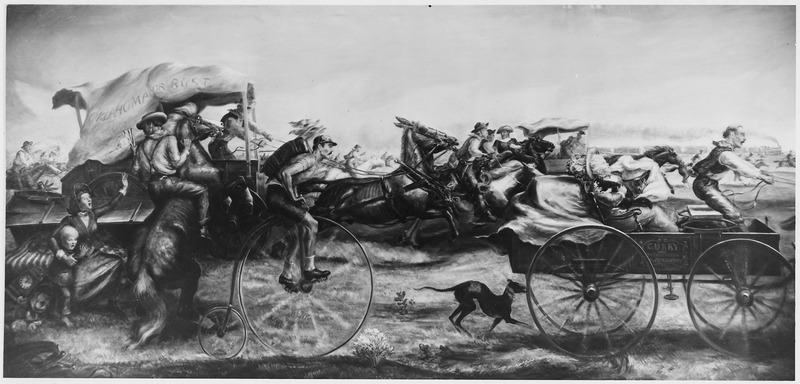
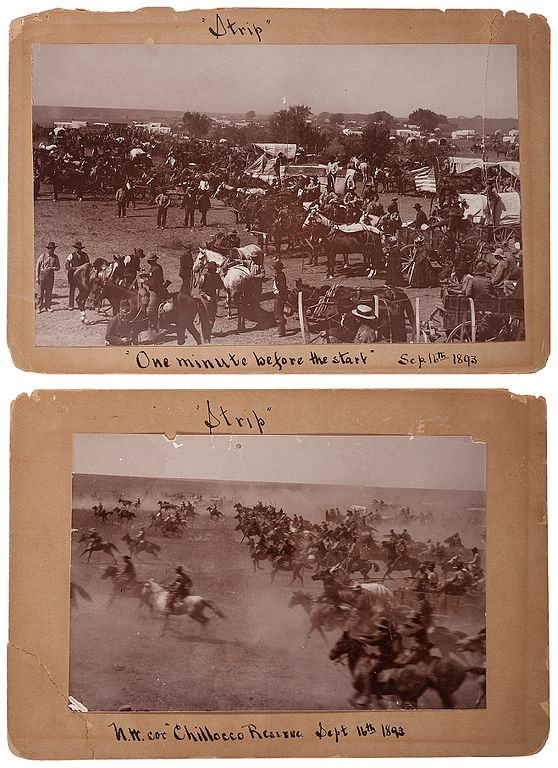
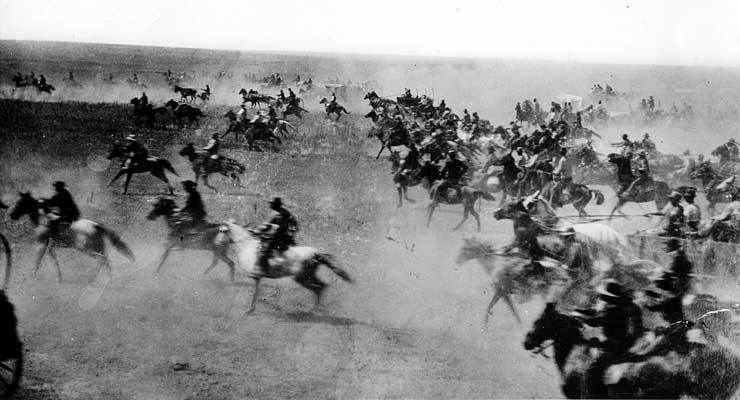
       People   km2   Acres/homestead

1889   50000    8100       40
1991   20000              160
1992           14000
1993   40000   24240      160
 |
 |
 |
 |
 |
 |
 |
 |
|---|---|---|---|---|---|---|---|
 |
 |
 |
 |
|---|---|---|---|
 |
 |
 |
|
 |
|---|---|---|---|---|
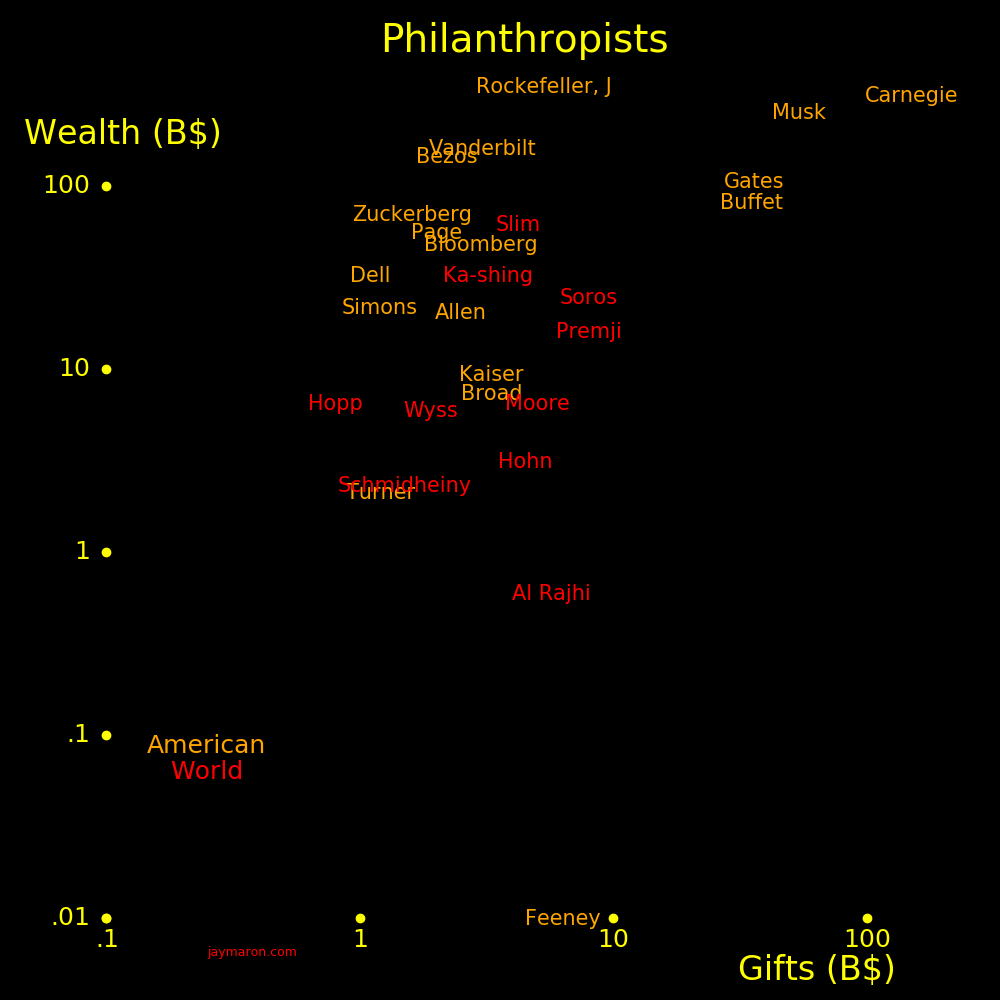
Who got the most bang for the buck?
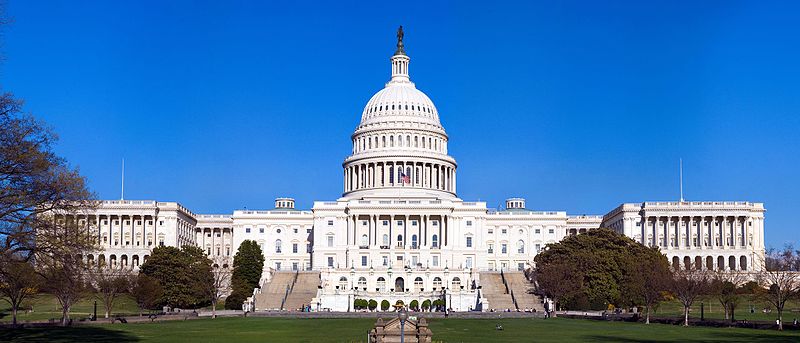
Asimov sponsors the "Asimov Debates" at the American Museum of Natural History, and they draw a crowd of thousands. The debates cover exotic topics in science.
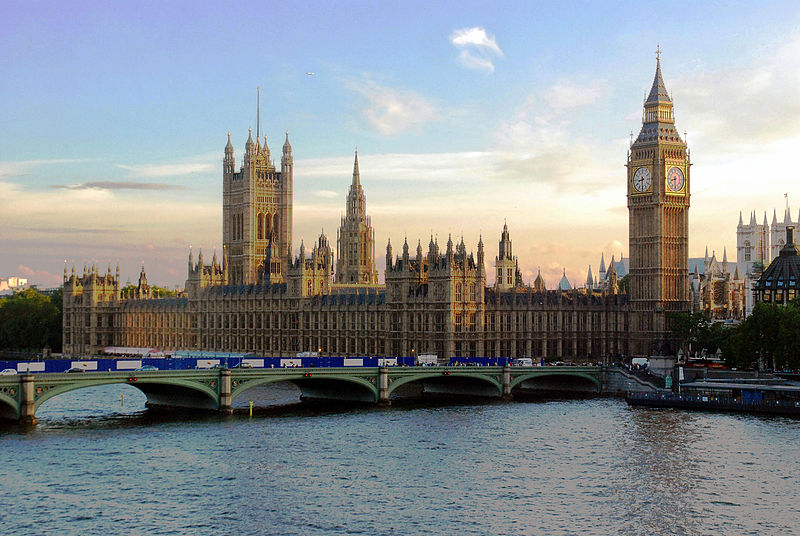
The Queen of England and 007 have a symbiotic relationship. The Queen has the money and 007 can get stuff done. It's a credit to the Queen that she bigly bankrolls 007. It's also a credit to the queen that 007 works for her. 007 doesn't work for just anyone.
Political offices are often purchased, and the money tends to go to oligarchs instead of the worthy. For example, money tends to flow to media executives. Senator Herb Kohl of Wisconsin set an example by donating lavishly to the University of Wisconsin and was rewarded with a senate seat.
The average spending required to win political office is:
               Winner      U.S. Total
              Million $    Million $

U.S. President   1200        2400
U.S. Senate        25        2500
U.S. House          2        2000
State Governor     10        1000
State Senate         .2       400
State House          .08      700
This tells you how much to demand for each office.
 |
|---|
For a philanthropist, we can ask: What fraction of your wealth did you give away? as well as the worthiness of the recipients. In the era before the French Revolution, the French aristocracy was arrogant, much like the modern Democratic party. It bit them in the ass.
The French aristocracy had an opportunity. They were rich and they could have spent their money wisely, in a way that gains goodwill from the people. They could have spent their money on a batsuit and a batmobile, and they didn't. Lame!
A modern billionaire could use his money to build an Iron Man suit and be a superhero.
What should billionaires spend money on? Think there might be a conspiracy? The oligarchy is bourgeouis with their 1700 private jets at Davos. There is an epidemic of bourgeois, including the oligarchy, Taxing the rich doesn't work. They're good at hiding money. Instead coax them to spend money on your community. Treat them like celebrities if they do. Billionaire shaming. There are good billionaires and bad billionaires. Good billionaires turbocharge communities and bad billionaires poison them. A community should coax good billionaires to move in and be villigant in excluding bad billionaires. A wise billionaire could use his money to become a celebrity and be beloved by the community.
|
|---|
Prince Ranier of Monaco chose a hollywood wife, and he chose wisely. Prince Harry chose poorly.
The French Aristocracy of the 18th century was arrogant and it cost them their heads.
The British Monarchy gracefully instituted a smooth transition to democracy, and they got to keep their heads.
The American aristocracy of the 21st century is arrogant.
Robespierre created a world of guillotines, and Robespierre got guillotined.
George Carlin: The oligarchs own this place. It's a big club, and you aren't in it.
 |
 |
|---|---|
 |
 |
 |
|---|---|---|
Academic competitions
A measure of the quality of a rich person is the quality of the jobs he produces. Elon Musk creates great engineering jobs whereas the Waltons and Wal Mart create low-end jobs.
Dog park
Car
Wine
Yacht
Tax breaks can be given for worthy causes, for examle a science megaproject. Some examples might be:
Higgs factory collider, a circular electron collider
Electron linear collider
Telescopoe for asteroid fining
Radio telescopes and the search for intelligent life
Gravitational wave observatory
|
|---|
The wealthy tend to migrate in the direction of low tax, and this is happening in the United States.
Billionaires are a good thing to have around.
California   165      Michigan     10    Missouri    6
New York     118      Pennsylvania 10    Virginia    5
Texas         56      Colorado     10
Florida       58      Tennessee    10
Massachusetts 17      Wyoming       9
Illinois      17      Wisconsin     9
Connecticut   17      Arizona       9
Georgia       13      New Jersey    8
Washington    12      Maryland      8
Nevada        11      Ohio          6
Billionaires tend to cluster in cities.
New York City   98    Palm Beach      10    Oklahoma City    3
San Francisco   41    Boston          10    Racine           3
Los Angeles     27    Seattle          8    Omaha            3
Dallas          17    Las Vegas        7    Cleveland        3
Atlanta         13    Phoenix          6    Potomac MD       3
Houston         12    Naples           5    Brookline, MA    3
Greenwich       11    Jackson          4    Cary, NC         3
Chicago         11    Denver           4    Philadelphia     3
|
|---|
                 Billion $

Jeff Bezos          131       Amazon
Bill Gates           96       Microsoft
Warren Buffett       83       Berkshire Hathaway
Larry Ellison        62       Oracle
Mark Zuckerberg      62       Facebook
Larry Page           60       Alphabet
Charles Koch         50       Koch Industries
David Koch           50       Koch Industries
Sergey Brin          50       Alphabet
Michael Bloomberg    49       Bloomberg LP
Jim Walton           45       Walmart
S. Walton            44       Walmart
Alice Walton         44       Walmart
Steve Balmer         41       Microsoft, LA Clippers
Sheldon Adelson      35       Las Vegas Sands Corp
Rupert Murdoch      >10       Fox News
Michael Dell        >10       Dell
Elon Musk           >10       Tesla
Carl Icahn          >10
Charles Schwab      >10
George Lucas         >4
George Soros         >4
Steve Spielberg      >4
Gordon Moore         >4
Ross Perot           >4
Bob Kraft            >4
Tom Steyer
John Arnold
Donald Trump
Mark Cuban
 |
|---|
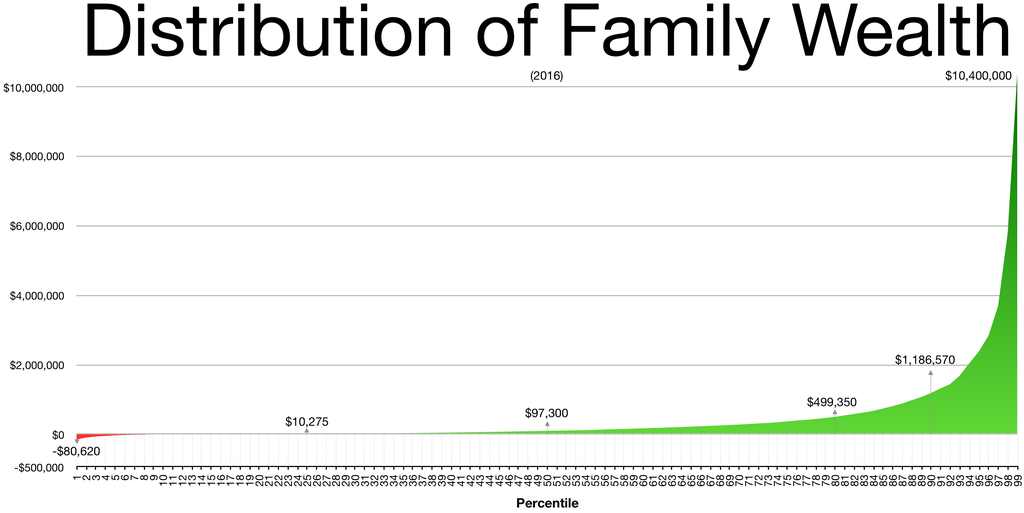
Percentile  Wealth   Fracion of total wealth
              M$

   1      10400000       .35
   2       7000000
   3       4500000
   4       2600000
   5       2200000       .62
  10       1187000       .73
  20        499000       .85
            Billion $

Apple          780
Alphabet       749
Microsoft      736
Amazon         728
Berkshire H.   450
Facebook       376
Johnson & J.   346
JPMorgan Chase 325
The sports industry has inertia that protects existing sports and inhibits new sports. Most sports have awkward rules and better sports are possible. The most glaring need is for a better tackle sport, because the rules for football and rugby are awkward.
Rules should be simple and elegant. Good examples include soccer, hockey, and tennis, and bad examples include football, rugby, baseball, and basketball.
Football has the negative that it requires many coaches.
A sport should accomodate a diversity of body types. Rugby has roles for everyone, regardless of size. Basketball overemphasizes height.
A sport should minimize equipment. Football and hockey require excessive equipment, whereas soccer requires only a ball.
For football, the XFL courageously experiments with the rules.
Rugby and soccer have too many players. Either the number of players can be reduced or the number of balls can be increased.
             Appointed by   Born  Begin   End

John Stevens      Ford      1920   1975   2010
Sandra O'Connor   Reagan    1930   1981   2006
William Rehnquist Reagan    1924   1986   2005
Antonin Scalia    Reagan    1936   1986   2016
Anthony Kennedy   Reagan    1936   1988   2018
Clarence Thomas   Bush I    1948   1991
Ruth Ginsburg     Clinton   1933   1993   2020
Stephen Breyer    Clinton   1938   1994
John Roberts      Bush II   1955   2005
Samuel Alito      Bush II   1950   2006
Sonia Sotomayor   Obama     1954   2009
Elena Kagan       Obama     1960   2010
Neil Gorsuch      Trump     1967   2017
Brett Kavanaugh   Trump     1965   2018
Amy Coney Barrett Trump     1972   2020
 |
|---|
              Hunters   Deaths

Michigan       800000     0
Pennsylvania   750000     1
New York       600000     0
Wisconsin      589830     0
West Virginia  250000     0
Maine          224039     0

Total         3213869     1
 |
|---|
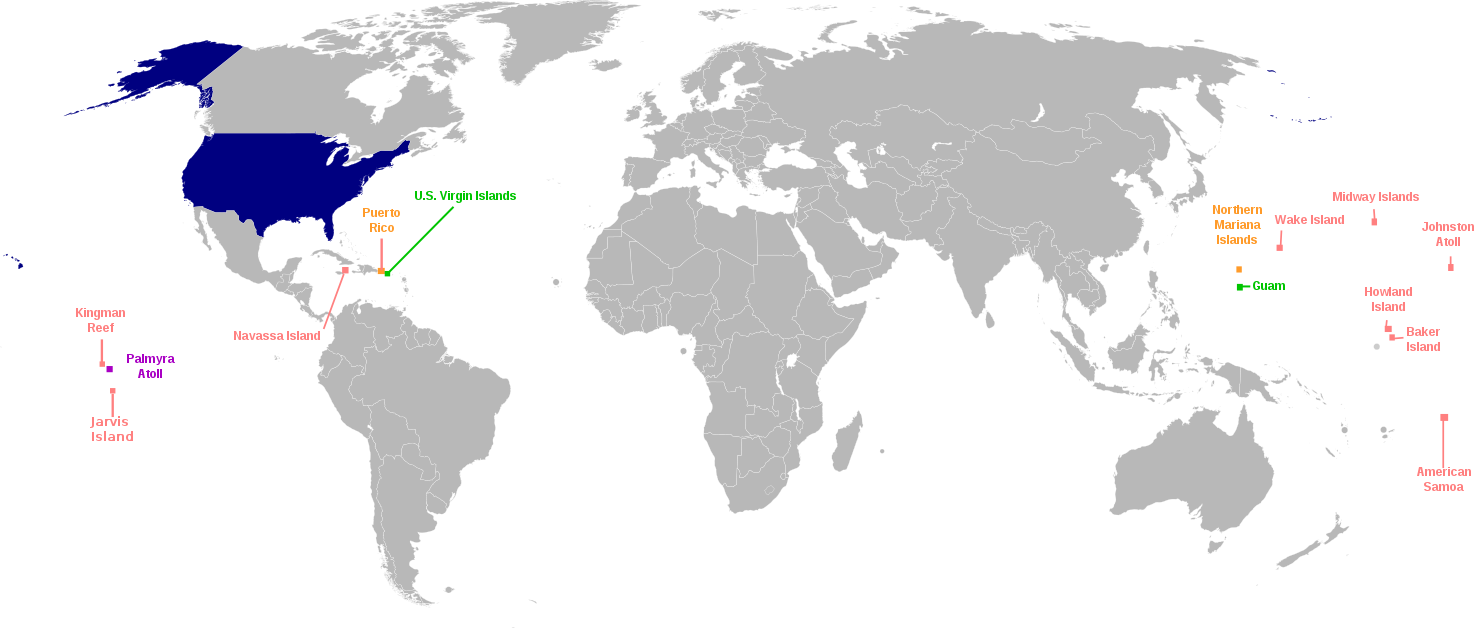
 |
 |
|---|---|
                   km2   Population

Puerto Rico       9104   3667084    Caribbean
Guam               543    159358    West Pacific
N. Mariana Is.     464     77000    West Pacific
US Virgin Is.      346    106405    Caribbean
American Samoa     197     55519    West Pacific
Guantanamo Bay     117         -    Caribbean
Misc Islands        34       300
Kingman Reef        18         0    East Pacific
Palmyra Atoll       12         0    East Pacific
Wake Island          7.4       0    West Pacific
Midway               6.2       0    West Pacific
Navassa Island       5.4       0    Caribbean
Howland Island       4.5       0    West Pacific
Jarvis Island        4.5       0    East Pacific
Johnston Atoll       4.5       0    West Pacific
Baker Island         2.1       0    West Pacific
 |
|---|
U.N. Budget              = 2.8  B$/year
U.N. Peacekeeping Budget = 8.27 B$/year
U.N. Peacekeeping troops = 82813

      U.N. Budget   U.N. Peacekeeping
          %             Budget %

USA       22.0            28.4
Japan      9.7            10.3
China      7.9             6.6
Germany    6.4             7.1
France     4.9             7.2
UK         4.46            6.7
Brazil     3.82
Italy      3.75            4.45
Russia     3.09            3.15
Canada     2.92            2.98
Spain      2.44            2.97
Australia  2.34
S. Korea   2.04
Neth.      1.48
Mexico     1.44
S. Arabia  1.15
Switz.     1.14
Other     19.1
 |
 |
 |
|---|---|---|
 |
|---|
 |
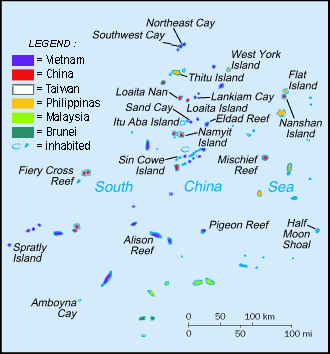 |
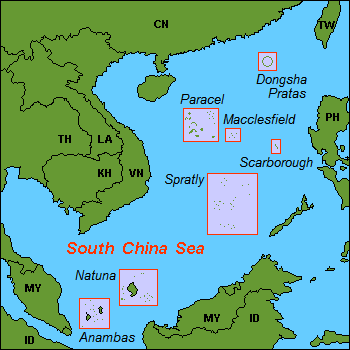
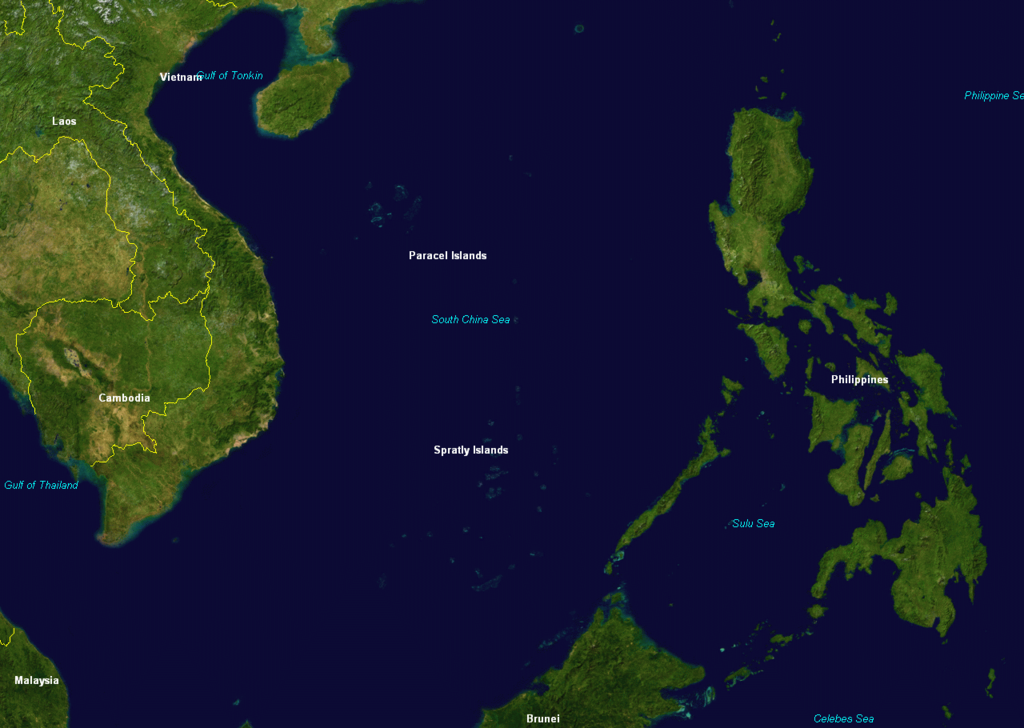
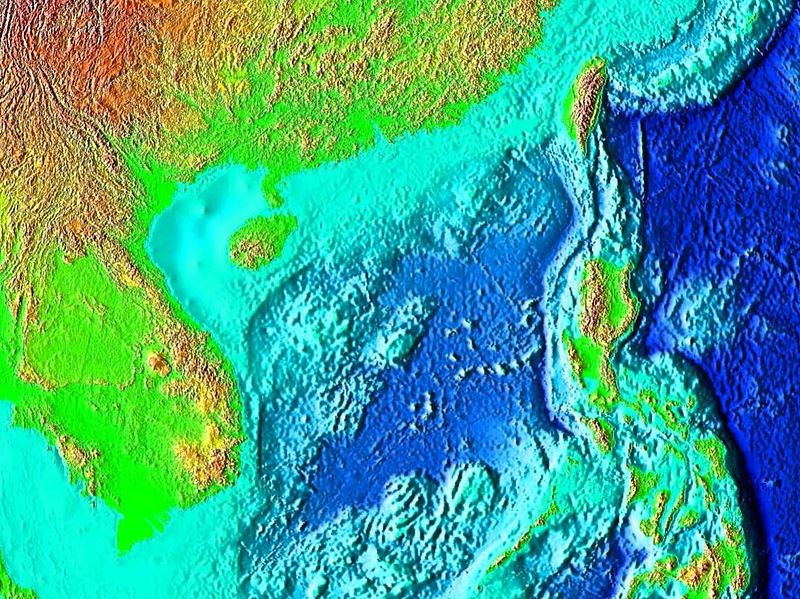
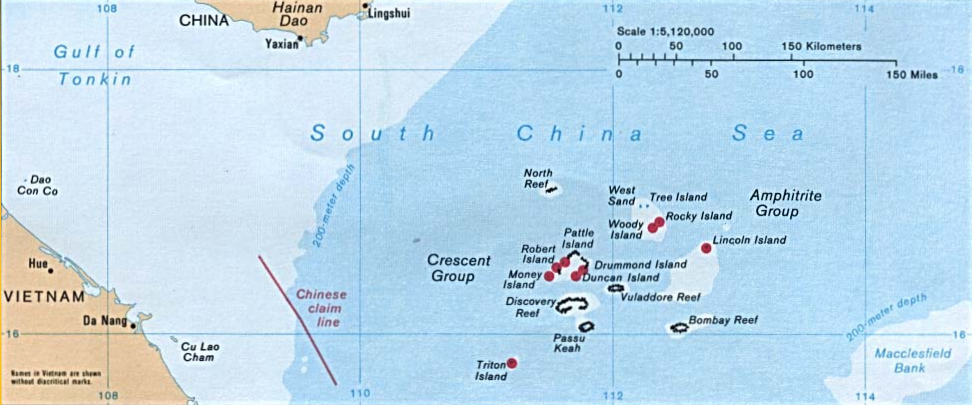
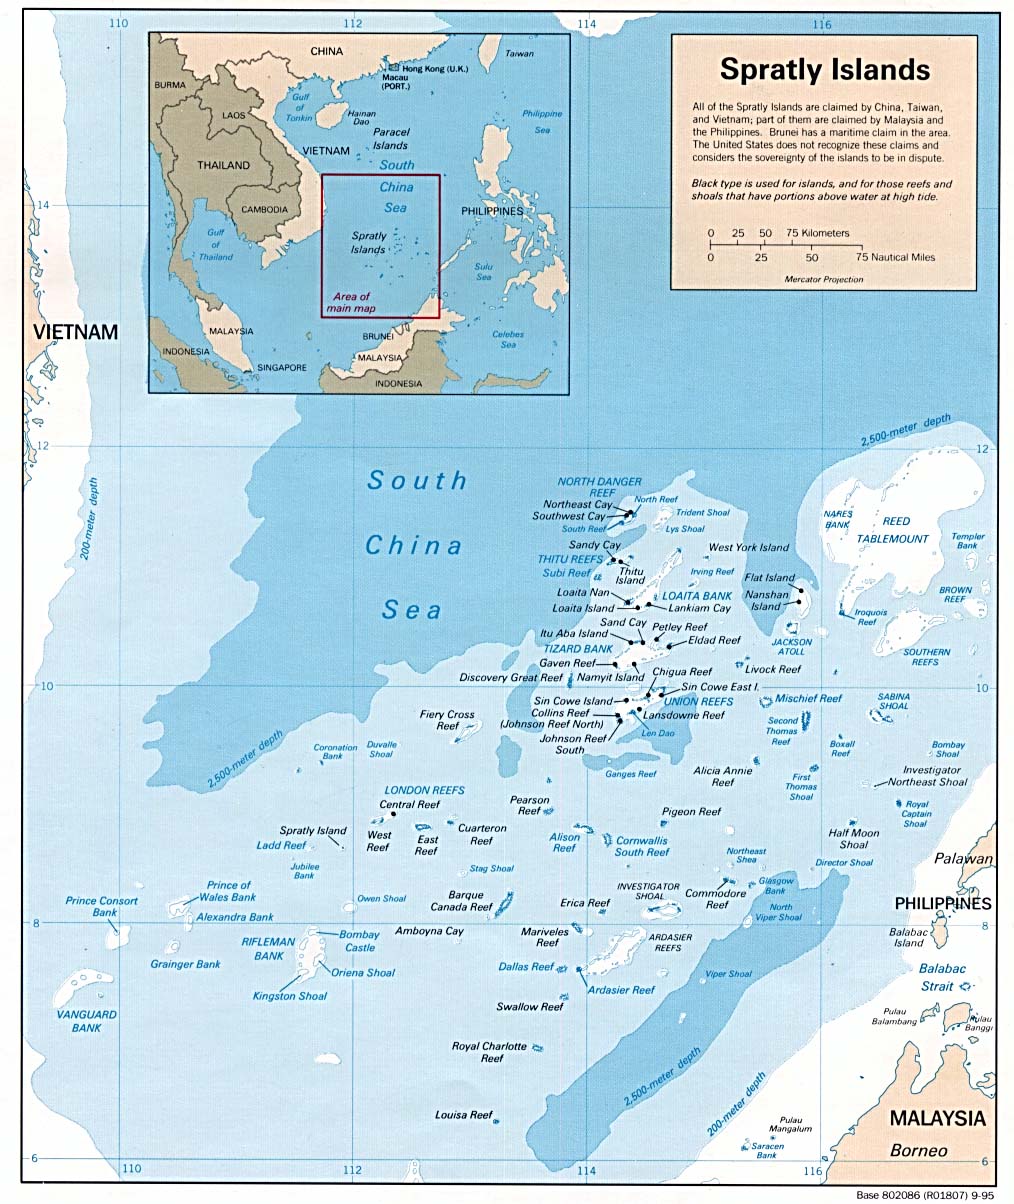
|---|---|
                          km2   Population  Nearest     Occupied
                                            nation         by

Pratas Is.                   1.7       0    China       Taiwan
Batanes Arc.               219     17246    Philippines Philippines
Taiwan Str. Amoy          1699   3531000    China       China
Tiawan Str. Quemoy         153    127723    China       Taiwan
Taiwan Str. Pescadores     141    101758    Taiwan      Taiwan
Paracel     Woody Is.        2.1            China/Viet  China
Paracel     Lincoln Is.      1.6            China/Viet  China
Paracel     Triton Is.       1.2            China/Viet  China
Paracel     Duncan Is.        .48           China/Viet  China
Paracel     Passu Keh         .40           China/Viet  China
Paracel     Money Is.         .36           China/Viet  China
Paracel     Pattle Is.        .31           China/Viet  China
Paracel     Robert Is.        .30           China/Viet  China
Paracel     Tree Is.          .22           China/Viet  China
Paracel     Drummond Is.      .21           China/Viet  China
Paracel     South Is.         .17           China/Viet  China
Paracel     Middle Is.        .13           China/Viet  China
Paracel     Rocky Is.         .08           China/Viet  China
Paracel     South Sand        .06           China/Viet  China
Paracel     Palm Is.          .06           China/Viet  China
Paracel     Middle Sand       .05           China/Viet  China
Paracel     West Sand         .04           China/Viet  China
Paracel     North Is.         .04           China/Viet  China
Paracel     Pyramid Rock      .04           China/Viet  China
Paracel     North Sand        .02           China/Viet  China
Paracel     All Wealth        .02           China/Viet  China
Paracel     Little Basket     .01           China/Viet  China
Paracel     Observation Bank  .01           China/Viet  China
Paracel     He Duck           .01           China/Viet  China
Paracel     S. South Sand     .004          China/Viet  China
Paracel     New West Sand     .002          China/Viet  China
Paracel     Lesser Silver Is. .002          China/Viet  China
Paracel     Stone Islet       .002          China/Viet  China
Spratley    Itu Aba Is.       .46           Phil/Malay  Taiwan
Spratley    Thitu Is.         .37           Phil/Malay  Philippines
Spratley    West York Is.     .18           Phil/Malay  Philippines
Spratley    Spratley Is.      .13           Phil/Malay  Vietnam
Spratley    Northeast Cay     .13           Phil/Malay  Philippines
Spratley    Southwest Cay     .12           Phil/Malay  Vietnam
Spratley    Sin Cowe Is.      .08           Phil/Malay  Vietnam
Spratley    Nanshan Is.       .08           Phil/Malay  Philippines
Spratley    Sand Cay          .07           Phil/Malay  Vietnam
Spratley    Loaita Is.        .06           Phil/Malay  Philippines
Spratley    Namyit Is.        .05           Phil/Malay  Vietnam
Spratley    Amboyna Cay       .02           Phil/Malay  Vietnam
Spratley    Flat Is.          .01           Phil/Malay  Philippines
Spratley    Lankiam Cay       .004          Phil/Malay  Philippines
Senkaku     Uotsuri-shima    4.32           Japan       Japan
Senkaku     Kuba-shima       1.08           Japan       Japan
Senkaku     Minami-kojima     .46           Japan       Japan
Senkaku     Kita-kojima       .33           Japan       Japan
Senkaku     Taishoo-too       .06           Japan       Japan
Senkaku     Oki-no-Kita-iwa   .02           Japan       Japan
Senkaku     Oki-no-Minami-iwa .005          Japan       Japan
Senkaku     Tobise            .001          Japan       Japan
Natuna Arc.               1993     69319
Anambas Gp.                637     37493    Malaysia    Indonesia
               Year   Homicides per
                      million per year

Saint Louis    1949    499
Detroit        1962    435
New Orleans    1872    387
Baltimore      1967    338
Chicago        1931    151
Milwauke       1908    150
New York City  2007     39
San Diego      2016     23
Data for 2014
 |
|---|
 |
|---|
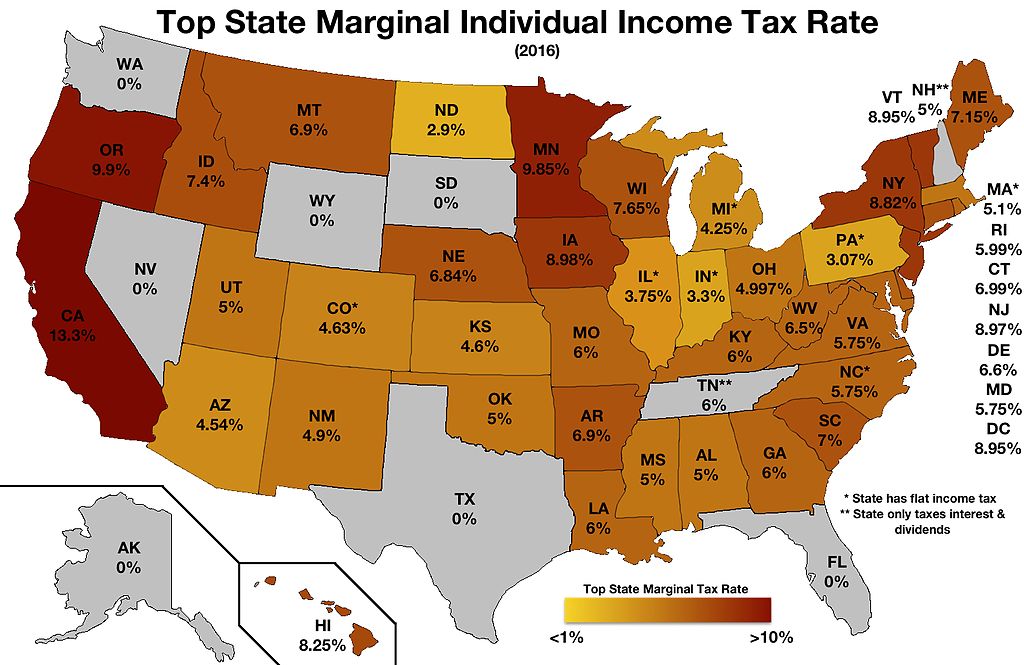
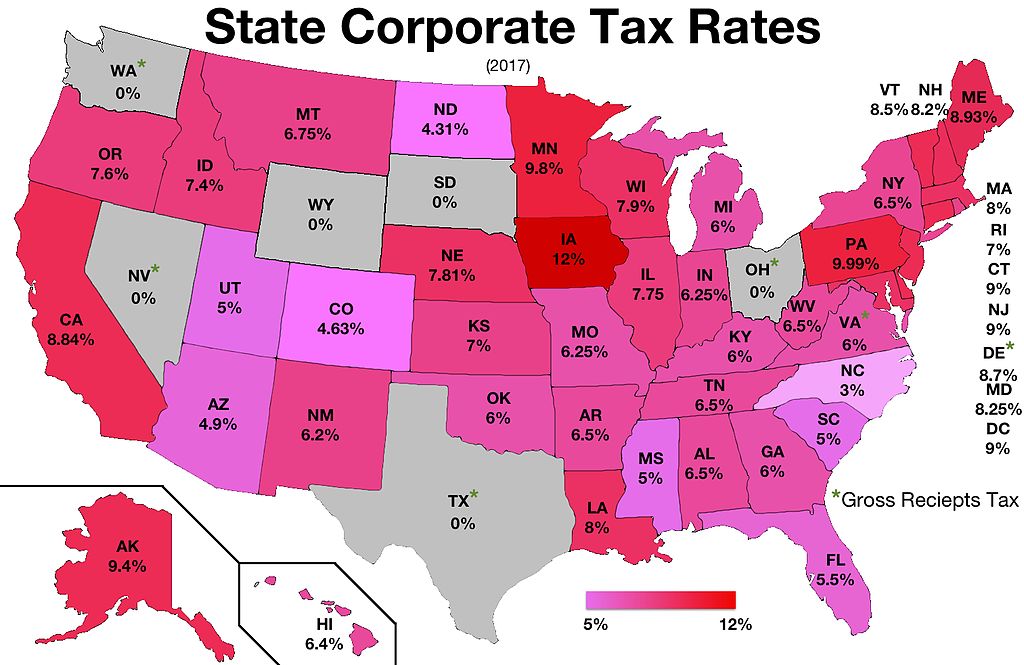
Tax rate for the top bracket in percents.
         Individual  Corporate                  Individual  Corporate
               %        %                            %        %
California     13.3   8.8   D         Virginia        5.8   6.0   D
Oregon          9.9   7.6   D         Maryland        5.8   8.2   D
Minnesota       9.8   9.8   D         Massachusetts   5.1   8.0   D
DC              9.0   9.0   D         Utah            5.0   5.0   R
New Jersey      9.0   9.0   D         Oklahoma        5.0   6.0   R
Vermont         9.0   8.5   D         Mississippi     5.0   5.0   R
Iowa            9.0  12.0   R         Alabama         5.0   6.5   R
New York        8.9   5.6   D         Ohio            5.0   0.0   R
Hawaii          8.2   6.4   D         New Hampshire   5.0   8.2   D
Wisconsin       7.6   7.9   R         New Mexico      4.9   6.2   D
Idaho           7.4   7.4   R         Colorado        4.6   4.6   D
Maine           7.2   8.3   D         Kansas          4.6   7.0   R
Connecticut     7.0   9.0   D         Arizona         4.5   4.9   R
South Carolina  7.0   5.0   R         Michigan        4.2   6.0   R
Arkansas        6.9   6.5   R         Illinois        3.8   7.8   D
Montana         6.9   6.8   R         Indiana         3.3   6.2   R
Nebraska        6.8   7.8   R         Pennsylvania    3.1  10.0   R
Delaware        6.6   8.7   D         North Dakota    2.9   4.3   R
West Virginia   6.5   6.5   R         Wyoming         0     0     R
Missouri        6.0   6.2   R         South Dakota    0     0     R
Tennessee       6.0   6.5   R         Florida         0     5.5   R
Georgia         6.0   6.0   R         Nevada          0     0     D
Louisiana       6.0   8.0   R         Texas           0     0     R
Kentucky        6.0   6.0   R         Alaska          0     9.4   R
Rhode Island    6.0   7.0   D         Washington      0     0     D
North Carolina  5.8   3.0   R
Most of the states with large debt are Democratic and most of the states with low debt are Republican.
Numbers in thousands of dollars per person. The national average is 3.72.
Massachusetts 11.34  D       South Dakota   4.00  R       Oklahoma       2.41  R
Connecticut    9.30  D       Wisconsin      3.93  R       Mississippi    2.39  R
Rhode Island   8.92  D       Oregon         3.81  D       Kansas         2.36  R
Alaska         8.52  R       Pennsylvania   3.75  R       Idaho          2.30  R
New Jersey     7.52  D       Virginia       3.47  D       Arizona        2.24  R
New York       7.04  D       Montana        3.44  R       Iowa           2.08  R
Hawaii         6.19  D       Kentucky       3.42  R       Florida        1.93  R
New Hampshire  6.15  D       Colorado       3.37  D       North Carolina 1.87  R
Delaware       5.96  D       New Mexico     3.34  D       Alabama        1.86  R
Vermont        5.26  D       South Carolina 3.26  R       Texas          1.66  R
Illinois       5.13  D       Indiana        3.26  R       Wyoming        1.65  R
Washington     4.67  D       Michigan       3.19  R       Arkansas       1.55  R
Maryland       4.57  D       Missouri       3.18  R       Georgia        1.38  R
West Virginia  4.31  R       Minnesota      2.98  D       Nevada         1.30  D
California     4.21  D       Ohio           2.92  R       Nebraska       1.05  R
Louisiana      4.19  R       North Dakota   2.81  R       Tennessee       .95  R
Maine          4.12  D       Utah           2.65  R
Total state debt = 1149 billion.
Newscorp    Fox, WSJ, National Geographic
Viacom      CBS, MTV, VH1, BET
Disney      ABC, ESPN, Marvel, Pixar, Lucasfilm
AOL+TW      CNN, HBO, WB, TBS, TNT, the CW, Huffington Post
Comcast     NBC, MSNBC, Universal Pictures, Telemundo
Independent: New York Times, Breitbart.
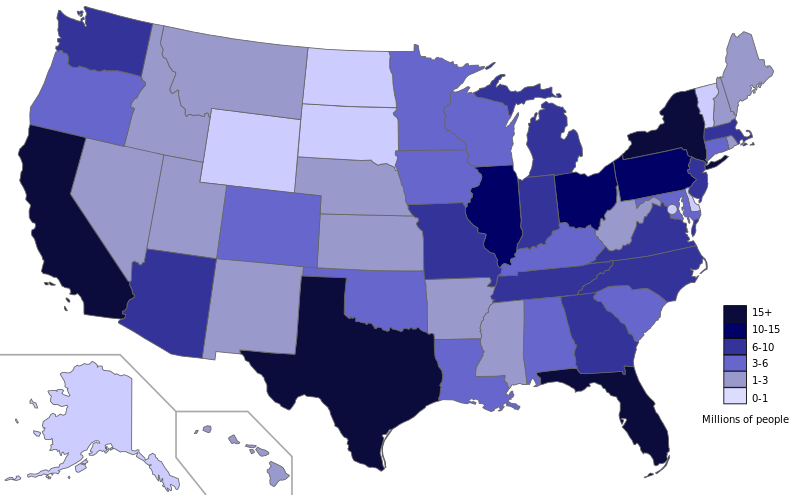
Numbers in millions. Data for 2006.
All states        11.56
California         2.93   D
Texas              1.64   R
Florida             .98   R
Illinois            .55   D
New York            .54   D
Arizona             .50   R
Georgia             .46   R
New Jersey          .43   D
North Carolina      .37   R
Washington          .28   D
Other states       2.95

Republican states  4.43
Democratic states  6.21
 |
|---|
Oil production and reserves in billions of barrels (Bb).
             Produce  Reserves
             Bb/year    Bb

Texas       R  1.2    10.5
N. Dakota   R   .40    5.7
Alaska      R   .18    2.9
California  D   .20    2.9
New Mexico  D   .12    1.2
Oklahoma    R   .12    1.0
Colorado    D   .10     .9
Wyoming     R   .08     .7
Utah        R   .04     .6
Louisiana   R   .07     .5

Red states     2.09   21.9
Blue states     .42    5.0
Data
Numbers in trillions of cubic feet.
          Produce  Reserves

Texas        26    85.3  R
Penn.        18    56.5  R
Oklahoma      9    30.7  R
W. Virginia   4.6  21.8  R
Wyoming       6    21.0  R
Colorado      5.9  18.3  D
Louisiana     6    16.3  R
N. Mexico     4.3  15.4  D
Ohio           -   12.9  R
Arkansas      3.7   8.3  R
N. Dakota      -    7.3  R
Alaska        1.2   4.6  R
Utah          -     3.7  R
Kansas        -     3.4  R
Virginia      -     2.5  D
Alabama       -     2.3  R
Michigan      -     1.4  R
California    -     1.9  D
Kentucky      -     1.5  R
Montana       -      .7  R
Mississippi   -      .5  R
New York      -      .1  D
Fed Pacific   -      .2  -
Fed Gulf      4     7.4  -

Red states        276
Blue states        37
Federal             7.6
Total             324
Data,
Data,
Data,
Data
Units of millions of short tons
          Produce  Reserves

Wyoming     396   6682   R
Illinois     58   2435   D
W. Virginia 112   1667   R
Penn         61   1296   R
N. Dakota    29    974   R
Kentucky     77    837   R
Montana      45    817   R
Mississippi   4    694   R
Texas        44    633   R
Indiana      39    627   R
Colorado     24    298   D
Ohio         22    245   R
Alabama      16    228   R
Arizona       8    209   R
Virginia     15    195   D
N. Mexico    22    167   D
Utah         18    128   R
Louisiana     3     89   R
Alaska        2     51   R
Arkansas      0     25   R
Maryland      2     18   D
Oklahoma      1      8   R

Red states  877  15214
Blue states 121   3113
Total            18327
Data, Data
              B$/year

Coal           31.3
Crushed rock   13.8
Sand & gravel  15.5
Cement          9.8
Copper          7.6
Gold            7.6
Iron            3.8
Data
 |
|---|
 |
 |
 |
 |
 |
|---|---|---|---|---|
                   Republican   Democrat    Democrat   RFK Jr   Williamson   Gabbard
                               mainstream   radical
Energy & climate
  Nuclear              Yes         No          No        Mixed
  Gasoline             Yes *       No          No        Capitalist
  Natural gas          Yes *       No          No        Capitalist
  Coal                 Yes         No          No        Capitalist
  Total energy         Maximize    Minimize    Minimize
  Green New Deal       No  *       Yes         Yes       Yes      Yes
  Geoengineering       No          No          No        No
  Farmer               Yes *       No          No        Yes
Rights
  Free speech          Yes *       No          No        Yes                 Yes
  2nd Amendment        Yes *       No          No        Yes      No         Yes
DOJ
  Prosecute Bidens     Yes *       No          No        Yes
  Apolitical           Yes *       No          No        Yes
Supreme Court
  Constitutionalist    Yes *       No          No
  Pack the court       No  *       Yes         Yes
Education
  Choice               Yes *       No          No
  Child grooming       No  *       Yes         Yes
  SAT                  Yes         No          No
  Free college         No  *       Yes         Yes                           Yes
  College debt forgiv  No  *       Yes         Yes
  Affirmative action   No  *       Yes         Yes       Yes
  Federal education    Defund      Fund        Fund
Corporate oligarchy    No          Yes         No        No                  No
Social issues
  Abortion             States      Federal     Federal
  Trans in women's sports  No      Yes         Yes
  Cannabis             No          Yes         Yes
  Race reparations     No *        Yes         Yes       Yes        Yes
  Veterans             Support     Oppose      Oppose
  Police               Support     Oppose      Oppose
Foreign policy
  China                Oppose  *   Obey        Obey
  Israel               Support *   Oppose      Oppose    Support    Oppose   Support
  Border               Defend  *   Open        Open      Defend              Defend
  Immigration          Limit   *   Open        Open      Open                Open
Covid
  Lockdown             No          Yes         Yes       No
  Vaccine              No          Yes         Yes       No
Issues denoted by a "*" are especially vital to Republicans.