

|
|
|
|
|
|
|---|---|---|---|---|---|
| 
|
|
|---|---|---|
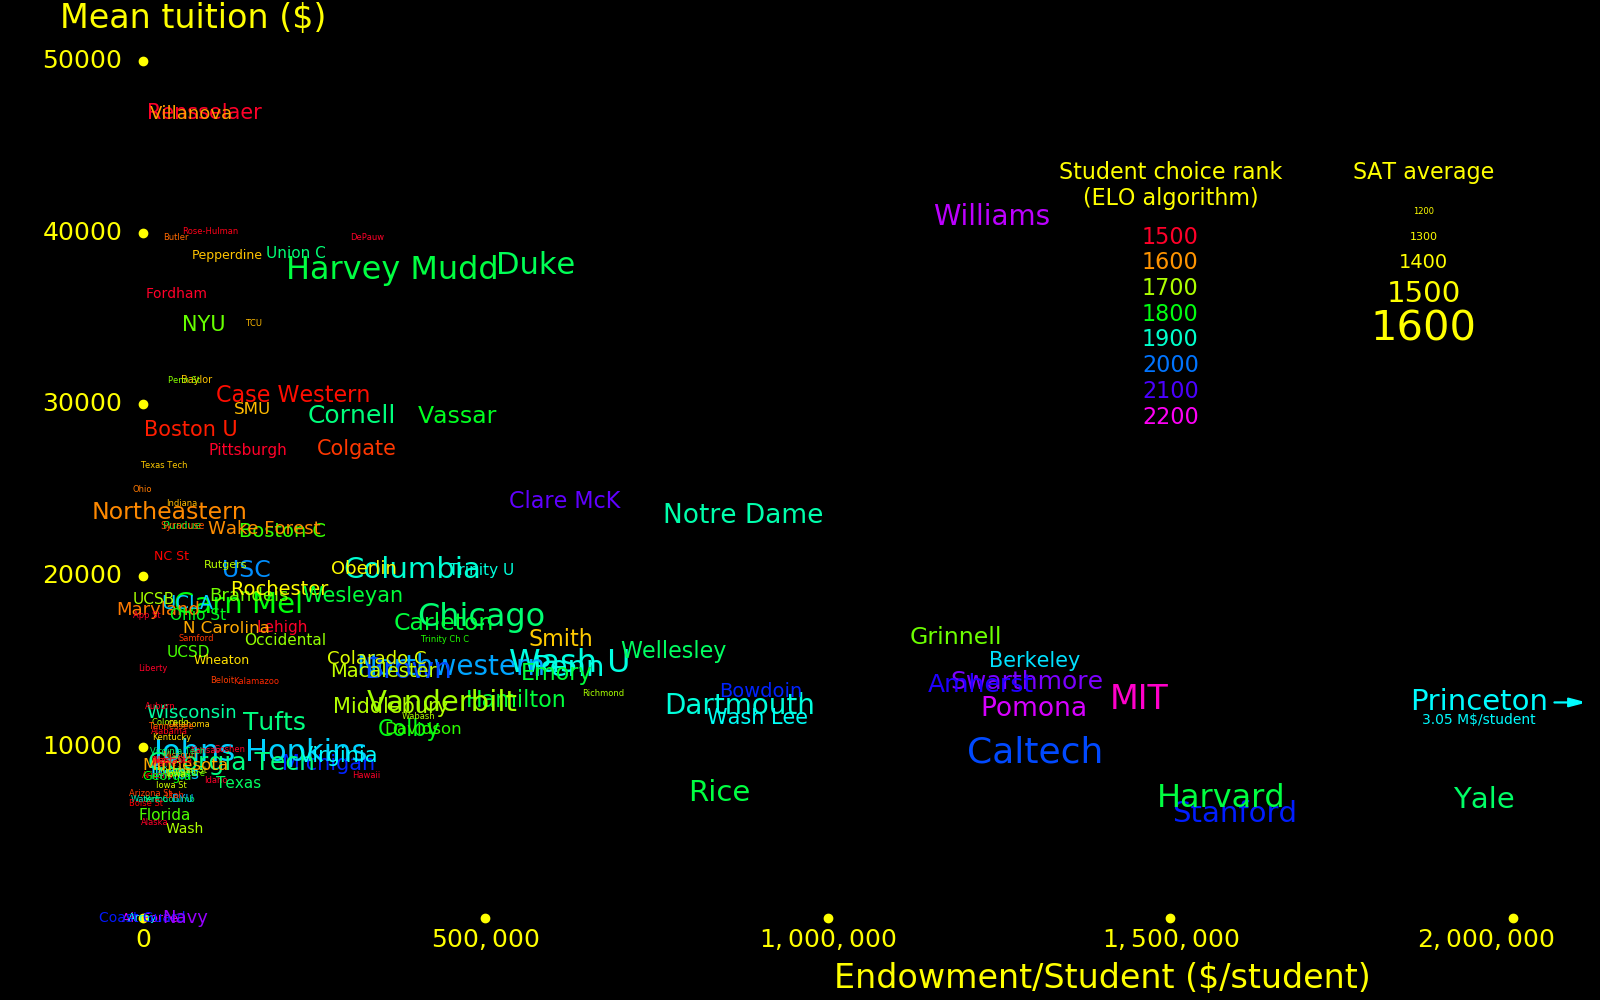
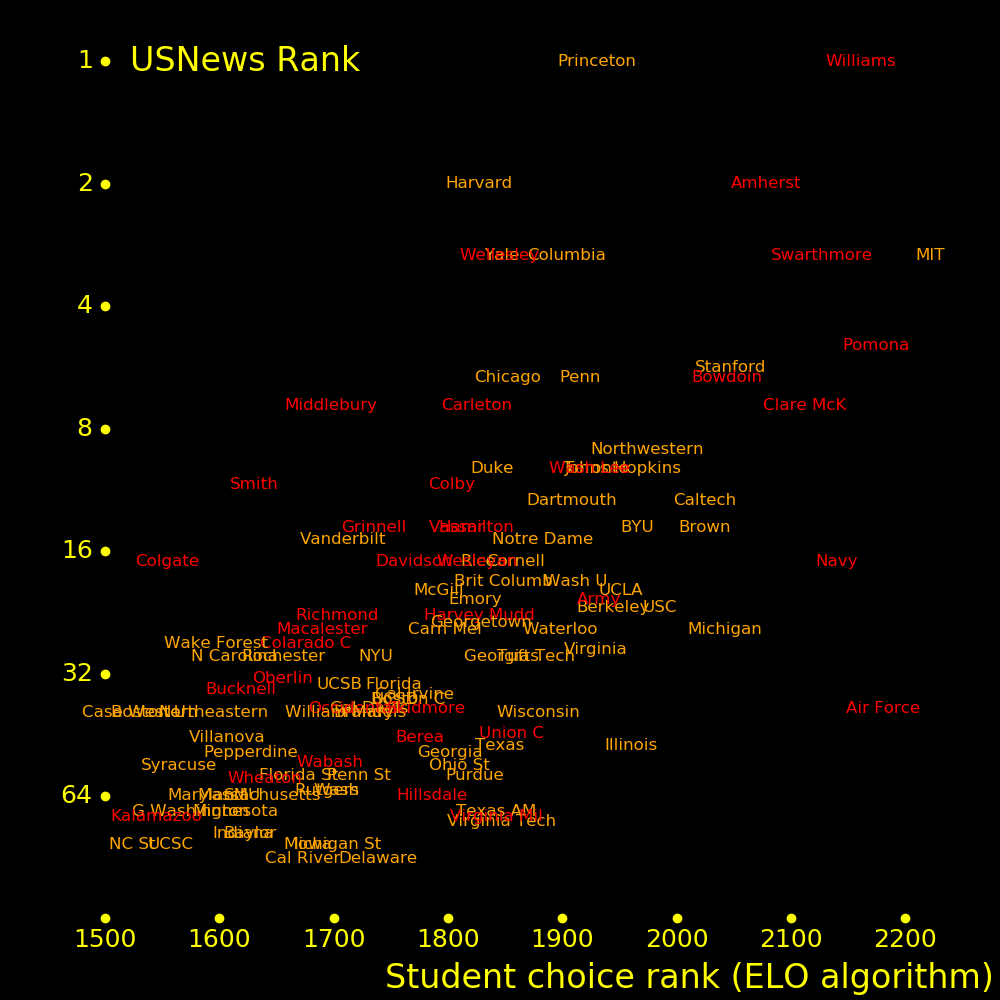
The measures of the strength of a college are:
Large endowment/student
Low average tuition
High student choice rank
High SAT average score
The plot shows these measures for American and Canadian colleges. Colleges that are in peril of failing are to the upper left, and are in small red font.
MIT is the most dominant college for student choice and SAT score. Student choice rankings come from parchment.com.
 |
|---|
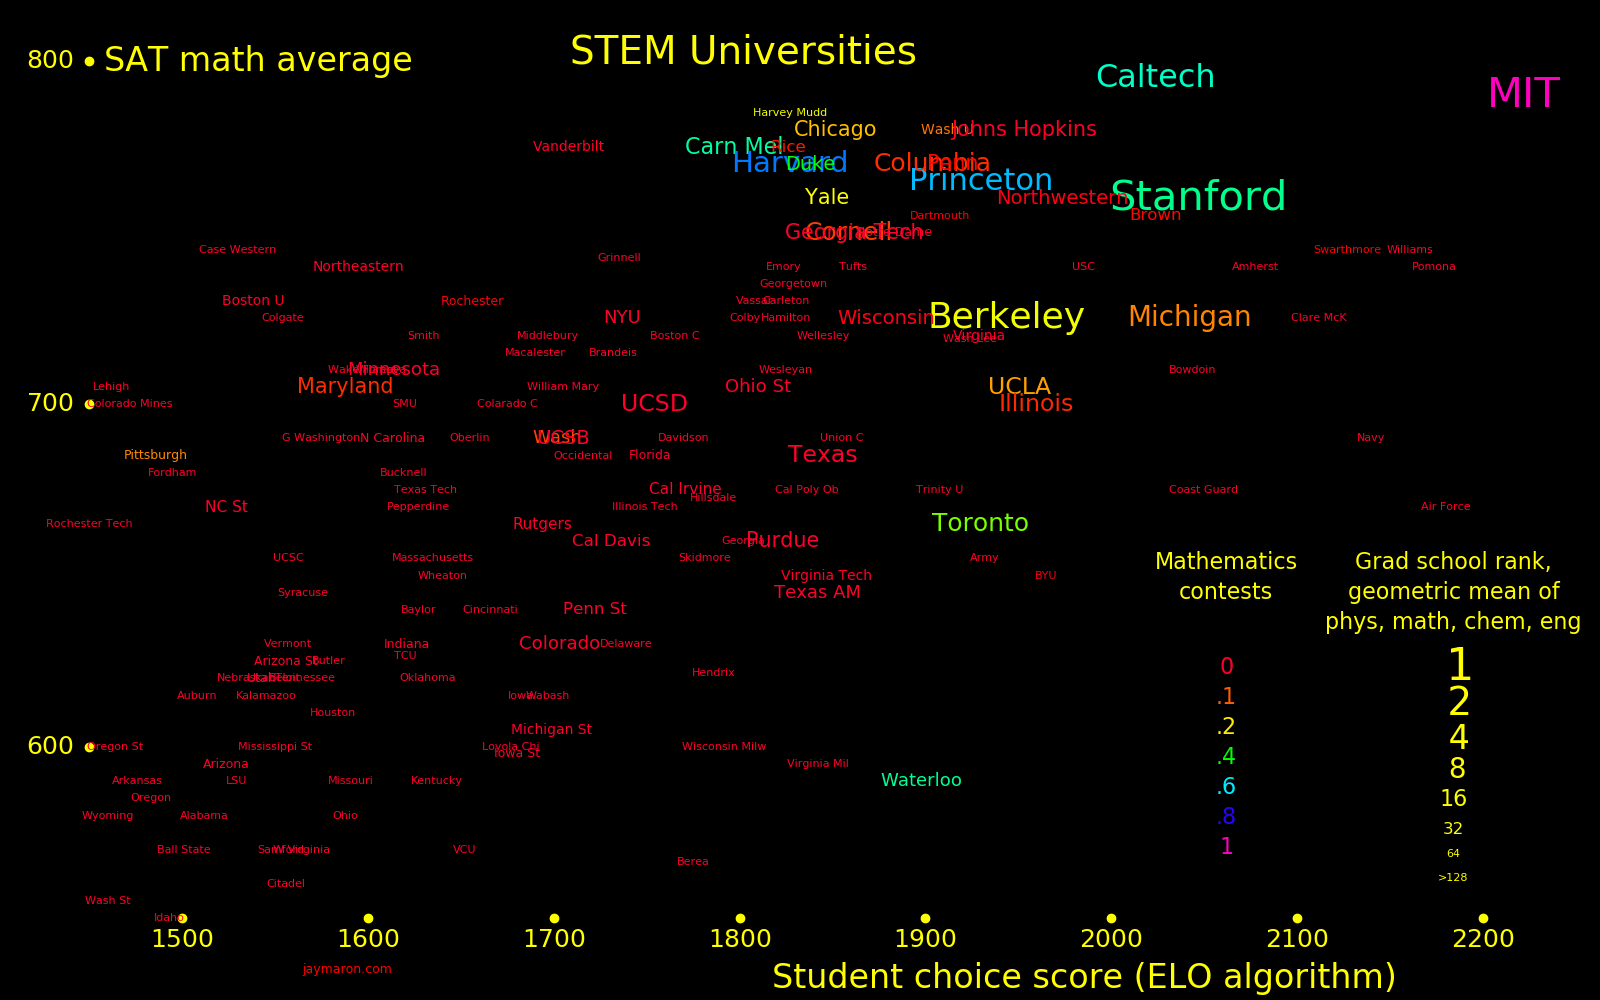
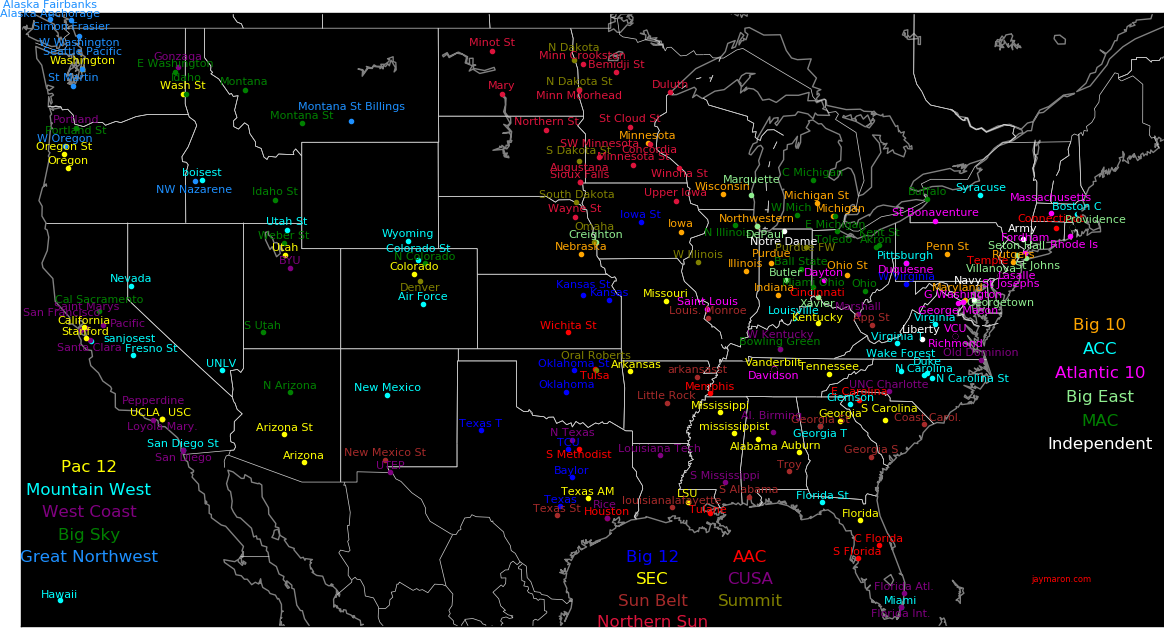
The following plot shows the dominant STEM colleges.
 |
|---|
Student choice rankings are not well correlated with the USNews rankings.
 |
|---|
 |
|---|
|
|
|
 |
 |
|
|---|---|---|---|---|
Core requirements:
                         Caltech  MIT  U. Chicago  CUNY  Harvard  Juilliard  MSM

Biology                     *      *       *        *       *
Lab                         *      *       *        *       *
Mathematics                 *      *       *        *       *
Calculus                    *      *       *
Chemistry                   *      *
Multivariable Calculus      *      *
Mechanics (with Calculus)   *      *
Electromag (with Calculus)  *      *
Sports                      *      *
Differential equations      *
Quantum Mechanics           *
Thermodynamics              *
         Teachers     Administrators   Administrators
        per student    per student      per teacher

Public     .064           .073             1.14
Private    .07            .102             1.46
Data from the "Delta Cost Project".
Numbers indicate fraction of the budget.
                        Teachers  Admins  Aid  Students  Operating

University of California  .38      .30    .14
Santa Clara University    .26      .25    .16    .018      .17
University of Montana     .48      .13    .09
Caltech expenses:
Teaching    42%
Research    40%
Admin       13%
Auxiliary    5%
Caltech revenue:
Grants    56%
Endowment 17%
Gifts      8%
Tuition    6%
Other     13%
                         #     M$    k$ per   Frac of    Frac classes
                                     person   spending   taught
Students               26606     -      -
Full time teachers       534   48.2   90.3     .43         .488
Part time teachers      1054   21.2   20.1     .19         .512
Full time non-teachers   703   42.4   60.3     .38         .0
Total                  28897  111.8     -     1.00        1.00


Students / Teachers            =  16.8
Students / Full time teachers  =  49.8
Course cost                    =  265 $/credit
In state tuition               = 5169 $
Out of state tuition           = 9969 $
Classes offered per semester   = 5300
         Millions of $

Federal       370
Non-profit    115.3
State         108
Industry       63.3
U.C.           17.3
Total         673.9
Data for 2015-16
Harvard        1    Cornell       21    U. Queensland    52    Erasmus U. Rot.  82
MIT            2    U.Col. London 22    McGill           53    Monash U.        84
UC Berkeley    3    UCSF          23    U. Munich        53    Kyoto U.         86
Stanford       4    UCSB          24    U. Manchester    56    U. Paris-Sud     88
Oxford         5    Northwestern  25    EPF Lausanne     58    U. Barcelona     90
Cambridge      6    Wisconsin     26    Tsinghua         59    U. New S. Wales  90
Caltech        7    Swiss Tech    27    King's College   61    U. Groningen     93
UCLA           8    UNC           28    U. Copenhagen    61    Mayo Clinic      94
Columbia       9    Minnesota     29    Tech U. Munich   64    Fudan U.         96
Chicago       10    Texas         30    U. Hong Kong     64    Ghent U.         97
U. Wash       11    U. Tokyo      31    Humbolt Berlin   68    Lund U.          97
Johns Hopkins 12    U. Brit Colum 33    Utrecht U.       69    U. Freiburg      99
Princeton     13    Heidelberg U. 37    Karolinska Inst. 72    U. Helsinki     101
U. Penn       14    U. Eidenburgh 37    Nanyang Tech     74    U. Glasgow      102
Yale          14    U. Melbourne  40    U. Bristol       74    VU U. Amsterdam 102
Toronto       16    Peking U.     41    Leiden U.        77    U. Geneva       104
Michigan      17    KU Leuven     42    U. Zurich        77    Seoul Nat. U.   105
Imperial Col. 18    N. U. Singap. 49    U. Amsterdam     79    U. Alberta      106
UCSD          19    Curie U.      49    Australian Nat U 80    Zhejiang U.     106
Duke          20    U. Sydney     51    Free U. Berlin   81    U Paris Diderot 109
U.S. News
            6     5     4     3     2     1     0

Singapore 19.0  21.0  22.0  17.5  12.2   6.1   2.2
Taiwan    18.0  19.2  19.7  17.1  13.1   8.3   4.5
Hong Kong 12.3  21.4  26.1  19.7  12.0   5.9   2.6
S. Korea  12.1  18.8  23.9  21.4  14.7   6.4   2.7
Japan      7.6  16.0  23.7  24.7  16.9   7.9   3.2
Lichten.   7.4  17.4  23.2  22.7  15.2  10.6   3.5
Switz.     6.8  14.6  23.9  24.5  17.8   8.9   3.6
Belgium    6.1  13.4  20.6  22.4  18.4  12.0   7.0
Poland     5.0  11.7  21.3  25.5  22.1  11.1   3.3
Germany    4.7  12.8  21.7  23.7  19.4  12.2   5.5
Canada     4.3  12.1  22.4  26.4  21.0  10.2   3.6
Finland    3.5  11.7  23.2  28.8  20.5   8.9   3.3
France     3.1   9.8  18.9  23.8  22.1  13.6   8.7
UK         2.9   9.0  18.4  24.8  23.2  14.0   7.8
Italy      2.2   7.8  16.7  24.6  24.1  16.1   8.5
USA        2.2   6.6  15.8  23.3  26.3  17.9   8.0
Hungary    2.1   7.1  14.4  23.0  25.3  18.2   9.9
Brazil     0      .7   2.9   8.9  20.4  31.9  35.2
Mexico     0      .6   3.7  13.1  27.8  31.9  22.8
Argentina  0      .3   1.8   9.2  22.2  31.6  34.9
Columns indicate level of mathematical proficiency, 6 being highest.
Bias at elite universities:
The bias is larger than the difference in score. For example, Asians outscore
Blacks on average by 377 points, and Harvard favors Blacks over Asians by 450 points.
The Asian American Coalition
for Education has filed a complaint with the Department of Education requesting
that they investigate Harvard admissions.
A group of individuals is running for Harvard's Board of Overseers with the
platform of making Harvard admissions more fair. The candidates are
Ralph Nader, Ron Unz, Stephen Hsu, Stuart Taylor, and Lee Cheng.
Article
One of the few schools with race-blind admissions is Caltech, and it is reflected
by the fact that they have the best SAT scores.
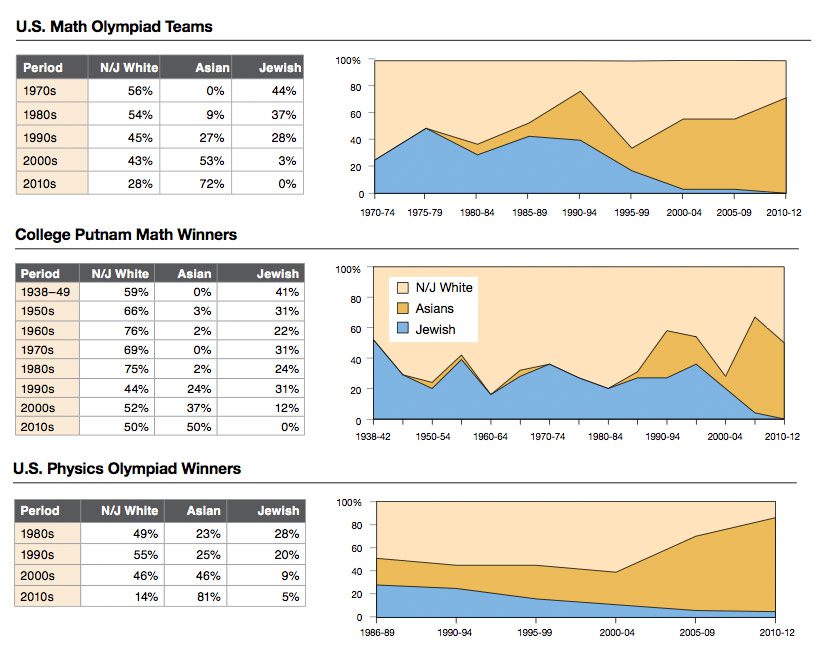
         Physics        Math    Putnam math  Science   Science talent    Siemens
         Olympiad     Olympiad    winners    Olympiad  search finalists  Competition
         winners (%)  team (%)     (%)       winners

Asian      81            72         50          50          64             61
White      19            28         50          50          36             39
Other      <1            <1         <1           0           0              0
Data
      Bachelor  Master  PhD  SAT   SAT   SAT     SAT     SAT      SAT      Mean tax  Frac paying  Public education $
                             math  read  write  total  math>750  change   per person  zero tax    spent per student
         %        %      %                                %     2006-2015     k$          %            k$

Asian       51.0  20.4  6.4  598   525   531   1654      14       54           50         35.5         11.5
White       32.6  11.5  3.1  534   529   513   1576       2       -6           35         37.6         10.8
Hispanic    13.3   3.9  1.0  457   448   438   1343       1      -28           18         52.0         11.0
Black       19.8   6.2  1.3  428   431   418   1277        .5    -14           17         50.7         11.4
Am. Indian  14.8   5.0  1.4  482   481   460   1423              -17
Indian      70
S. Korean   53
Chinese     51
Filipino    47
Japanese    46
Vietnamese  26
SAT data
Public education spending data
Income data
Data
Data
          SAT      SAT     ACT     SAT relative
        average    bias    bias      to White

Asian     1654    -140    -3.4         78
White     1576       0     0            0
Hispanic  1423    +130    +0.3       -153
Black     1277    +310    +3.8       -299
Wall Street Journal article on SAT bias.
         Asian  White  Hispanic  Black  International

Caltech    44    28       6       1        9
MIT        30    34      15      10
U. Chicago 17.0  42.8     9.0     4.5      9.7
Princeton  20    46       9       6       11
Penn       19.7  44.7    10.3     7.1     11.3
Columbia   17.1  38.1    12.8     7.2
Cornell    16
Harvard    17
Dartmouth  14
Brown      12
Numbers are percentages.
![]()
© Jason Maron, all rights reserved.