

|
|
|
|
|
|
|---|---|---|---|---|---|
 |
 |
 |
 |
 |
 |
|---|---|---|---|---|---|
 |
|---|
The best near-term energy options are biomass and nuclear. Hydro is maxed out, solar and wind are growing too slowly, and tidal and geothermal are too feeble. Solar and wind are for the far future.
The best way to harness biomass energy is with trees, especially bamboo for its fast growth and ease of harvest. Trees can also capture atmospheric carbon. Tree production hinges on fertilizer. Making nitrogen fertilizer is easy with methane, hence this is an ideal use for methane. If you use methane to make fertilizer, then grow trees, then use them for energy, you produce more energy than the methane required to make the fertilizer. Also, the trees capture more carbon than was released by making the fertilizer. Article.
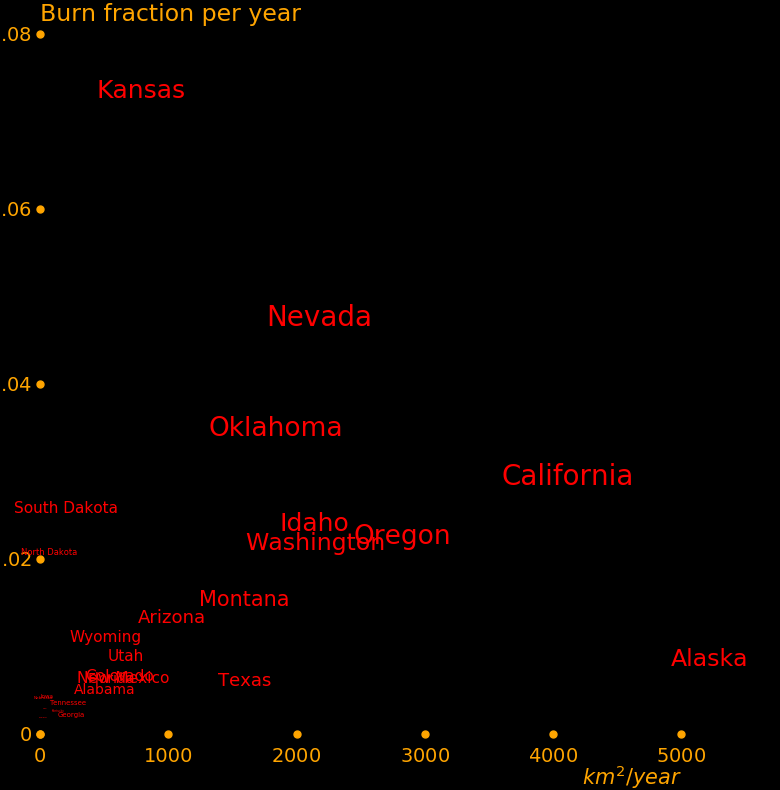
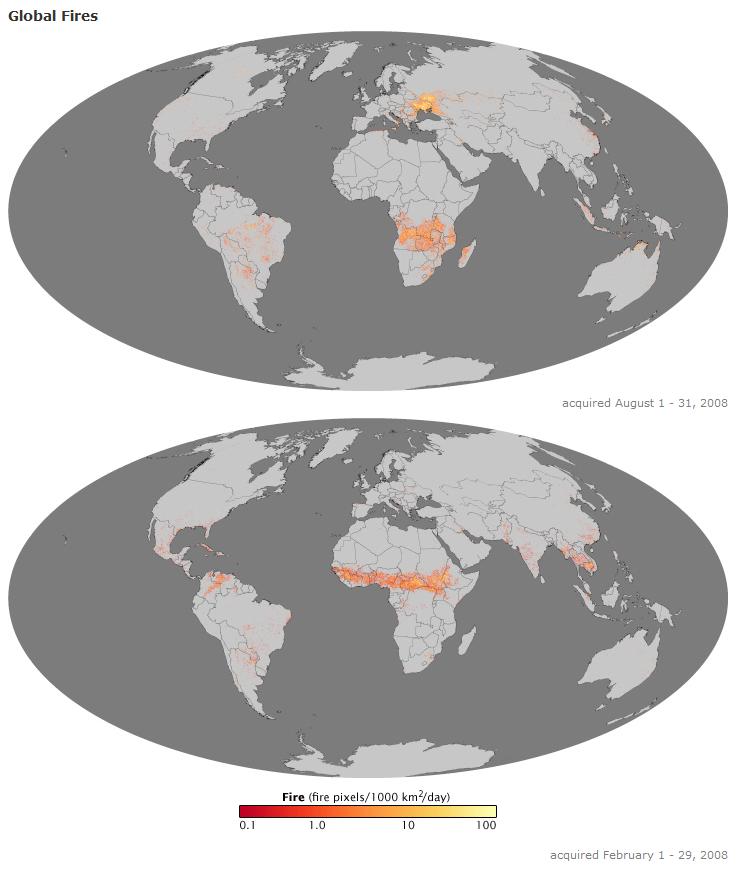
The energy lost to forest fires is substantial, and can be harnessed. Article.
Nuclear power is cheap and unlimited, and reactors can provide many things of value besides the usual heat and electricity. They can use transmutation to create precious metals and novel isotopes. A reactor's discard heat can heat a city. Radioactive waste contains valuable catalysts such as palladium and rhodium. New reactors have safety features that make melt-downs impossible. Article.
For producing steel, using coal produces much less carbon than by other means, hence coal is necessary.
Gasoline is necessary for combustion motors. The most convenient fuel for motors is liquid fuel. Gasoline is also necessary for aircraft turbines.
Atmospheric carbon can be captured with trees or ocean iron fertilizer.
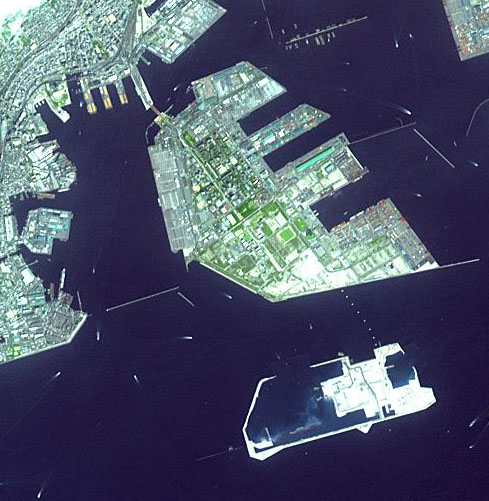
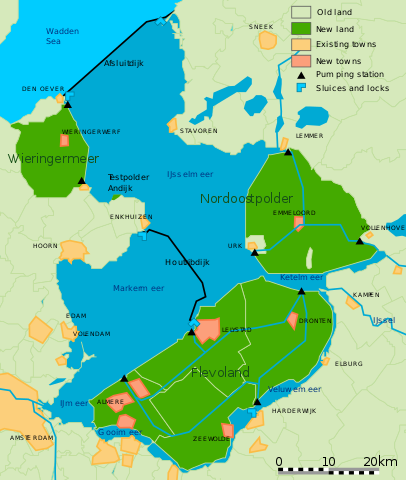
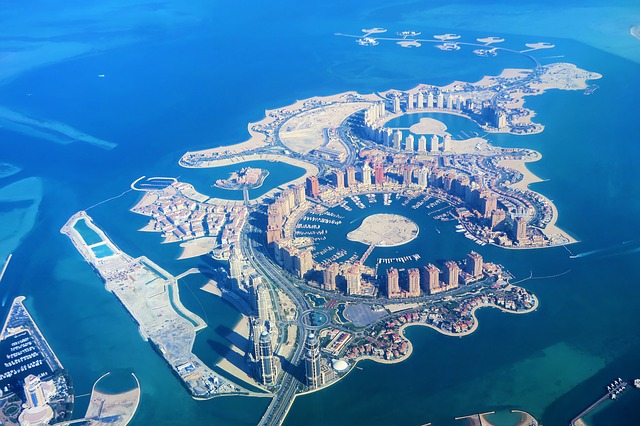
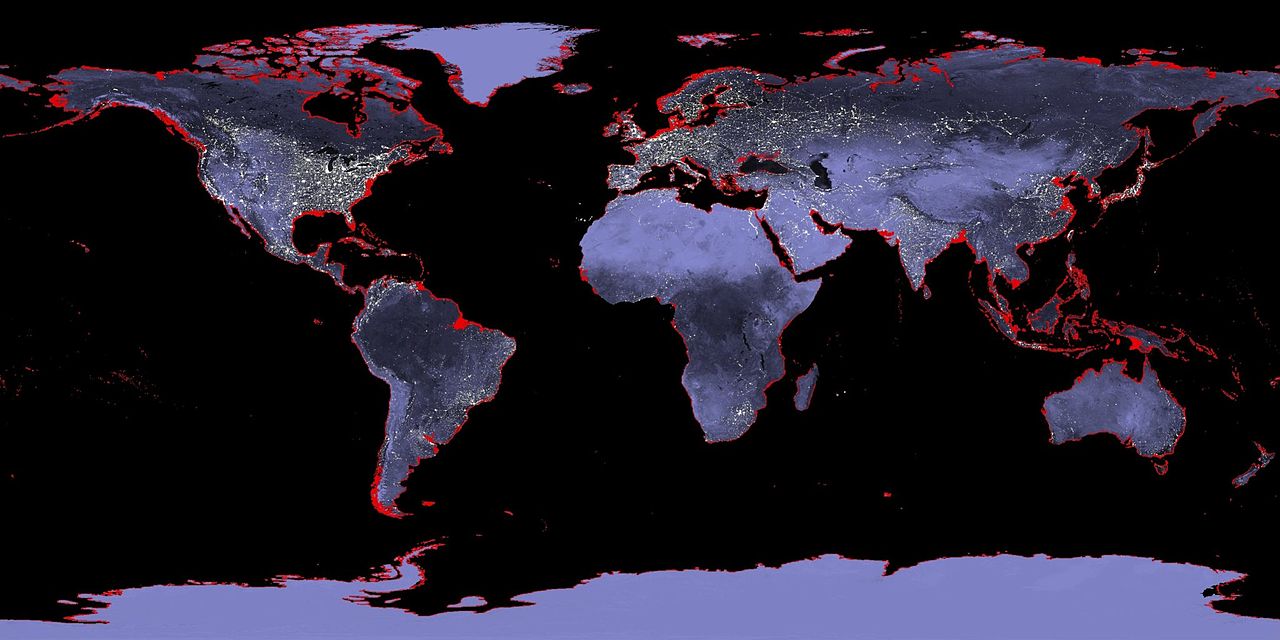
Sea level rise is easily countered by creating new land
. The land lost to sea level rise is 53000 km3 and the land created artificially is 25000 km2. New land is usually worth more than the cost of creating it. Article.Global warming can be countered by increasing the Earth's reflectivity, by cloud seeding or a space mirror.
Electric vehicles improve cities because they can be compact and quiet. Article.
Energy is required for farming, chiefly through fertilizer. Modern farming can support 400 people/km2 and the current world population density is 52 people/km2. The world can support 8 times as many people. Article.
Tackling climate is a tradeoff. You need to both cool the Earth and maximimize energy production. Energy is important because energy begets wealth, and you need wealth to tackle climate. Energy generates wealth via
Energy → Primary materials → Manufacturing → Exports → Wealth.
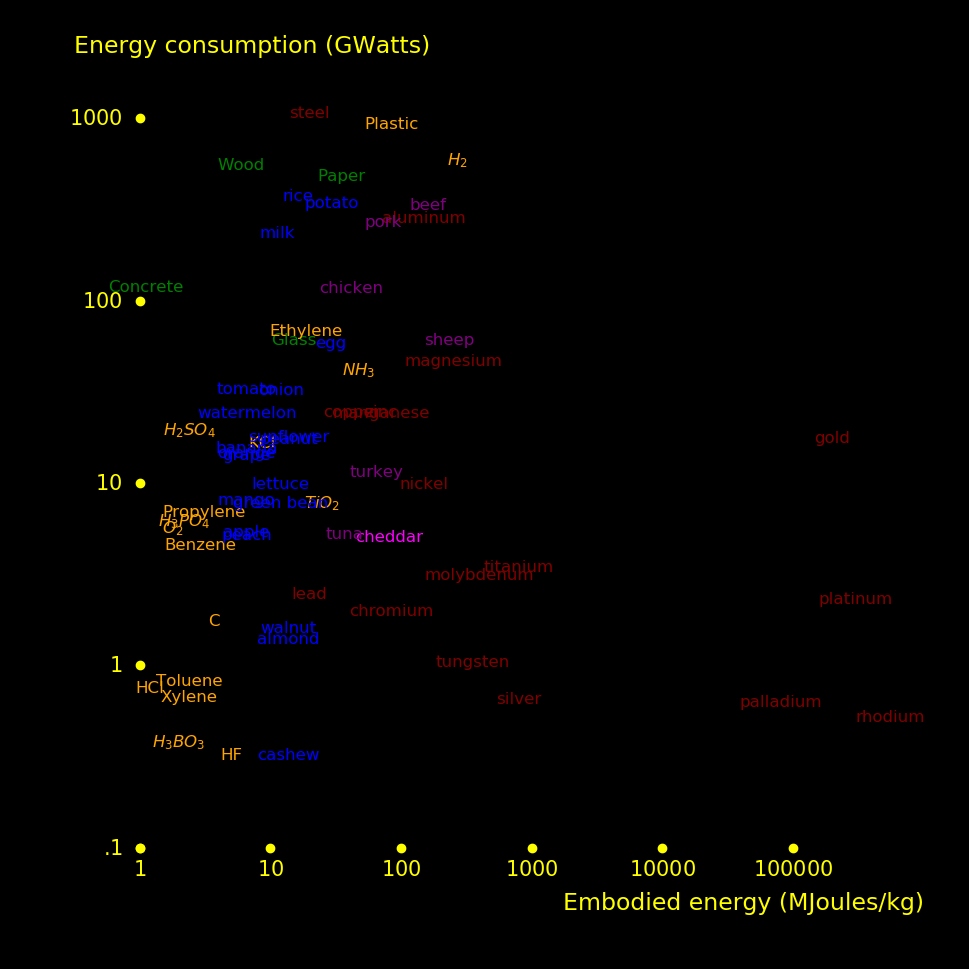
Primary materials includes things like metals, chemicals, plastic, and lumber. Energy dominates the production of most primary materials and is also significant for manufacturing.
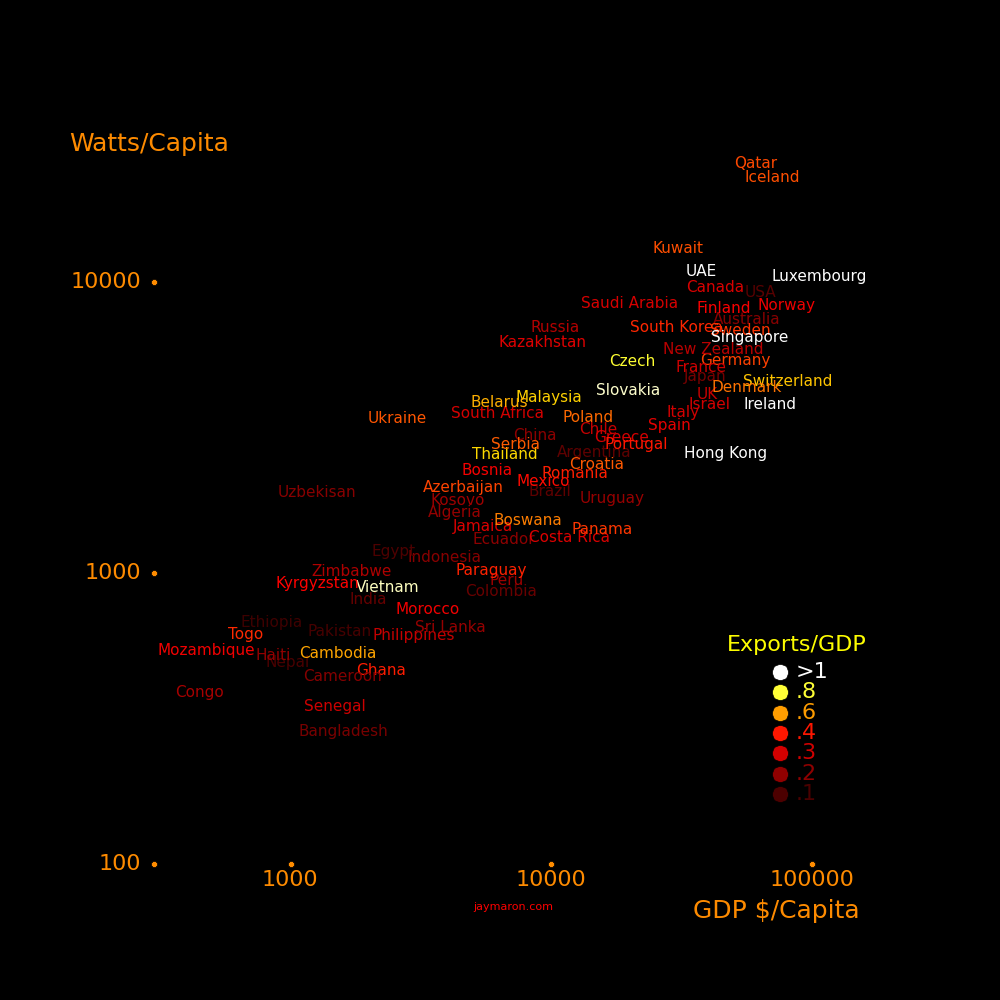
Energy and wealth are tightly correlated.
 |
|---|
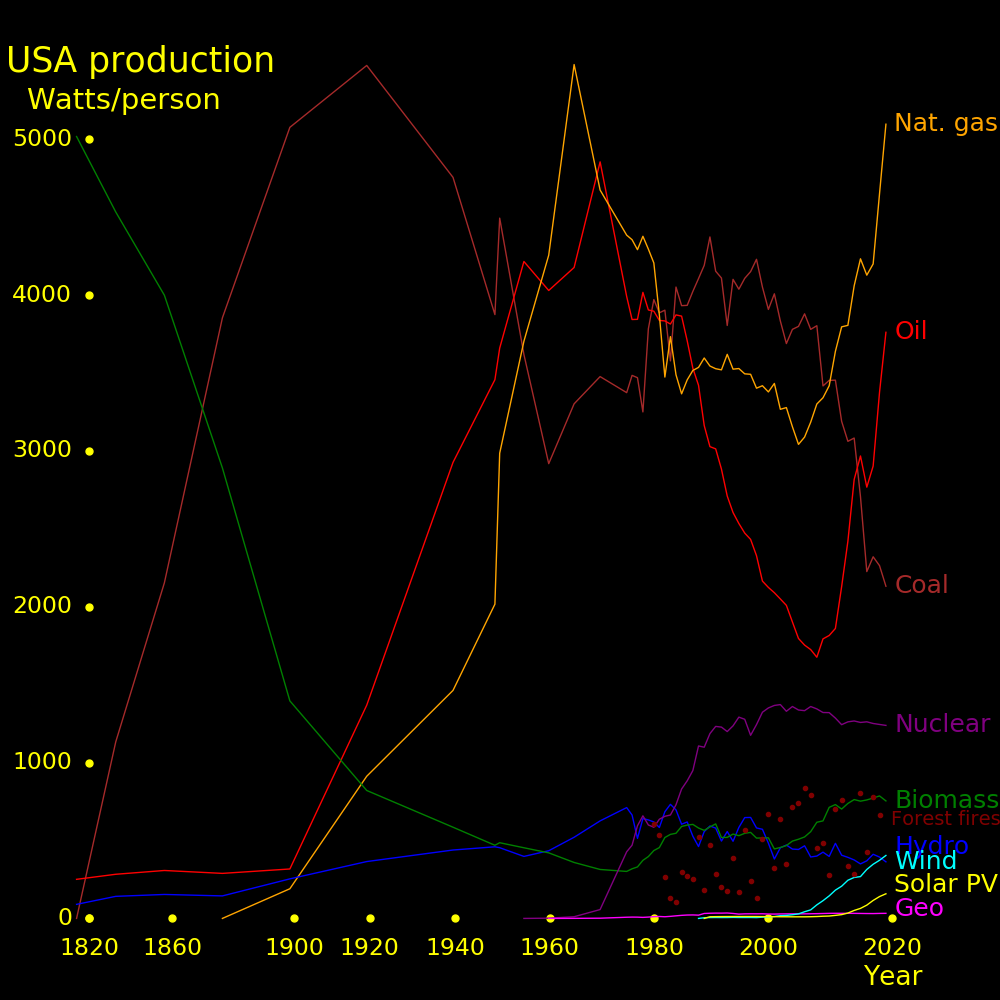
You want to make energy as abundant and cheap as possible, hence all energy sources should be maximized. Each energy source has a unique role. Natural gas is good for heat, coal is good for metal smelting, and oil is good for vehicle fuel.
 |
 |
 |
|
|---|---|---|---|
The atmospheric carbon increase of 4000 billion kg/year can be offset by planting 4 million km2 of trees. The fertilizer requirement is 340 billion $/year, and the value of the wood produced is substantially greater.
The amount of forest needed is:
Atmospheric carbon increase     = C        = 4000  billion kg/year
Forest carbon capture rate      = R        =  1.0  carbon kg/meter2/year
Forest needed to offset carbon  = A = C/R  =    4  million km2
The value of wood produced is:
Wood commodity price            = w        =   .3  $/kg
Wood carbon mass fraction       = c        =   .5
Value of wood produced          = W = Cw/c = 2400  billion $/year
The cost for nitrogen fertilizer is:
Wood nitrogen mass fraction     = n        =   .01
Nitrogen requiremnet            = N = Cn/c =    80  billion kg/year
Price of nitrogen in fertilizer = p        =   2.1  $/kg
Total nitrogen price            = P = p N  =   170  billion $/year
Trees also need potassium, phosphorus, calcium, magnesium, and sulfur, and their total cost is similar to that of the nitrogen. The total fertilizer cost is double the nitrogen cost, or 340 billion $/year.
Trees should be planted close to water. For existing trees, fertilizer should go to large trees that are close to water.
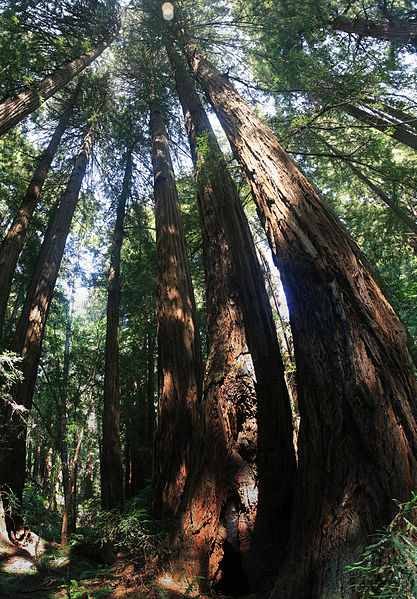
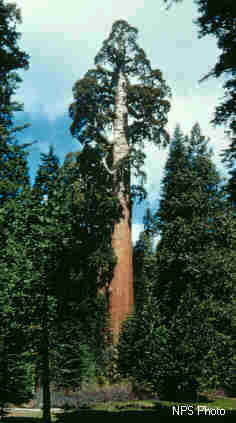
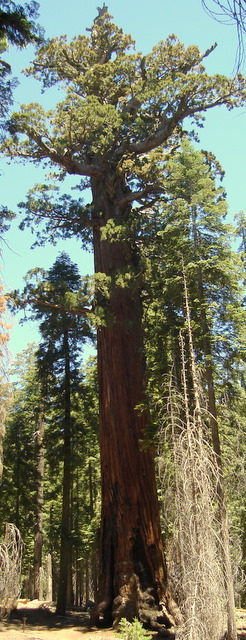
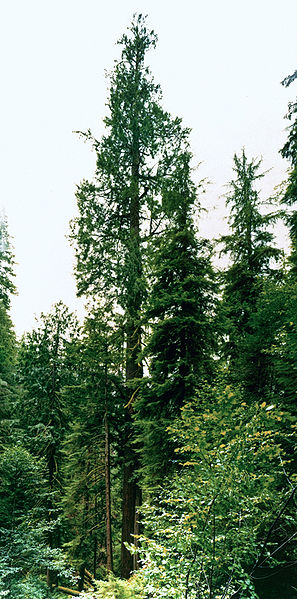
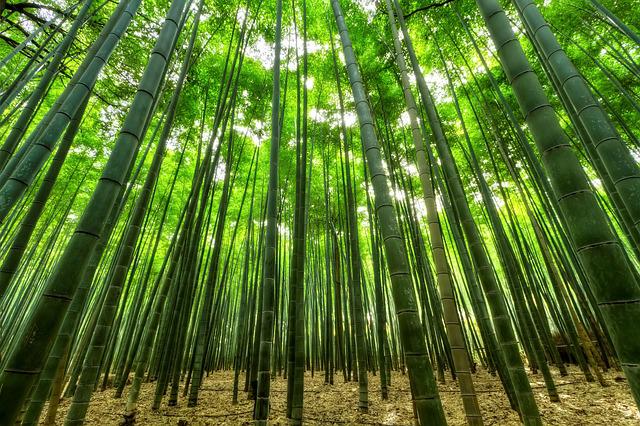
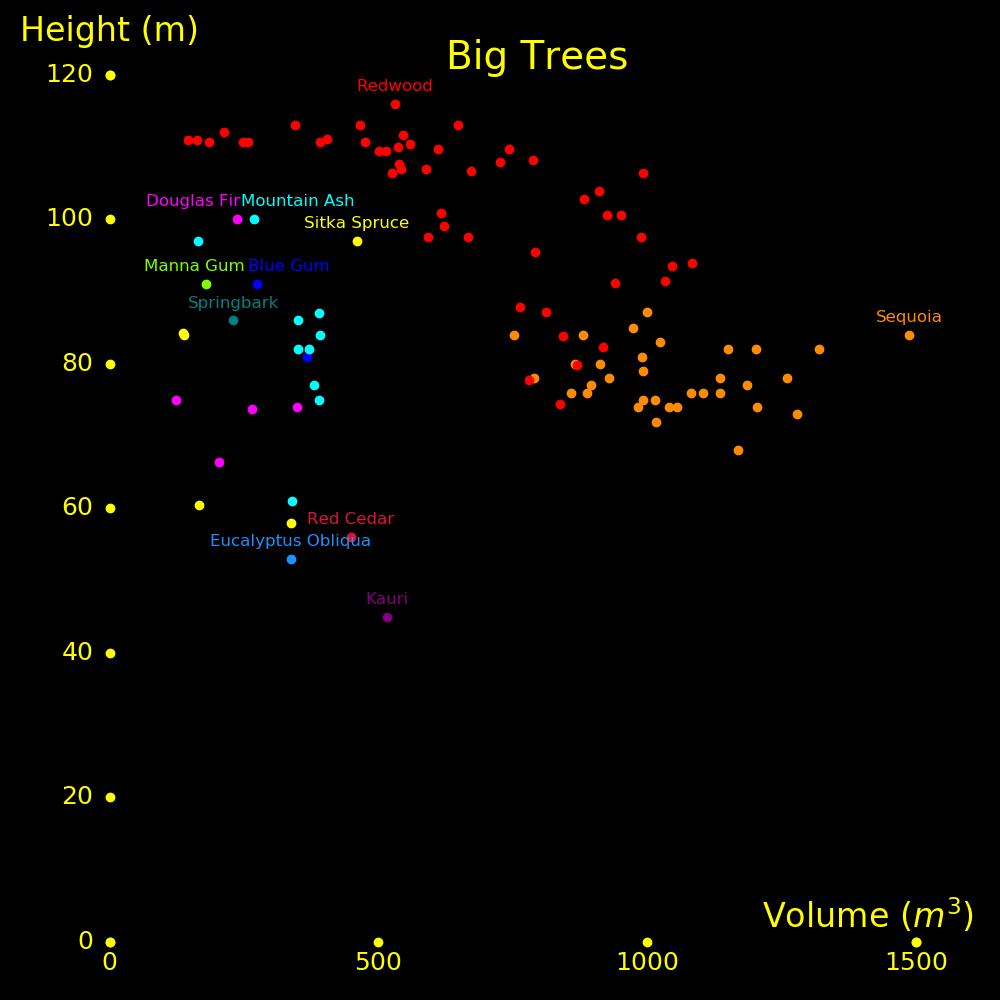
For new trees, chose trees that will become tall and wide. The largest trees are sequoias, redwoods, douglas firs, and eucalyptus. The fastest growing tree is bamboo, which produces 1 carbon kg/meter2/year.
World forest carbon:
Carbon in atmosphere         = 880  trillion kg
Carbon in plants             = 550  trillion kg
Carbon in trees              = 500  trillion kg
Total human-generated carbon = 300  trillion kg
Carbon from deforestation    =  36  trillion kg

Atmosphere carbon increase   =   4  trillion kg/year
Forest carbon capture rate   =  45  trillion kg/year
World forests
Deforestation rate           = .35  trillion kg/year
Carbon from forest fires     = .25  trillion kg/year
World forest area            =  39  million km2
Forest wood density          =  11  kg/meter2

Total wood carbon harvested  =4.56  trillion kg/year     Wood for power + wood for industry
Wood carbon for biomass power=1.59  trillion kg/year
Wood carbon for industry     =2.97  trillion kg/year
 |
 |
 |
|---|---|---|
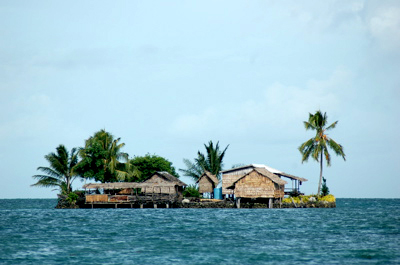
Rising sea level has claimed 53000 km3 of land and civilization has created 25000 km3 of land. It's an easy matter to build land faster than the sea takes it, plus the new land has value.
              Gain       Loss
              km2        km2

World         25000     53375
China         13500
Netherlands    7000
South Korea    1550
USA            1000
Japan           500      2190
UAE             470
Bahrain         410
Singapore       135
Bangladesh      110
Ecuador                 28500
Vietnam                 14700
Sweden                   3290
Iraq                     3070
Bulgaria                 2030
Cuba                      980
Azerbaijan                580
El Salvador               130
St Kitts & Nevis           90
Seychelles                  5
 |
 |
 |
|---|---|---|
The sea level can be lowered by dredging material from the ocean floor and piling it onto land. Rivers and lakes can be dredged to create freshwater reservoirs.
Sea level rises by 3.1 mm/year, which can be offset by spending 1.5e18 Joules/year, which is 0.08 % of the world's energy expenditure. Civilization can easily offset sea level rise.
The energy required to lower the sea level by 1 mm is:
Earth ocean area                                    =  3.61e14  m2
Volume of water in 1mm of the ocean =  V            =      361  km3
Density of rock                     =  D            =     2800  kg/m3
Height that the rock is raised      =  Z            =       50  meter
Gravity constant                    =  g            =       10  m/s2
Mass of rock dredged                =  M  =  D V    =   1.0e15  kg
Energy of rock dredged              =  e  =  M g Z  =   5.0e17  Joules
World energy production             =  E            =   6.0e20  Joules/year
|
 |
 |
|---|---|---|
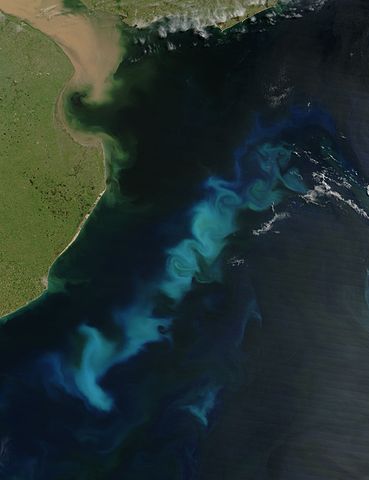
Fertilizing the ocean with iron causes large-scale biomass growth, and when it dies it takes the carbon to the bottom of the ocean.
In the ocean the microbe nutrient requirement is:
Element     Relative mass

Carbon        1
Nitrogen       .18
Phosphorus     .024
Iron           .000044
Iron is insoluble in the ocean and is usually the limiting nutrient. Between nitrogen and phosphorus, nitrogen is usually the limiting nutrient. A small amount of iron fertilizer can capture a large amount of carbon.
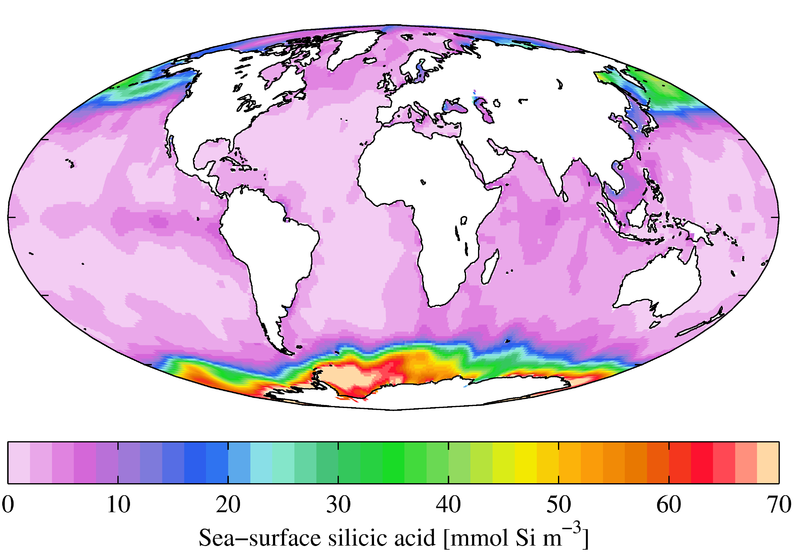
Diatoms are microbes with silicon walls as opposed to conventional lipid membranes. If silicon is present then silicon microbes outcompete lipid microbes because silicon walls cost 8% as much energy to make as lipid membranes.
Diatoms are good carbon fixers because when they die they sink to the bottom of the ocean, and the carbon stays there.
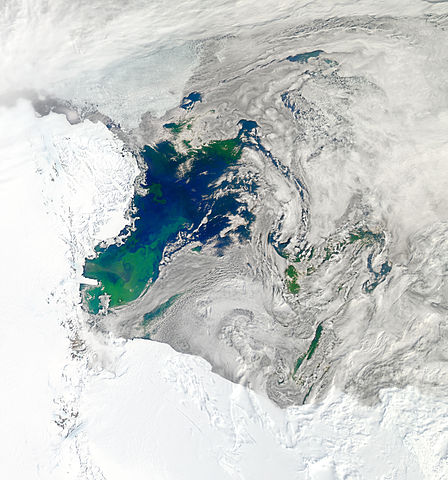
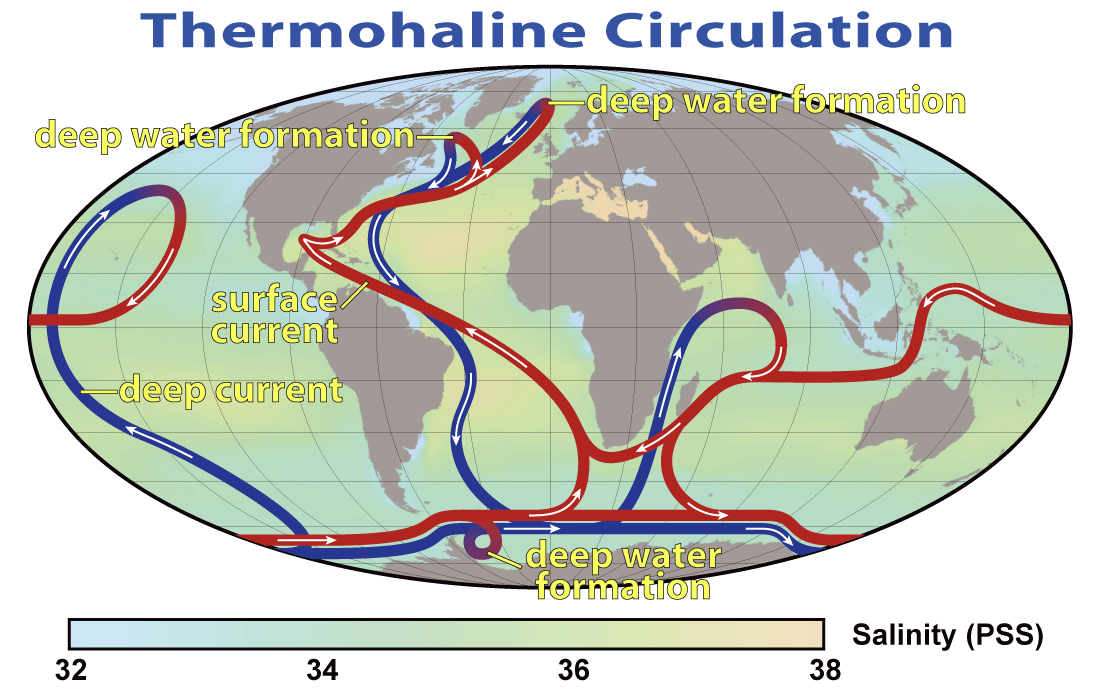
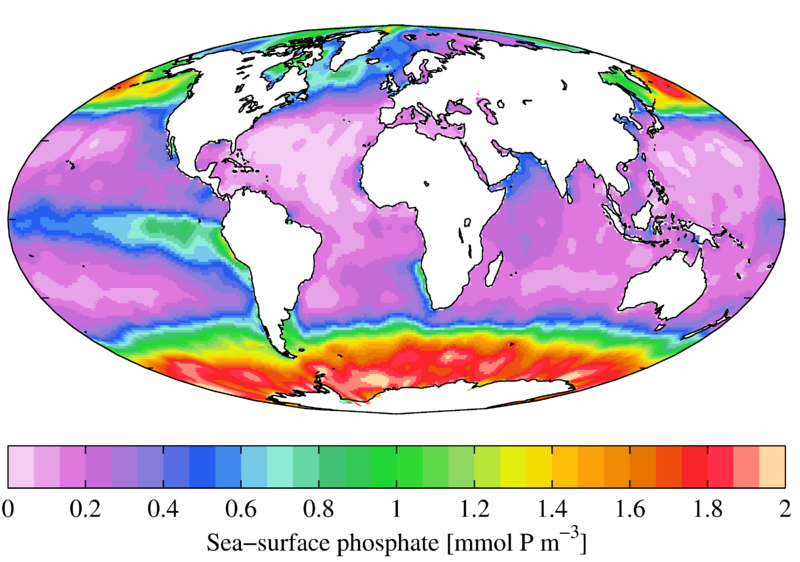
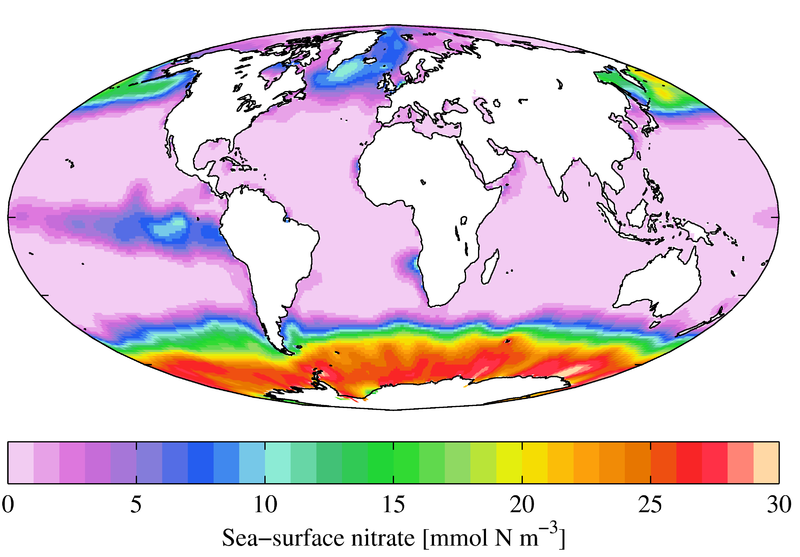
The best place to fertilize the ocean with iron is the Antarctic Atlantic, where iron is scarce and silicon, nitrogen, and phosphorus are abundant. This is also the region where the ocean currents flow downward.
Ocean concentrations of phosphorus, nitrogen, and silicon:
 |
 |
 |
|---|---|---|
 |
 |
 |
|---|---|---|
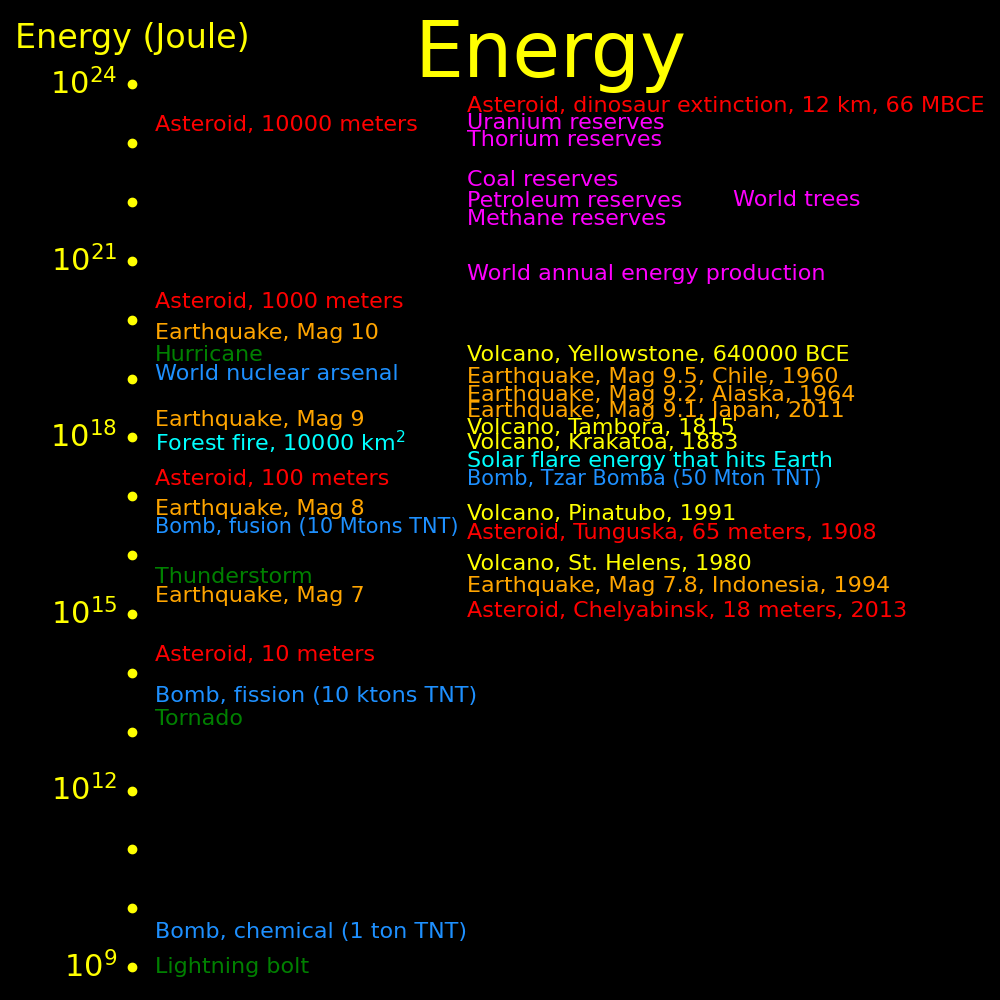
Asteroids have vast kinetic energy. A 1 km asteroid has as much energy as America's yearly output.
 |
|---|
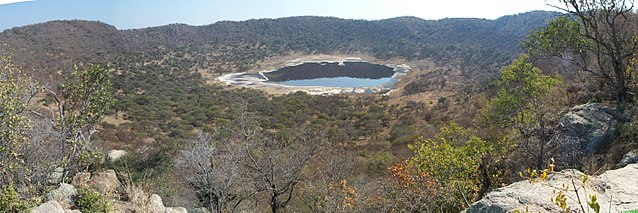
Asteroid energy can be harnessed with a lake. An asteroid blasts the water out of the lake, and then hydro energy is extracted as the lake refills.
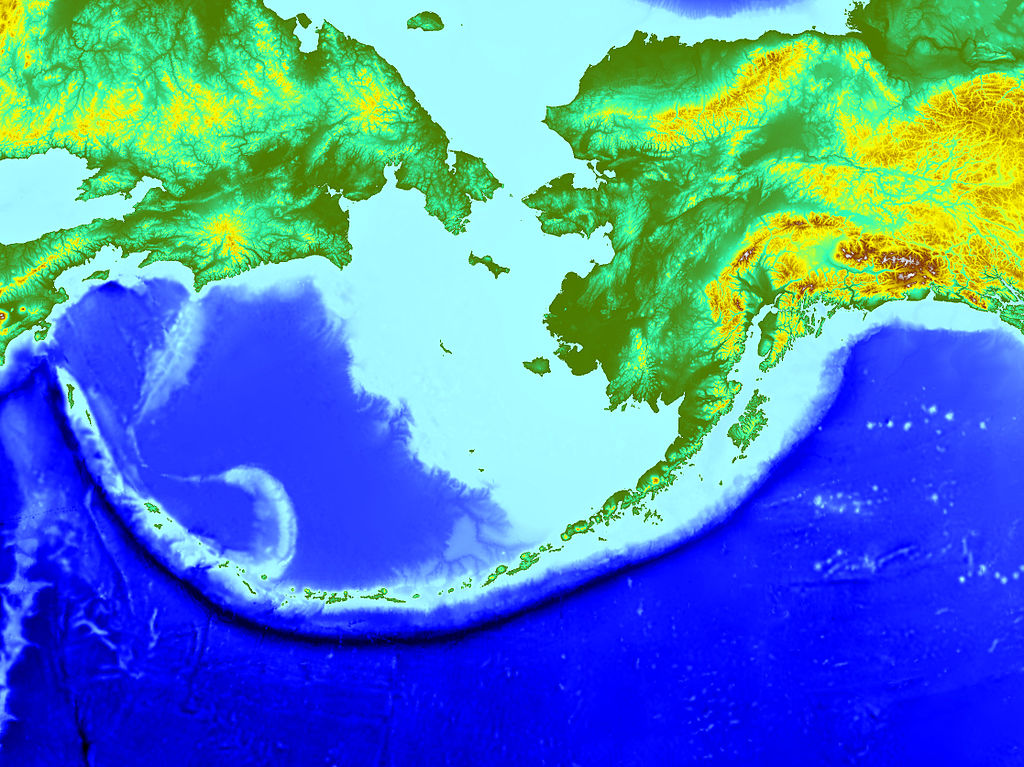
You need a big source of water to extract the hydropower. The crater should be near a large river. Or, the crater can be near the ocean, and you can use ocean water to refill the crater.
A good site for a crater is Alaska, which is naturally prone to large earthquakes, and is lightly inhabited. The Aleutian Islands are a possiblity.
 |
|---|
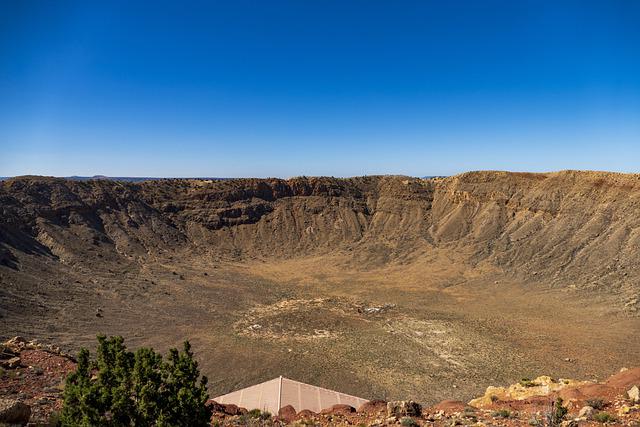
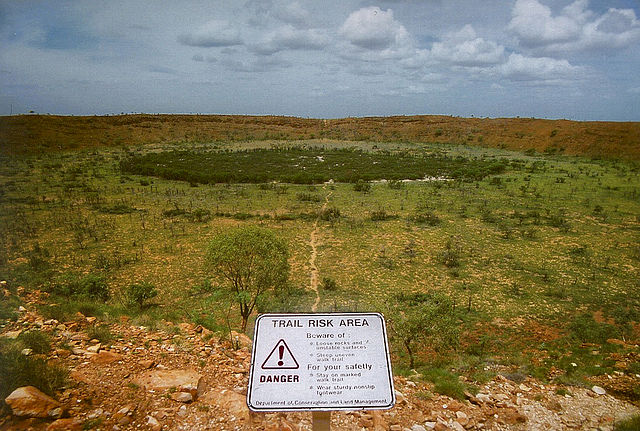
The asteroid should be large enough to matter, but not large enough to cause excessive damage. The sweet spot is an asteroid around 300 meters in size, which makes a crater around 5 km in diameter and .5 km deep.
 |
 |
 |
 |
|---|---|---|---|
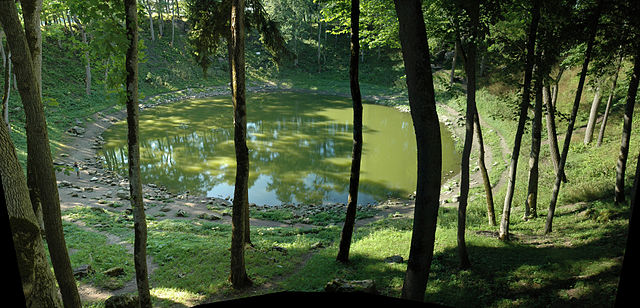
The table lists all craters for which the meteor size is known.
             Depth   Diameter    Meteor    Age
              km        km       meter     Myr

Kaali                     .11        3     .0035
Campo del Cielo           .11        5     .0045
Montauraqi       .034     .360      15     .64
Wolfe Creek               .875      15     .12
Tswiang          .1      1.13       40     .22
Arizona          .17     1.2        50     .049
Steinheim                3.8       150   14
Houghton                23        2000   39
Nordlinger Ries         24        1500   15
Chesapeake      1.3     85        1300   35
Popigai                100        5000   36
Chixulub       20      180       10000   66
 |
|---|
 |
|---|
Volcanoes often cause global cooling, and the table shows all major volcanic cooling events.
Region        Volcano     Magma    Index   Year  Temperature change
                          (km3)                       Celcius

Philippines   Pinatubo        25     6     1991     -.2
Alaska        Novarupta       28     6     1912     +.2
Guatemala     Santa Maria     20     6     1902     -.1
Indonesia     Krakatoa        20     6     1883     -.4
Indonesia     Tambora        160     7     1815     -.5   Caused the "Year without a summer"
Iceland       Laki            14     6     1783     -1
Peru          Huenaputina     30     6     1600      ?
Vanuatu                      108     7     1452      ?
New Zealand   Tarawera               5     1315      ?    Famine of 1315-1317
Indonesia     Rinjani         10     7     1258      ?    Caused the Little Ice Age that ended the Viking era
Iceland       Hekla 3          1     5     1159      ?
North Korea   Paektu         110     7      946      ?
Unknown                              7      535     -2
Indonesia     Lake Toba     2800     8   -72000     -1
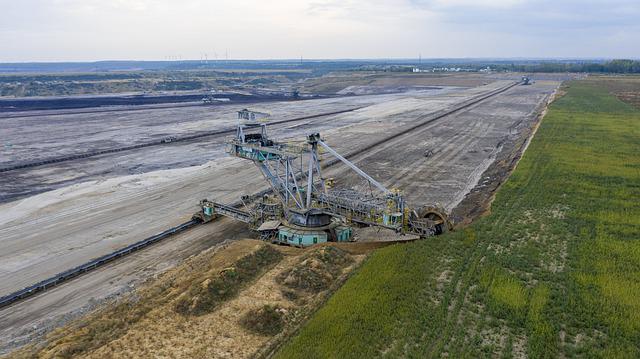
Meteors can uncover deep coal. Hilt's law states that the deeper the coal, the higher the quality tends to be. When coal is formed, the higher the formation temperature, the higher the quality.
Asteroids can be propelled with hydrogen bombs. Article.
 |
|---|
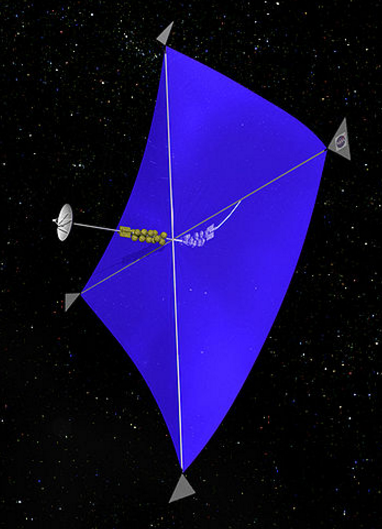
Jet Propulsion Laboratory designed a space mirror with the goal of minimizing the mass per area. It consists of mylar coated with aluminum.
Mirror surface density =     6  grams/meter2
Mirror thickness       = .0043  mm       (Mylar coated with aluminum)
Mylar density          =  1.39  g/cm3
Aluminum density       =  2.70  g/cm3
A space mirror can cool the Earth. Greenhouse gases generated by humans have increased the sun's effective brightness by 1.5 Watts/meter2. The size of a mirror required to cancel this is 560000 km2, which costs 3.4 trillion dollars to launch.
Greenhouse gas forcing preindustrial          =   1.5 Watts/meter2
Greenhouse gas forcing now                    =   3.0 Watts/meter2
Solar forcing change                = I       =   1.5 Watts/meter2
Solar forcing increase rate                   =  .031 Watts/meter2/year
Earth surface area                  = A       =   510 Million km2
Solar power change                  = P = IA  =   765 TWatts
Solar intensity                     = I       =  1361 Watts/meter2
Mirror area                         = A = P/I =560000 km2   =   (750 km)2
Mirror mass/area                    = D       =  .006 kg/meter2
Mirror mass                         = M = DA  =   3.4 billion kg
Launch cost per kg                            =  1000 $/kg
Mirror launch cost                            =   3.4 trillion $
_(NSF).jpg) |
 |
|---|---|
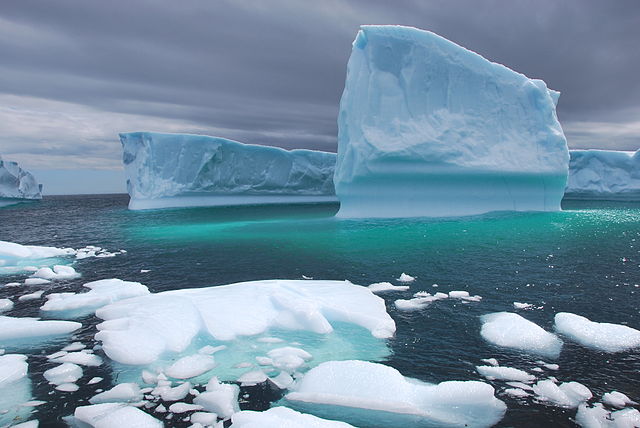
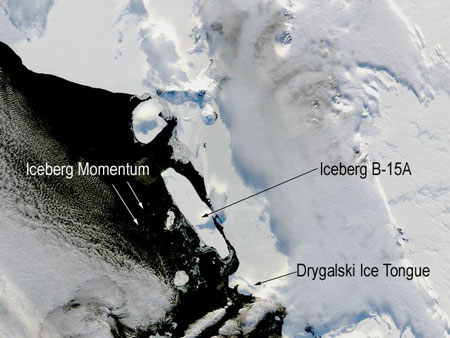
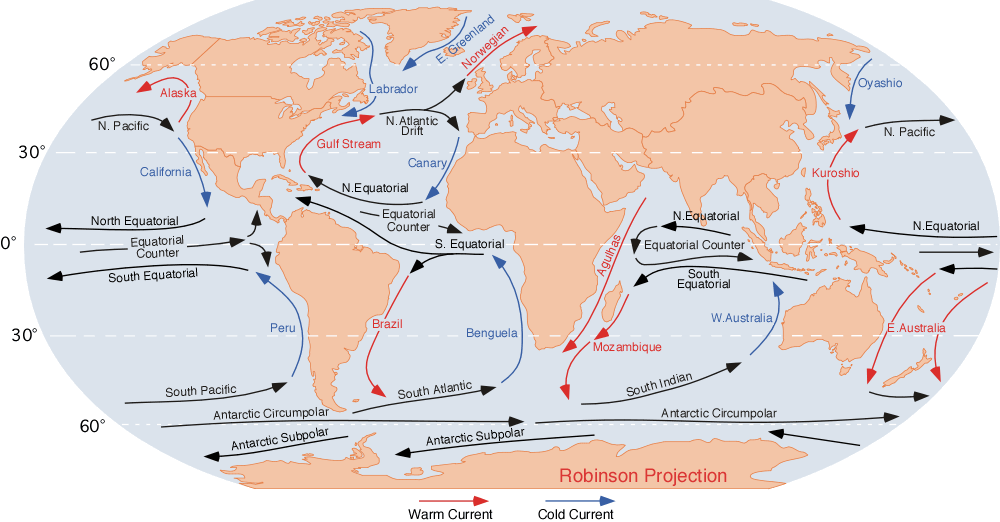
Antarctic icebergs can be moved to places in the tropics where sun is abundant but water is scarce. The energy required to move the iceberg costs far less than the value of the freshwater delivered.
Ocean currents can help save energy. The South Indian Current brings icebergs to Australia, The South Pacific current brings icebergs to Chile, and the South Atlantic current brings icebergs to Africa.
 |
 |
|---|---|
We calculate the energy required to move an iceberg for a typical iceberg.
Energy required to move an iceberg = Constant * Distance moved * Velocity2
Iceberg height           =  Z               =    .5 km
Iceberg sice length      =  X               =    10 km
Density of ice           =  d               =   917 kg/m3
Density of seawater      =  D               =  1025 kg/m3
Iceberg mass             =  M  = d X2 Z     =    46 trillion kg

Iceberg distance traveled=  L               =  1000 km     (Assume ocean currents help)
Iceberg travel time      =  T               =     1 year
Iceberg speed            =  V  =  L/T       =   .03 m/s

Drag force               =  F = ½ D X Z V2  =   2.3 million Newtons
Drag energy              =  E  =  F L       =  2300 GJoules
Drag power               =  P  =  F V       =    69 kWatts
Energy cost              =  e               =    36 MJoules/$
Freshwater value per kg  =  z               = .0001 $/kg
Iceberg freshwater value =  Z  =  M z       =     5 billion $
The iceberg should move as slow as possible but it should move fast enough to reach its destination before melting. We assume a travel time of 1 year, and this determines the velocity. Presumably, measures can be taken to slow melting such as covering the iceberg with a white tarp.
 |
|---|
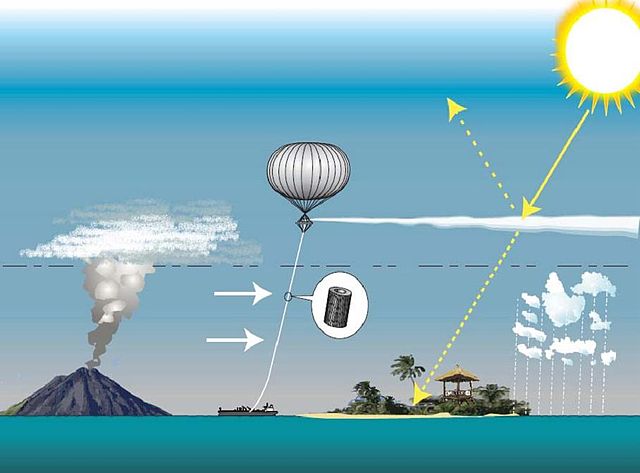
Clouds can be formed with sulfuric acid cloud seeding. Sulfur can be put into the atmosphere in the form of H2SO4, H2S, or SO2. Sulfur lasts 4 years in the atmosphere and has to be replenished. Power from the jet stream can be used to launch sulfur.
|
|
|---|---|
 |
|---|
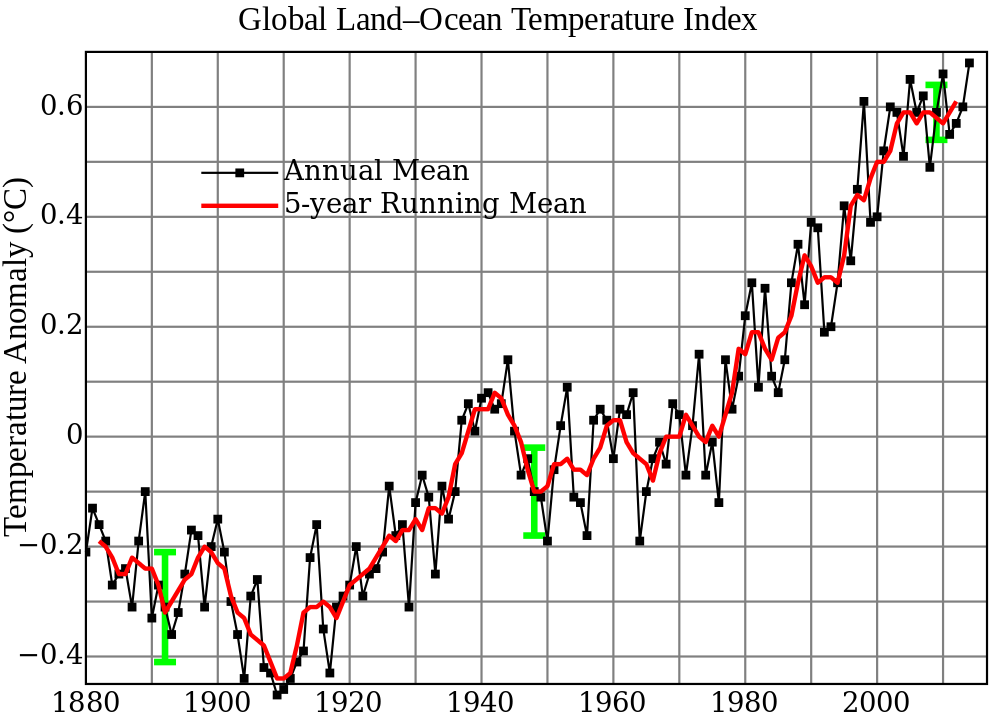
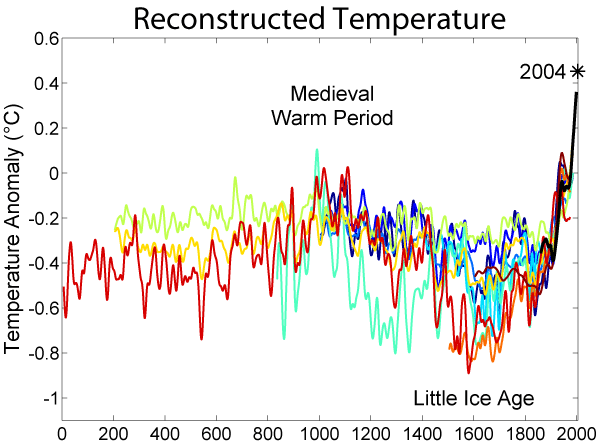
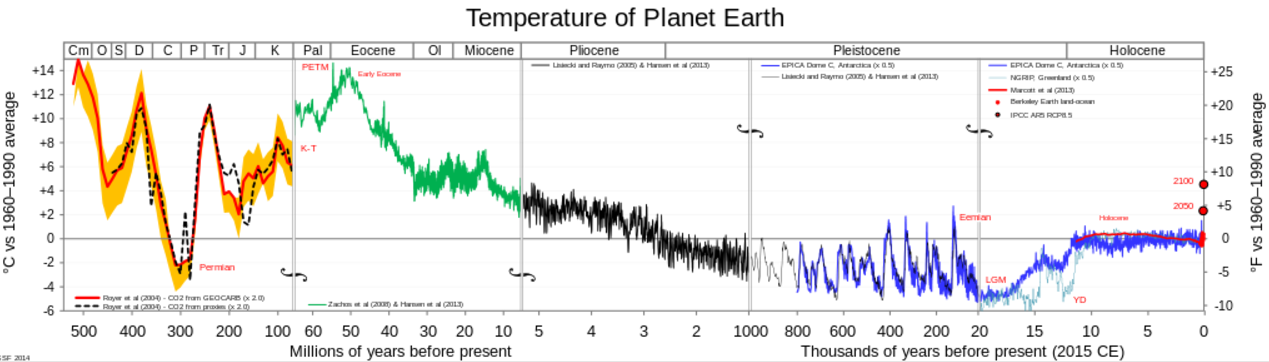
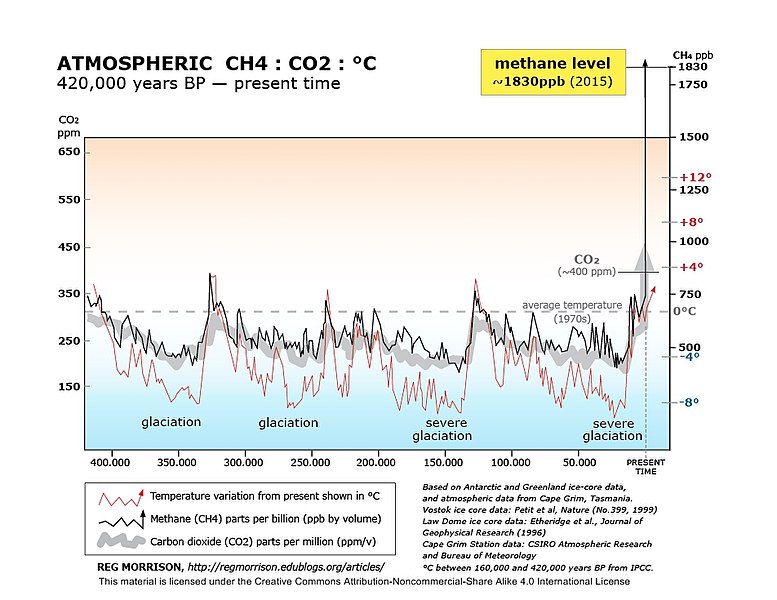
Earth mean temperature       = 288   Kelvin
Current rate of increase     =   1.7 Kelvin/century
Temperature in 1800          =   -.9 Kelvin compared to present
Temperature in 1000          =   -.5 Kelvin compared to present
 |
 |
|---|---|
 |
 |
|---|---|
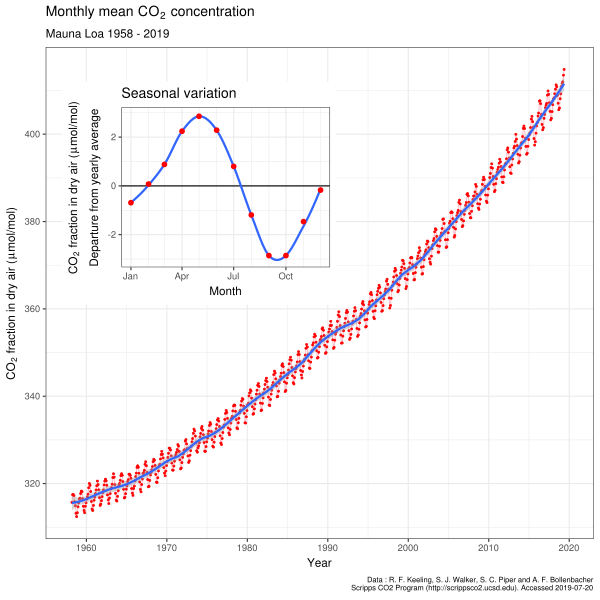
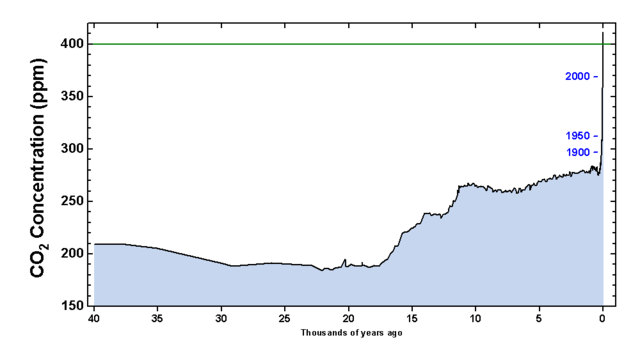
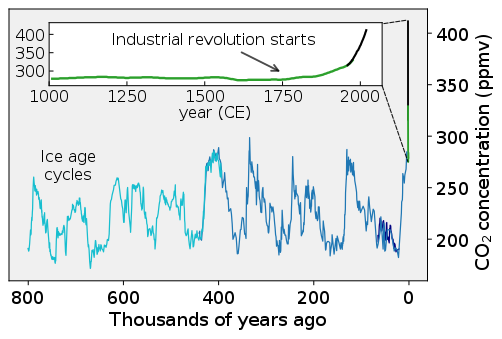
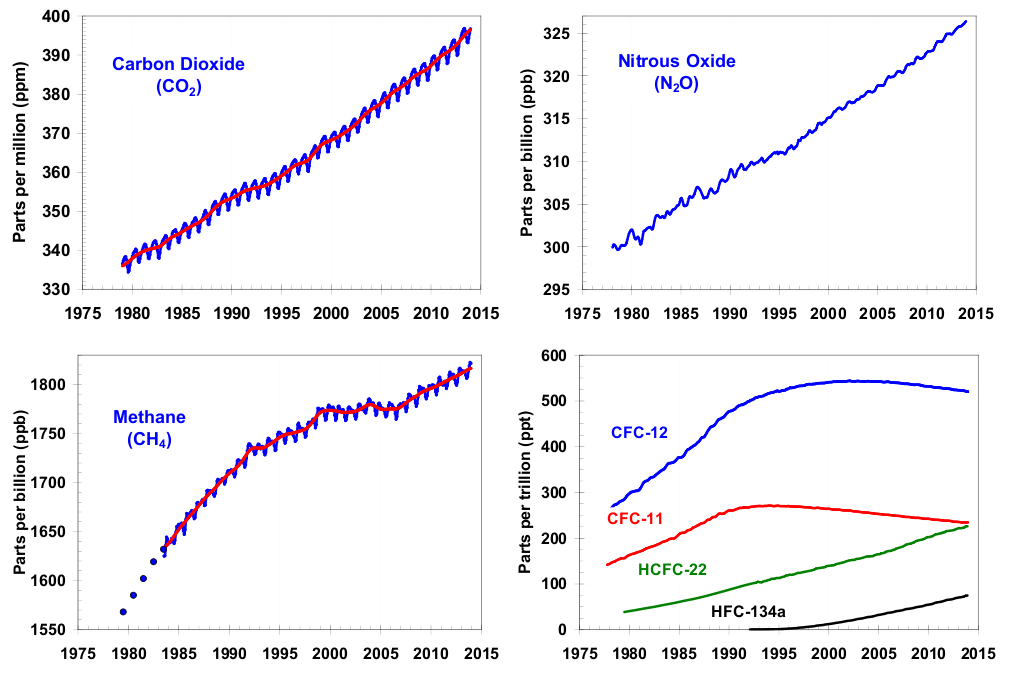
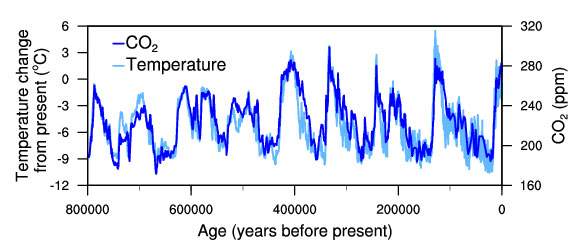
Atmosphere CO2 fraction    =  .00041
CO2 fraction in 1700       =  .00027
CO2 fraction last ice age  =  .00018             (1 million years ago)
CO2 fraction increase rate =  .000002 per year
Atmospheric carbon         =880000⋅109 kg       = 121000   tons/person
 |
 |
|---|---|
 |
 |
|---|---|
 |
|---|
 |
|---|
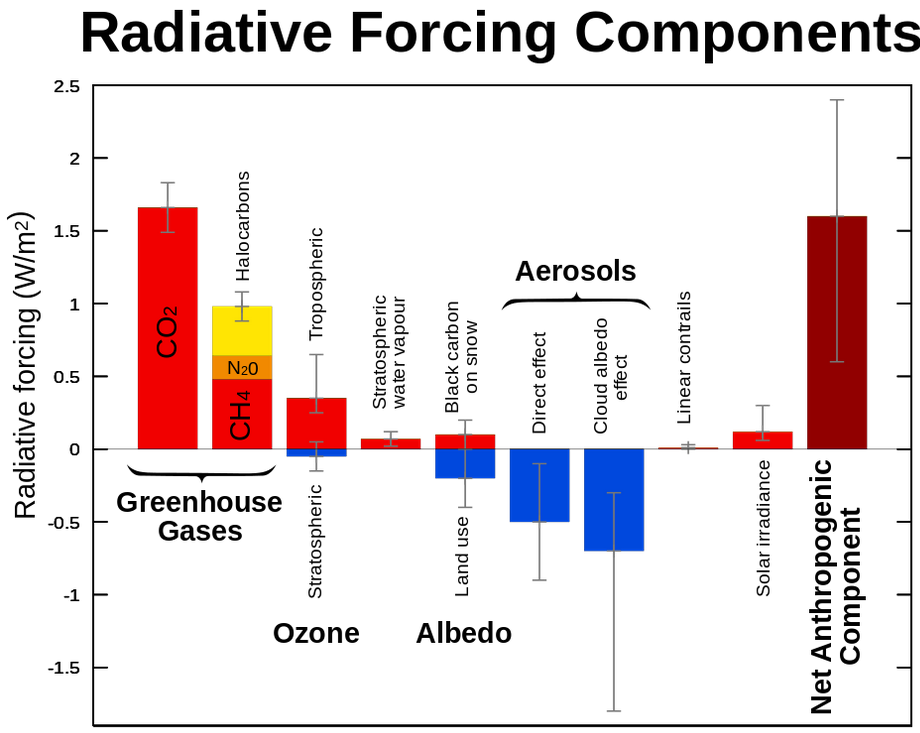
Gas        Year      Year     Contribution  Radiation  Half life
           1750      2015     to warming     change     (years)
           (ppm)     (ppm)                  (Watts/m2)
H2O                             36-72%
CO2       280       395          9-26%        1.88        60
CH4          .7       1.79       4-9%          .49        12
O3           .237      .337      3-7%          .4           .05
N2O          .270      .325                    .17       114
CCl2F2       0         .000527                 .169      100
CCl3F        0         .000235                 .061       60
CHClF2       0         .00022                  .046       12
"ppm" stands for parts per million.
 |
 |
|---|---|
 |
|---|
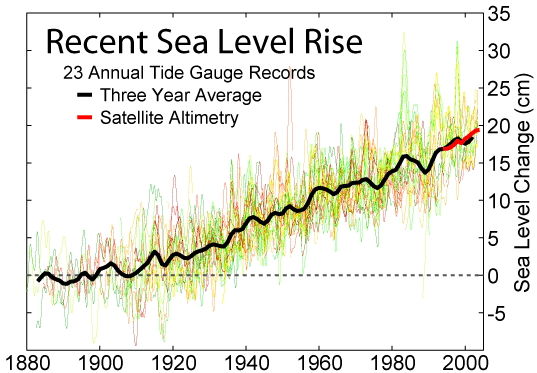
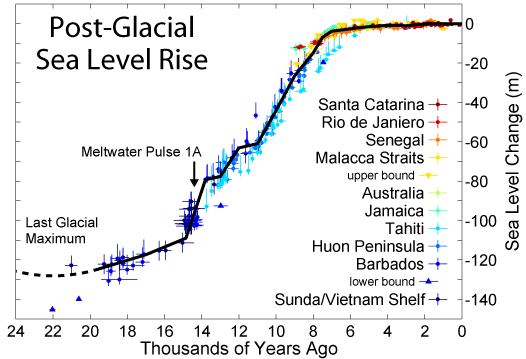
Sea level rise since 1870          =   225 mm
Sea level rise if Greenland melts  =  7200 mm
Sea level rise if Antarctica melts = 61100 mm

Total rate of sea level rise       =  2.8 mm/year     3.3
Greenland melting rate             =   .6 mm/year      .049
Antarctica melting rate            =   .2 mm/year      .026
Glacier melting rate               =   .3 mm/year     1.2
Thermal expansion rate             =   .8 mm/year     1.4

Acceleration of sea level rise     = .013 mm/year/year
Ocean heat gain                    =    5 ZJoules/year
Water:
             Volume     Change
              kkm3      km3/yr

Ocean           1338000      1200
Groundwater       23400
Ground ice          300
Lake                176.4
Mountains            40.6
Atmosphere           12.9
Swamp                11.5
River                 2.12
Biomass               1.12

Ice, Antarctica   21600      -191
Ice, Greenland     2340      -247
Ice, Canada islands  83.5     -60
Ice, Alaska          44.6     -50
Ice, Russia, NE      33.8      -2
Ice, Himalayas       23.7     -26
Ice, Svalbard        13.3      -5
Ice, Andes, South    11.7     -29
Ice, Iceland          8.7     -10
Ice, Canada, West     2.6     -14
Ice, Scandinavia       .8      -2
Ice, Swiss Alps        .3      -2
Ice, New Zealand       .3       0
Ice, Caucuses          .2      -1
Ice, Russian islands          -11
Ice, Andes, North              -4
 |
|---|
 |
.png) |
|---|---|
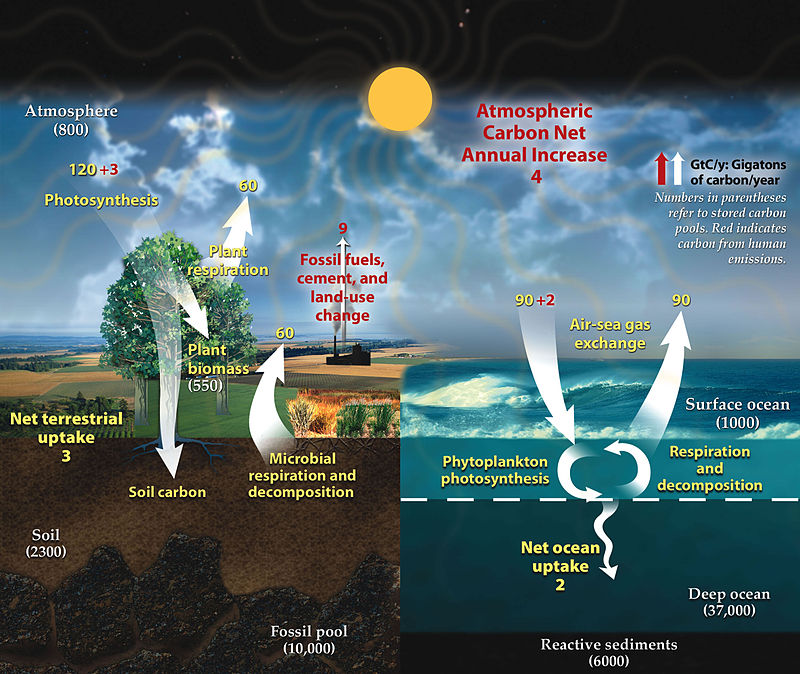
Atmosphere temperature rise=   .017 Kelvin/year      (.9 Kelvin since 1800)
Sea level rise             =  2.8   mm/year          (225 mm since 1800)
Atmosphere CO2 frac        =   .0035                 (.0027 in 1800)
Atmosphere carbon          =720     Gtons
Photosynthesis of carbon   =120     Gtons/year
Human carbon emissions     =  9     Gtons/year   = 1240   kg/person/year
Energy produced            =   .57  ZJoules/year =   78.6 GJ/person/year = 2490 Watts/person
Electricity produced       =   .067 ZJoules/year =    9.2 GJ/person/year =  292 Watts/person
Food                       =   .027 ZJoules/year =    3.7 GJ/person/year =  117 Watts/person  =  2500 Cal/person/day
Sunlight energy            =3850    ZJoules/year
Wind energy                =  2.25  ZJoules/year
Photosynthesis of biomass  =  3.00  ZJoules/year
Ocean heat gain            =  7.5   ZJoules/year
World power                = 18     TWatts       = 4500   Watts/person
Energy cost                = 16     T$/year      = 2210   $/person/year   (27.8 $/GJoule)
Population                 =  7.254 billion
Food                       =  1.58  Tkg/year     =  218   kg/person/year  (As carbs)
Earth land area            =148.9   Mkm2         =    2.0 Hectares/person
Rainfall over land         =107000  km3/year     =14800   tons/person/year
River flow                 = 37300  km3/year     = 5140   tons/person/year
Water total use            =  9700  km3/year     = 1390   tons/person/year
Water for agriculture      =  1526  km3/year     =  218   tons/person/year
Water for home use         =   776  km3/year     =  111   tons/person/year
Water desalinated          =    36  km3/year     =    5   tons/person/year
Rainfall increase per year =   .20  mm/year          (Rainfall is increasing with time)
The above table can be used to convert various quantities, such as:
Energy of hydrocarbon food                      17  MJoules/kg
Agricultural water required to produce food   1000  litres/kg       (in the form of carbohydrates)
Electricity cost                               100  $/MWh           =  2.78⋅10-8 $/Joule
Agricultural water required to produce food   1000  litres/kg       (in the form of carbohydrates)
World average                               722000  people per kg3 of water used
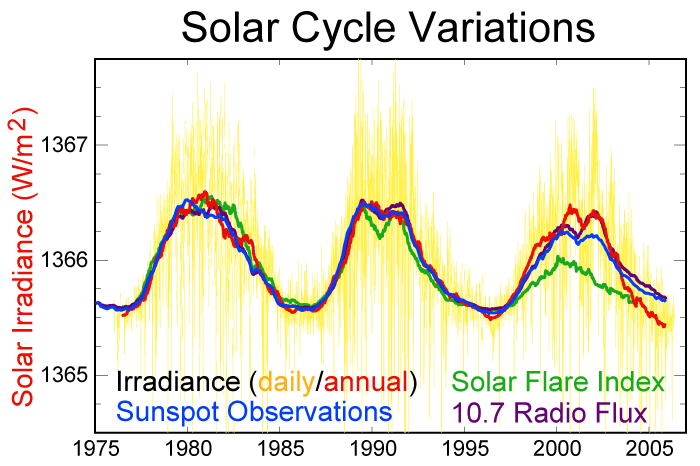
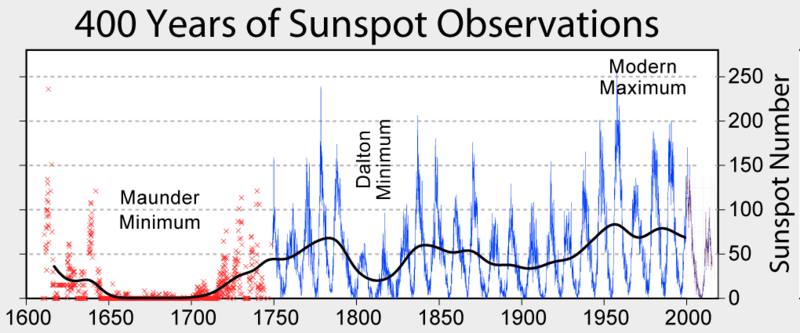
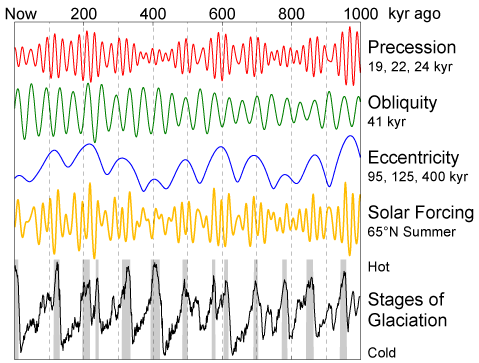
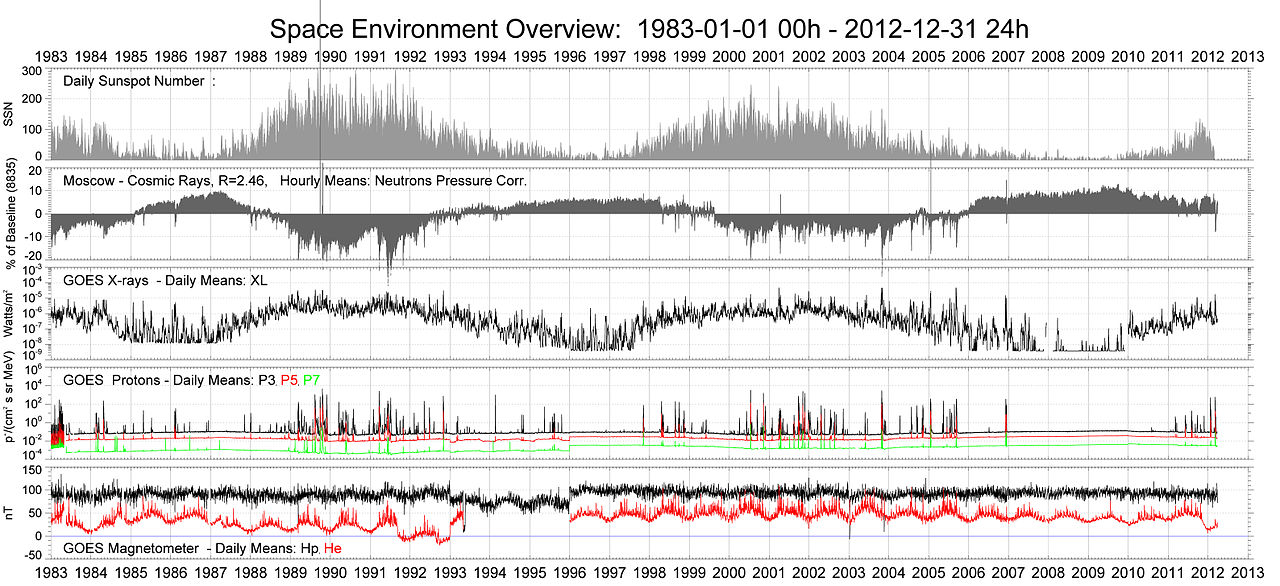
Sunspot number correlates with solar intensity.
 |
 |
|---|---|
Solar intensity has long-term variations and these impact climate. The sun is presently dimming.
 |
|---|
 |
|---|
 |
 |
|---|---|
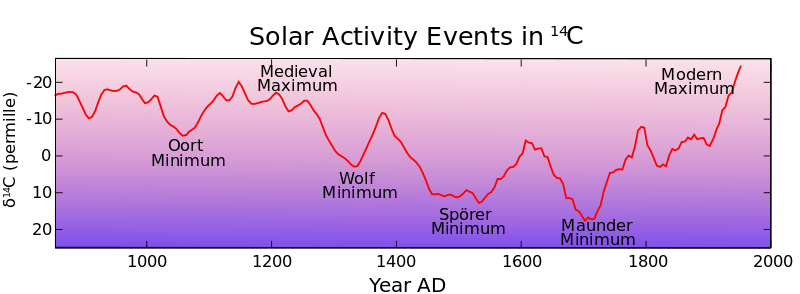
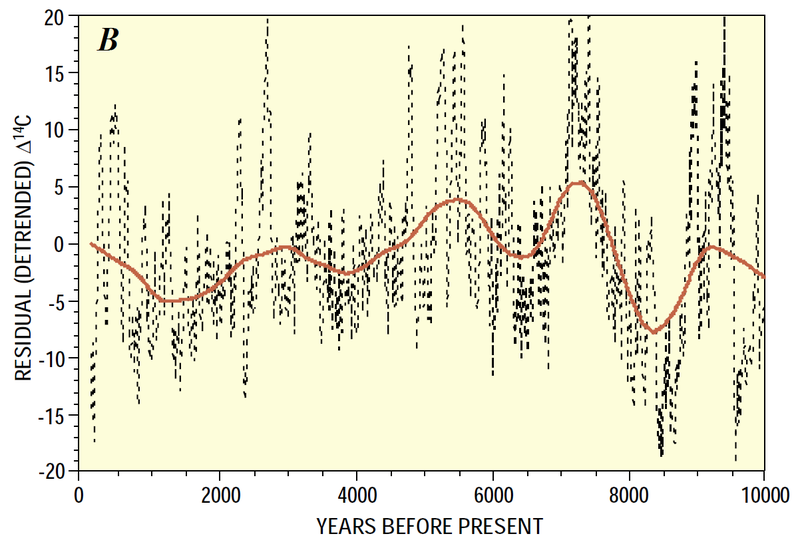
Carbon-14 is a proxy for solar intensity.
Sunspots impact cosmic rays, and cosmic rays have an impact on climate by forming clouds.
Sun intensity average             =  1366.0 Watts/meter2
Sun intensity at sunspot maximum  =  1367.0 Watts/meter2
Sun intensity at sunspot minimum  =  1365.1 Watts/meter2
 |
|---|
|
|---|
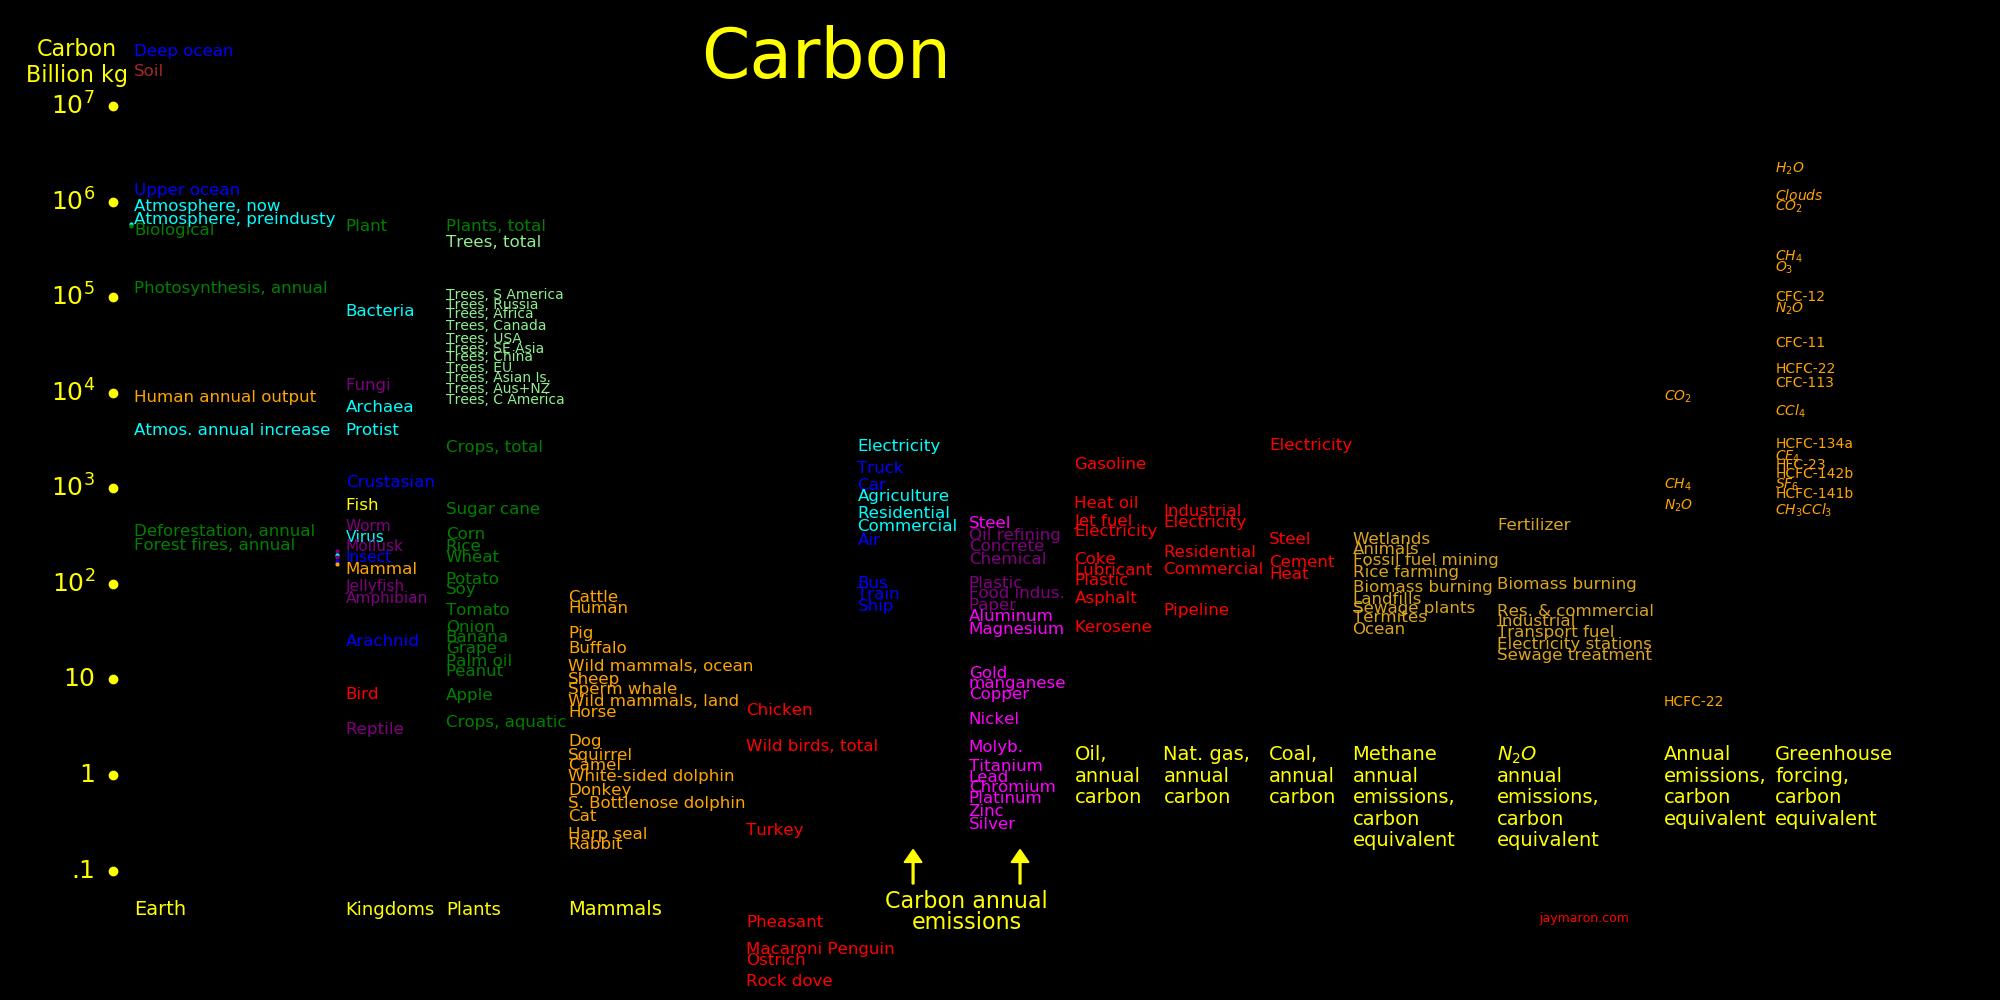
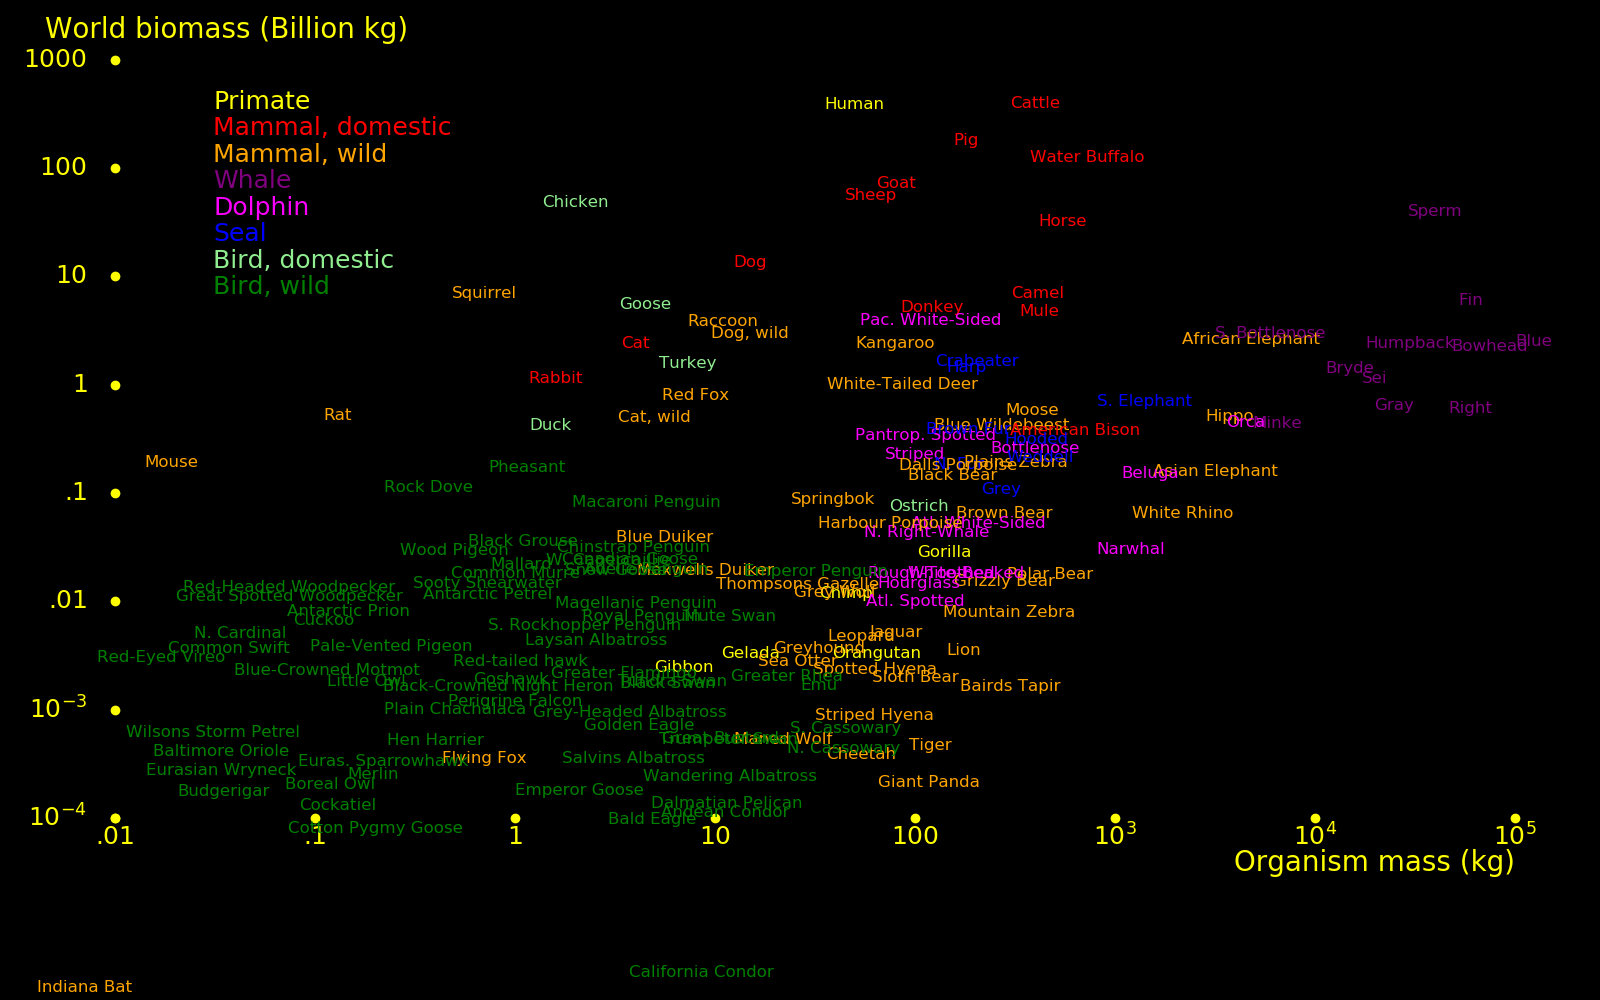
Animals are 1/6 carbon and trees are 1/2 carbon.
 |
|---|
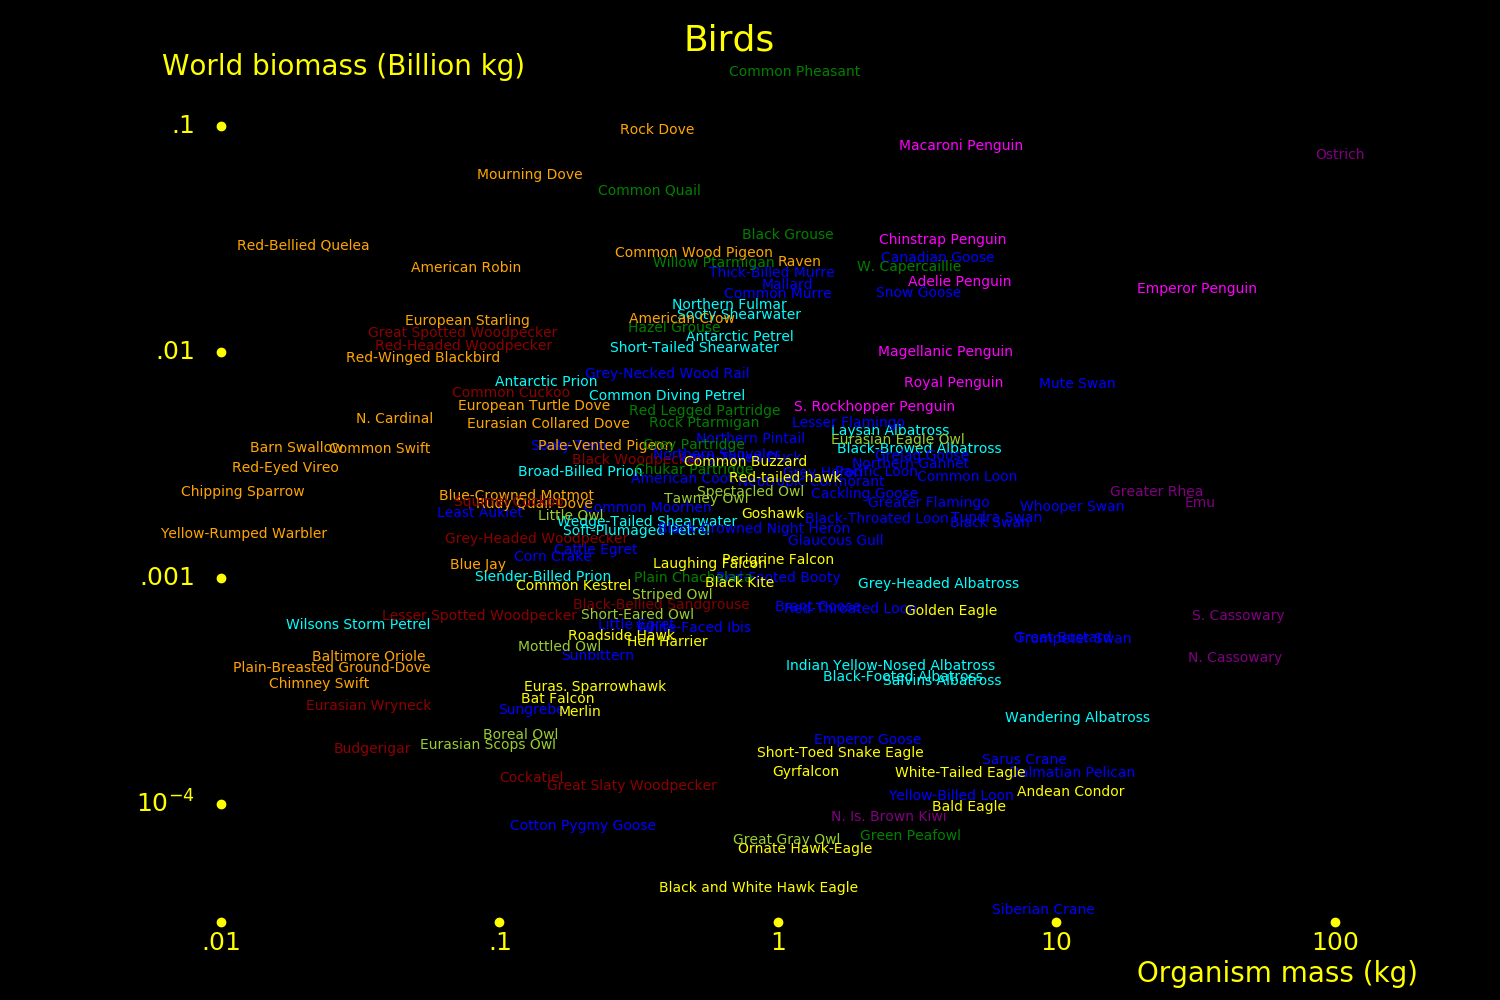
For mammals and birds, domestic biomass far exceeds wild biomass.
 |
|---|
 |
|---|
Primary energy for manufacturing is dominated by steel, concrete, hydrogen, and plastic.
 |
|---|
Producing biomass requires fertilizer, water, and sunlight. The chief fertilizer elements are nitrogen, potassium, and phosphorus. Nitrogen usually comes in the form of urea and it is produced from methane via:
Methane CH4 → Hydrogen H2 → Ammonia NH3 → Urea CO(NH2)2
45% of hydrogen production becomes ammonia and 80% of ammonia becomes fertilizer.
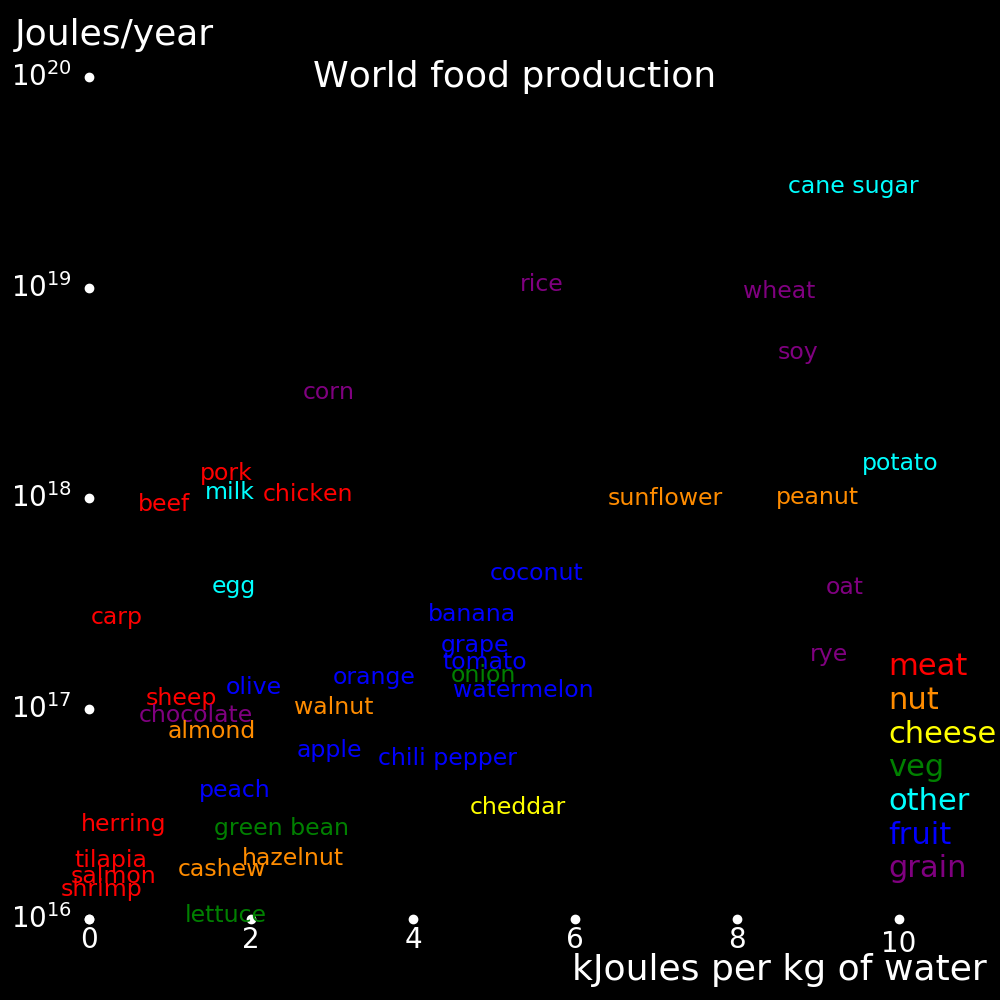
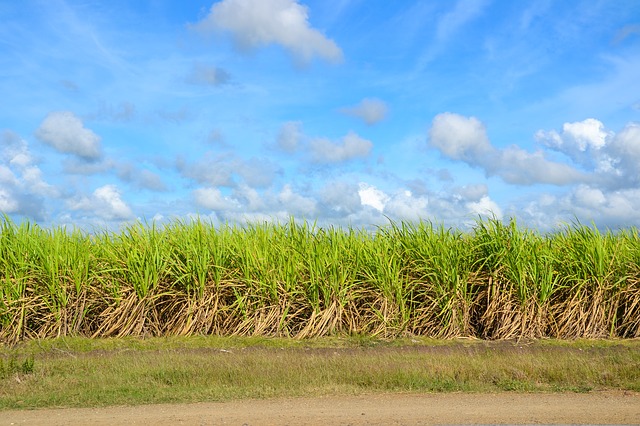
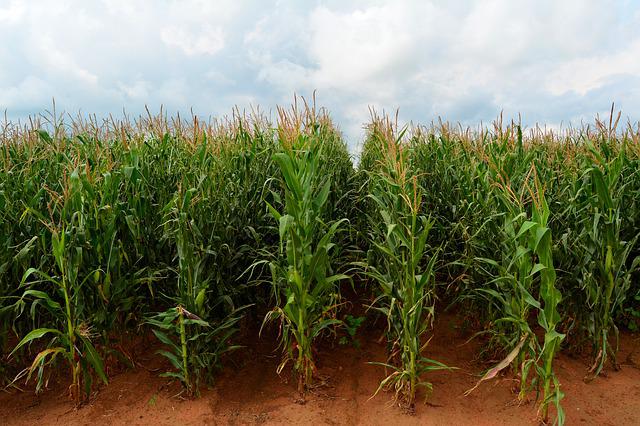
Fertilizer begets crop biomass, which begets animal biomass. Crop biomass is dominated by sugar cane, rice, wheat, soy, and maize. Animal biomass is dominated by humans, cattle, and pigs.
 |
|---|
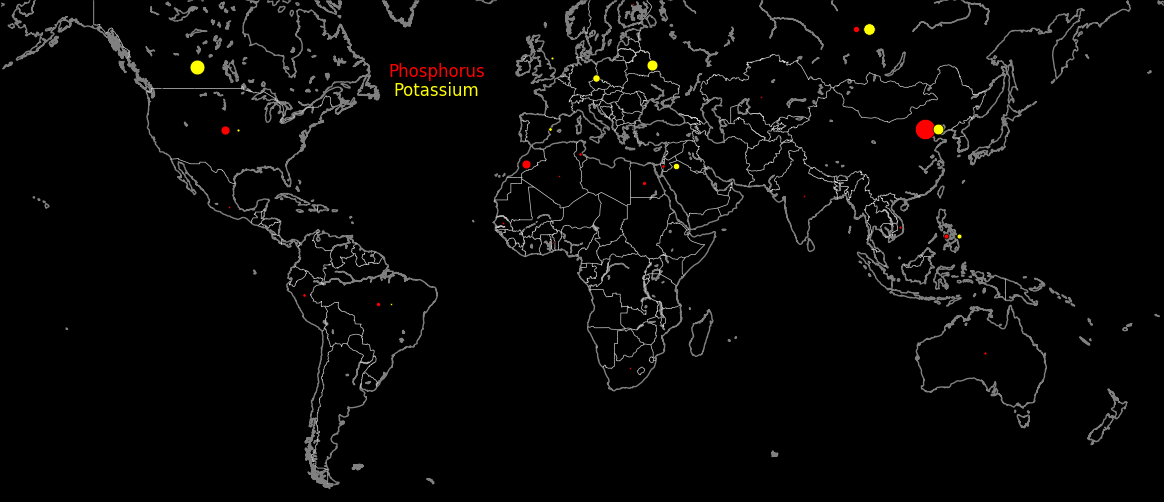
The chief fertilizer elements are nitrogen, phosphorus, and potassium. Phosphorus is a concern because reserves are limited.
World production and reserves for fertilizer elements are:
           World   Fertilizer  Reserves  Carbon  Carbon    Cost  Element   Usual form
          Bkg/year  Bkg/year     Bkg     kg/kg   Bkg/year   B$    $/kg

Nitrogen    158      30.0    Infinite     1.09    32.7     170      5.66   Urea                     CO(NH2)2
Phosphorus   22      11.0         260     1.30    14.3     616     56      Monoammonium phosphate   NH4H2PO4
Potassium    34      11.0        3240     2.64    29.0     130     11.8    Potassium chloride       KCl
"Carbon kg/kg" is the carbon emitted to produce 1 kg of element.
Data: Insurance Information Institute, averaged over 2014-2018.
Masses are for carbon. Data: globalfiredata.org
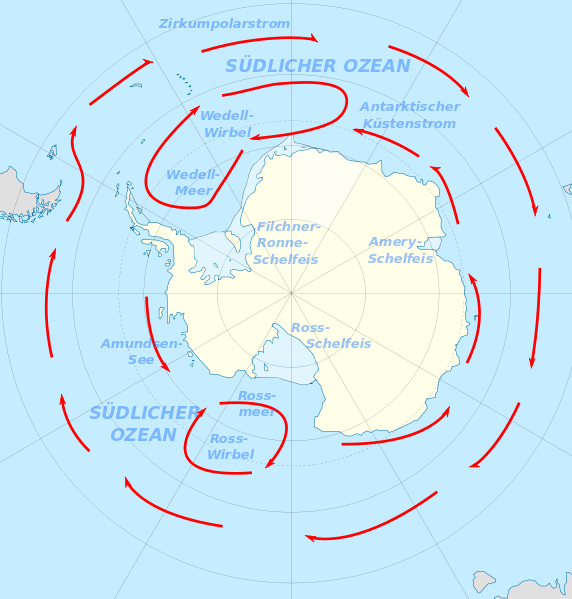
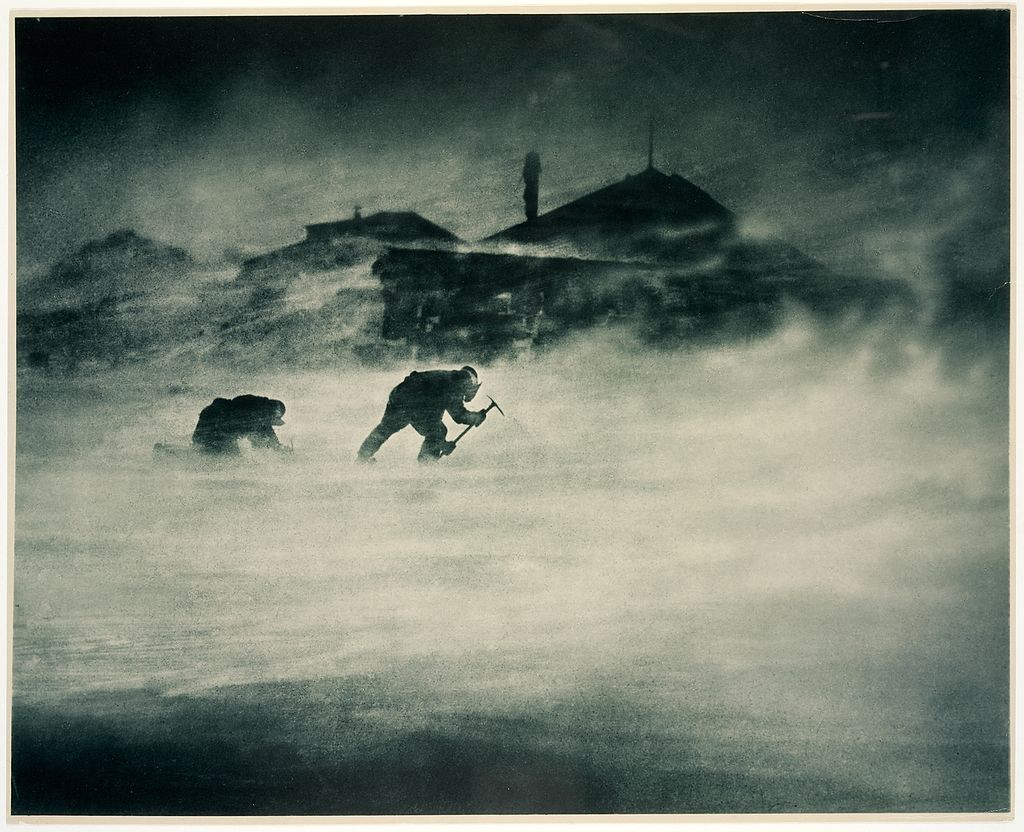
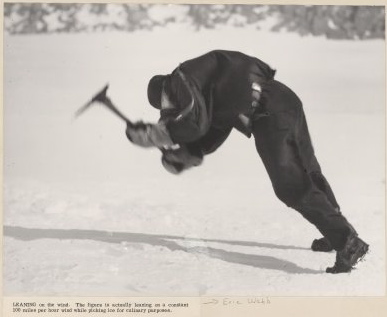
The windiest place on the planet is Cape Denison, Antarctica, with a year-round
average wind speed of 25 m/s. Wind turbine power scales as windspeed cubed.
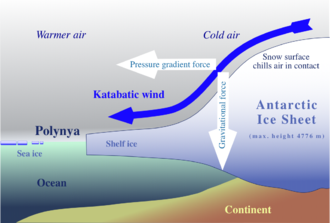
Katabatic winds continuously blow from the
Antarctic center to the coast, gaining energy as they flow downward. The wind
at Cape Denison always blows in the same direction, simplifying
construction.
A 10 km array of wind turbines at Cape Denison can generate 5 GWatts.
The power can be used to produce metals. Ore is brought to Antarctica and
extracted with electricity. Suitable candidates include titanium,
magnesium, and aluminum.
The Earth can be made more reflective by cutting down arctic trees, because
snow is more reflective than trees. On the other hand, trees make the Earth
more reflective by capturing carbon and decreasing greenhouse heating. The
question is if it's better to leave the tree up or to cut it down, and it turns
out it's better to cut it down.
Trees are less reflective than grass or crops, so cutting down trees in tropical territory
and replacing them with farms makes the Earth more reflective.
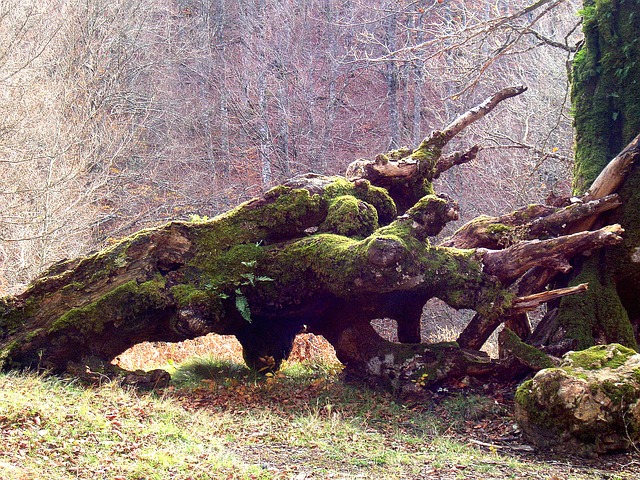
An old forest is carbon neutral. Live trees capture carbon and dead trees give it back to the
atmosphere. A young forest is carbon negative. The carbon in an old forest can be sequestered by
turning the trees into building material, and a young forest can be planted in its place.
A good choice for a young forest is bamboo, because bamboo trunks are close
together. A young bamboo forest achieves full coverage and maximum growth
rate. Also, bamboo is easily harvested because it's light in side branches.
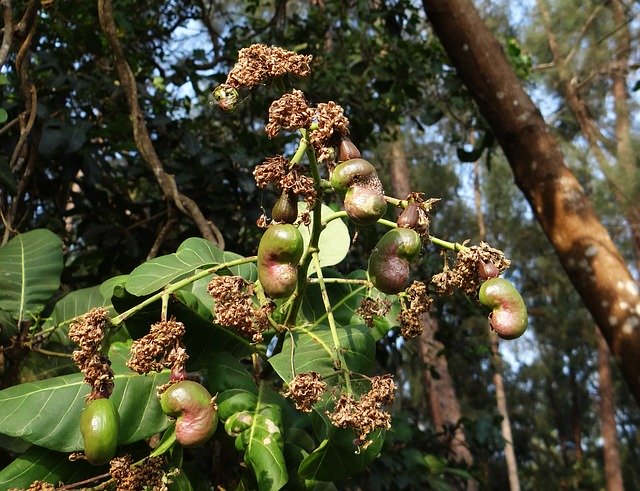
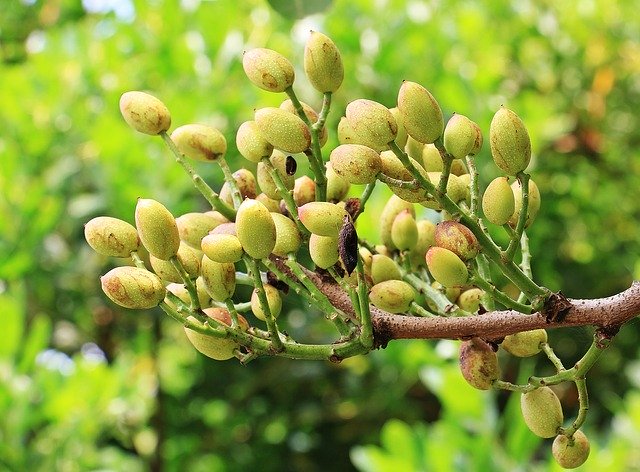
Another choice is trees that yield nuts or fruit.
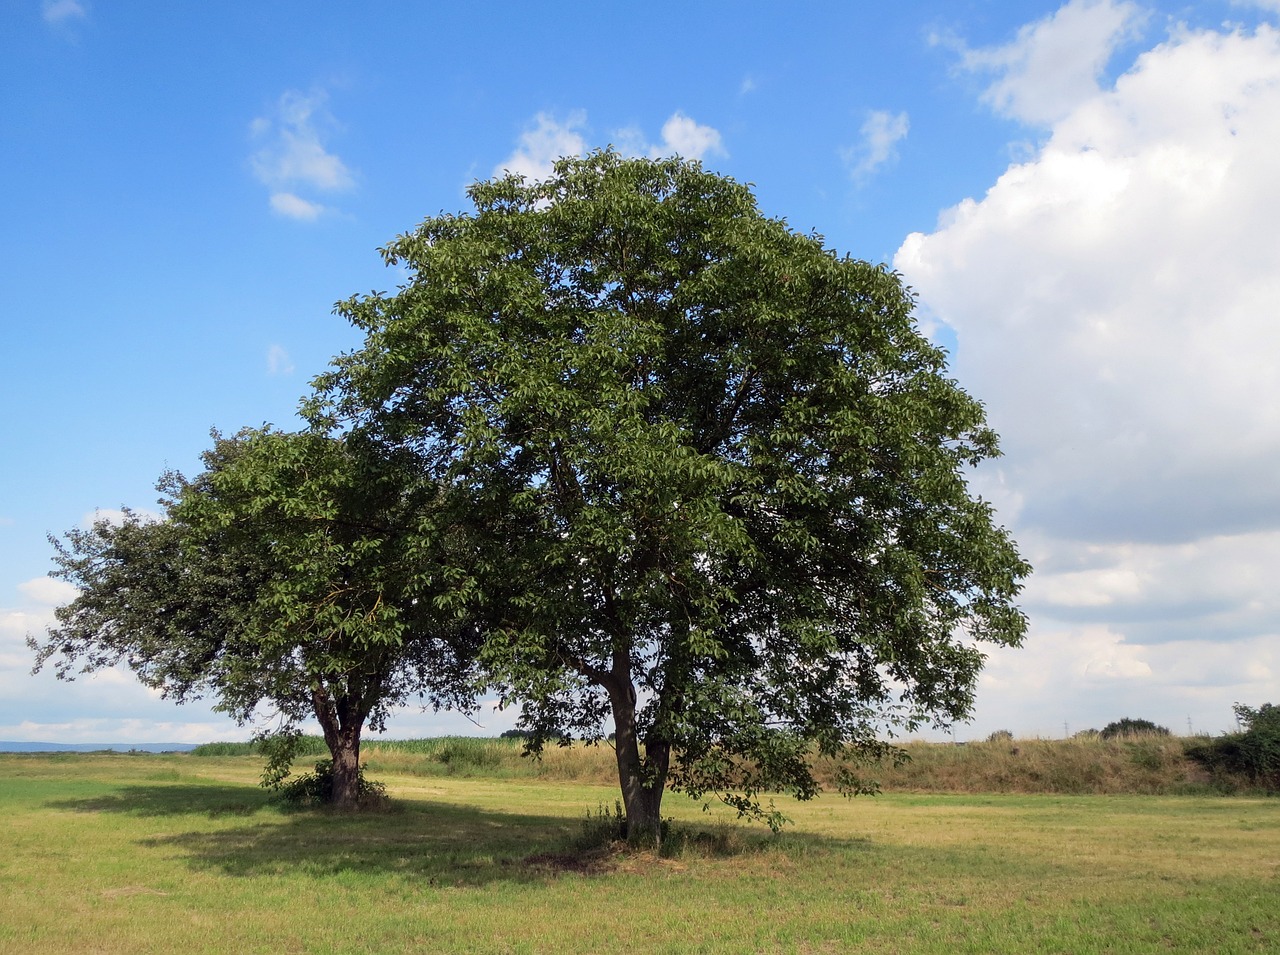
Another choice is trees that yield valuable lumber.
Instead of trees, you can use land for sugar cane, which yields carbon-neutral ethanol fuel.
You can also farm.
Trees should be planted near water, because trees need lots of water. Ideally,
they should cast shade over the water, because trees are more reflective than
water.
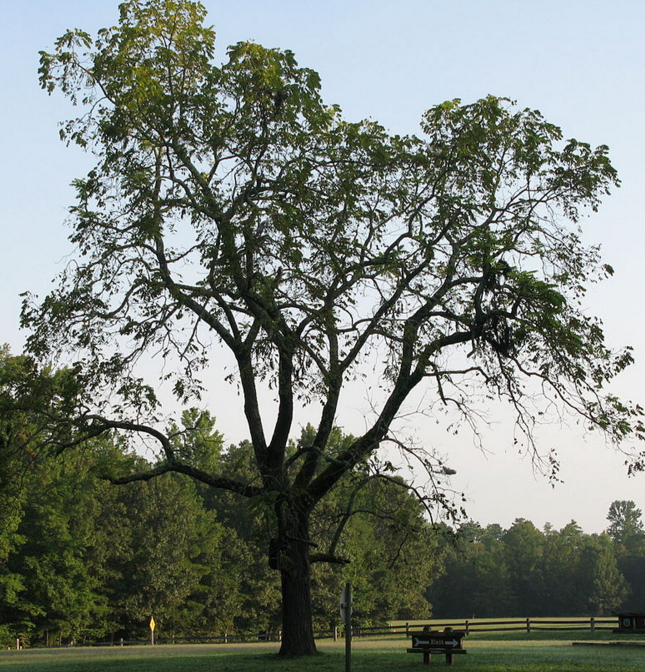
Humans add carbon to the atmosphere at a rate of 550 kg/person/year, and planting a tree captures
100 kg/year. For a typical tree,
In cities, trees with taproots should be used. Trees with flat roots destroy
structures.
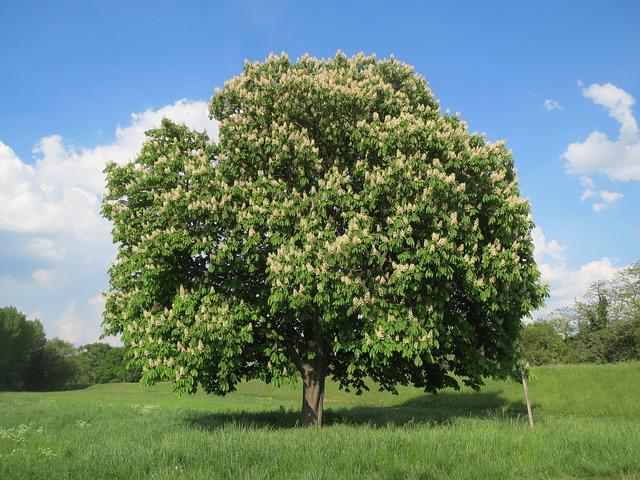
A tree should have the following properties:
*) Wide and tall trunk
Tap roots: White Oak, Hickory, Walnut, Conifer, Pine, Hornbeam, Pine
60% of a tree's mass is in the trunk.
Tree volume can be estimated from height and trunk diameter. For a typical large tree,
"Carbon Bkg/year" is the carbon emitted by the world due to the fertilizer element.
"Cost" is the the carbon emitted by the world due to the fertilizer element.
"Element $/kg" is the price of the element per kg.
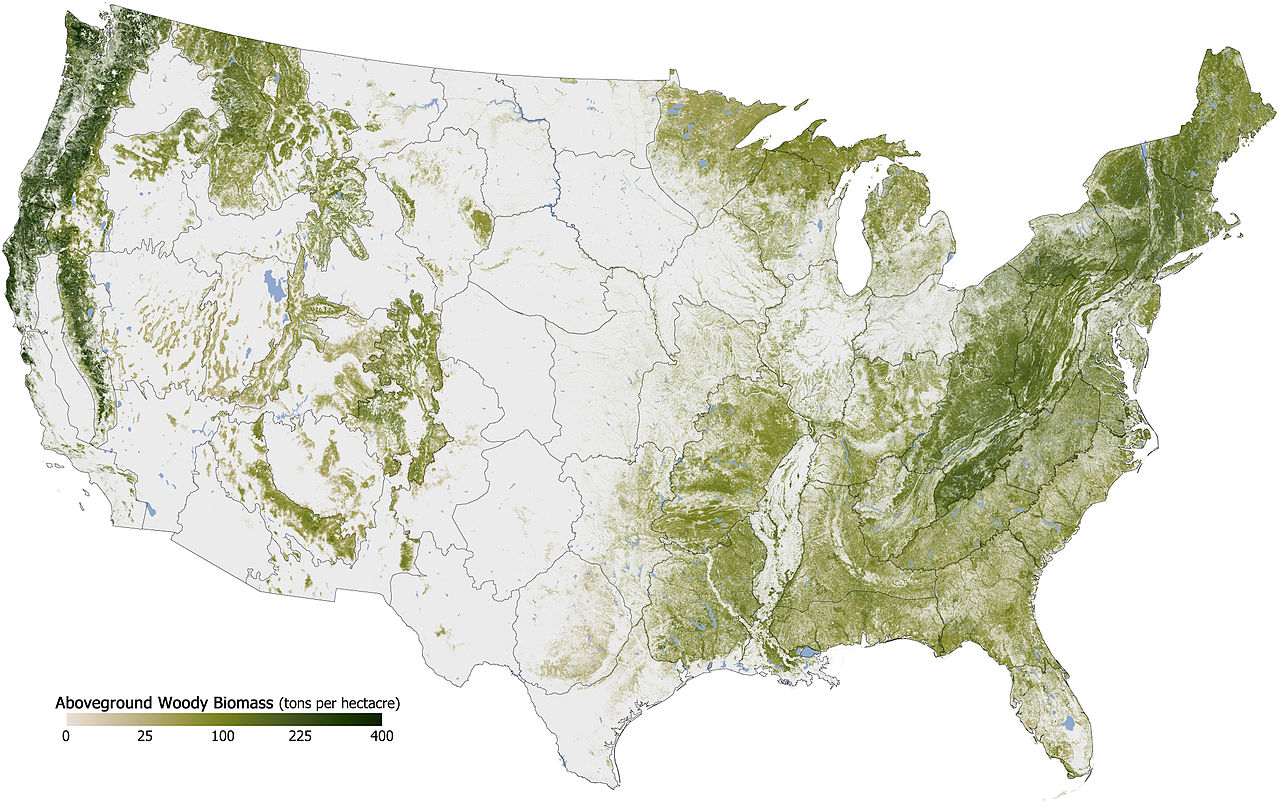
          World fraction  Forest  Deforestation  Fires
                %          Bkg       Bkg/yr      Bkg/yr

South America   22        96000        400         50
Russia          21        92000          ?        100
Africa          17        73000        240         50
Canada          12.6      55000          0         50
USA              7.9      34800          0         15
S.E. Asia        5.9      26000       -120         10
China            5.3      23300       -170         20
E.U.             4.1      18000        -40          3
Asian Islands    3.6      15800         30         10
Australia + NZ   3.2      14100          ?         20
C. America       2.7      11900         60          5

World            1000    440000        350        250
Wind turbine height  =  H  =  100 meters
Coastline length     =  L  =   10 km
Wind speed           =  V  =   25 meters/second
Efficiency           =  f  =  1/4
Air density          =  D  =  1.22 km/meter3
Power                =  P  =  f D H L V3  =  4.8 GWatts
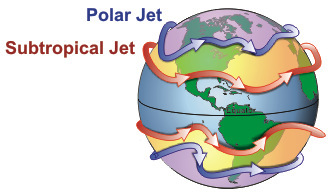
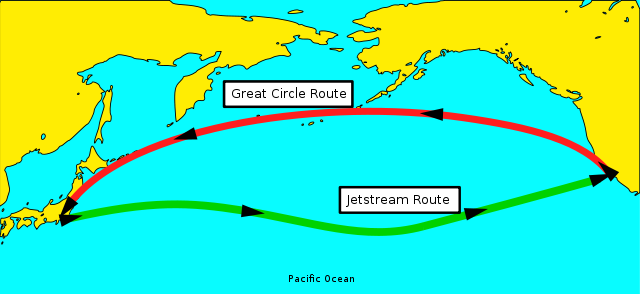
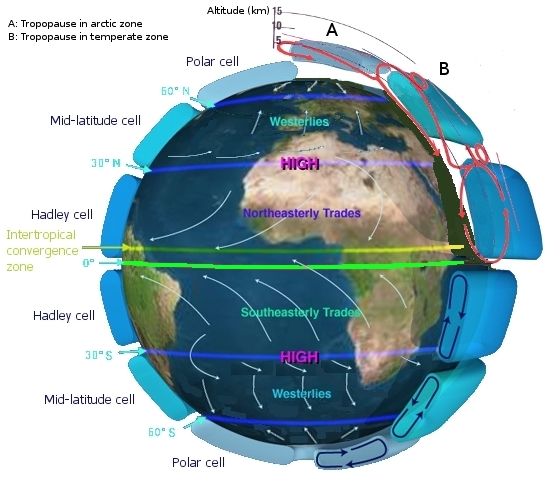
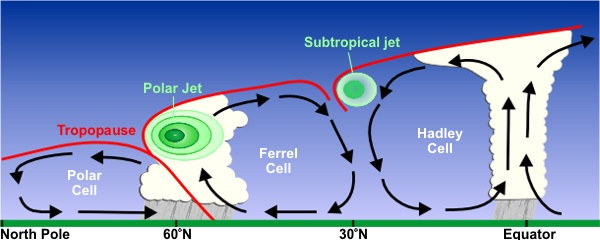
Tropical jet stream lower altitude =   7 km
Tropical jet stream upper altitude =  12 km
Tropical jet stream latitude       =  30 degrees
Tropical jet stream typical speed  =  45 m/s
Polar jet stream lower altitude    =  10 km
Polar jet stream upper altitude    =  16 km
Polar jet stream lattitude         =  60 degrees
Polar jet stream typical speed     =  35 m/s
Jet stream width                   = 200 km
Jet stream vertical thickness      =   5 km
Jet stream year of discovery       =1933       (Wiley Post)
Estimated harnessable power        = 100 TW


California population = 39.1 million people
California area =424 thousand km2
California rainfall = .56 meters Averaged over state
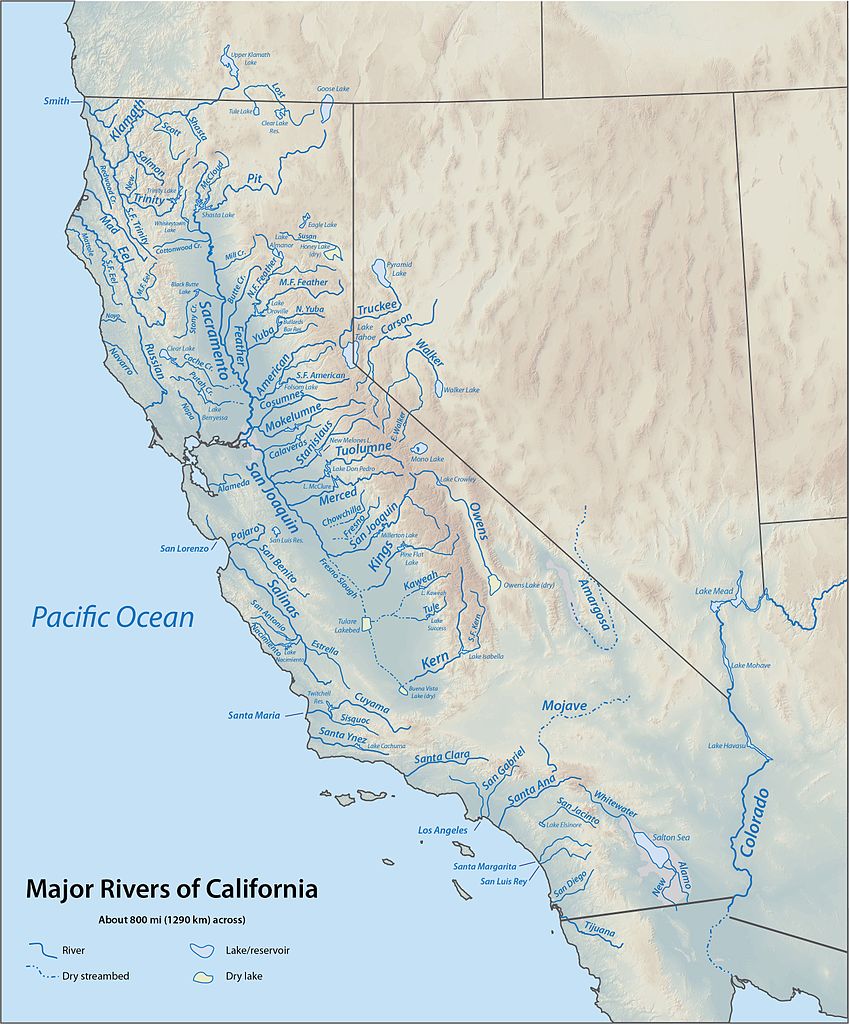
Sacramento River = 25.1 km3/year
Klamath River = 15.3 km3/year
Eel River = 9.5 km3/year
San Joaquin River = 4.6 km3/year
Smith River = 3.34 km3/year
Russian River = 2.02 km3/year
Mad River = 1.39 km3/year
Navarro River = .44 km3/year
Santa Ana River = .41 km3/year
Salinas River = .38 km3/year
California river total = 87 km3/year
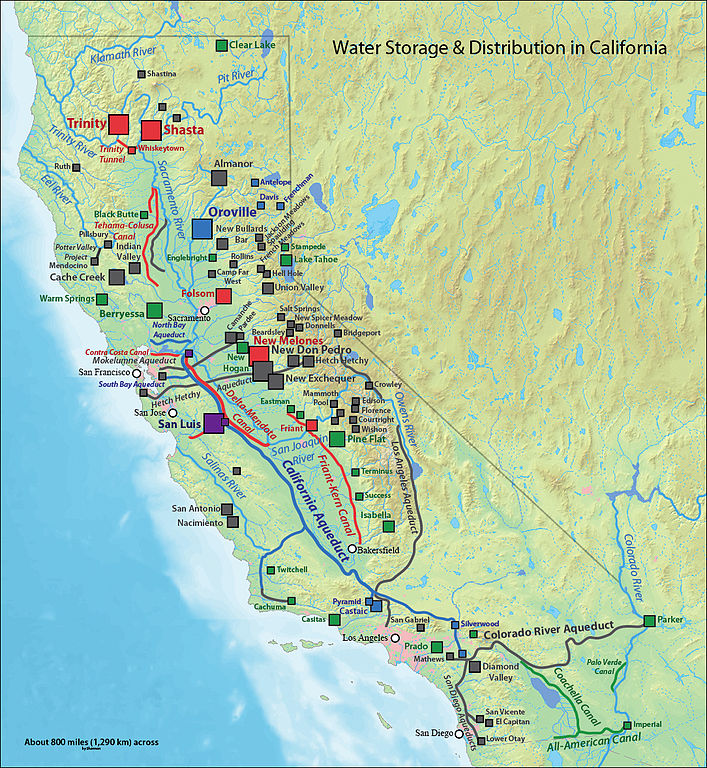
California rainfall =237 km3/year
Water from Colorado Riv. = .51 km3/year Water from outside the state
Groundwater overdraft = 15 km3/year Groundwater not replaced
Water total use =108 km3/year Households and agricultural
Water for agricultural = 41.9 km3/year
Water for households = 10.9 km3/year
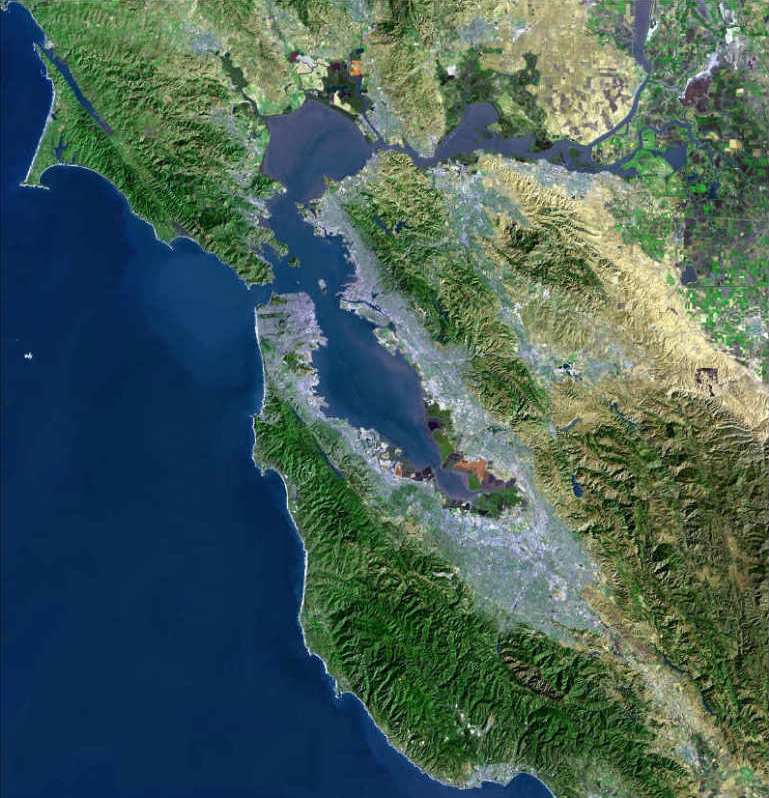
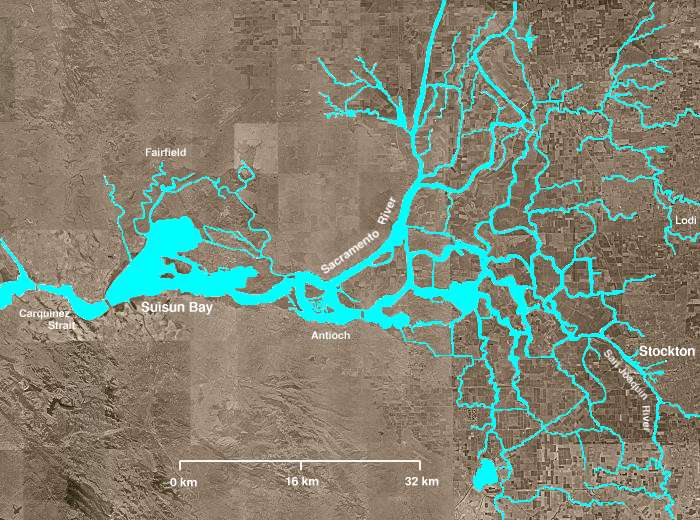
Water flowing thru delta = 20.3 km3/year Water flowing into SF Bay
Water exported from delta= 13.3 km3/year San Francisco Bay Delta
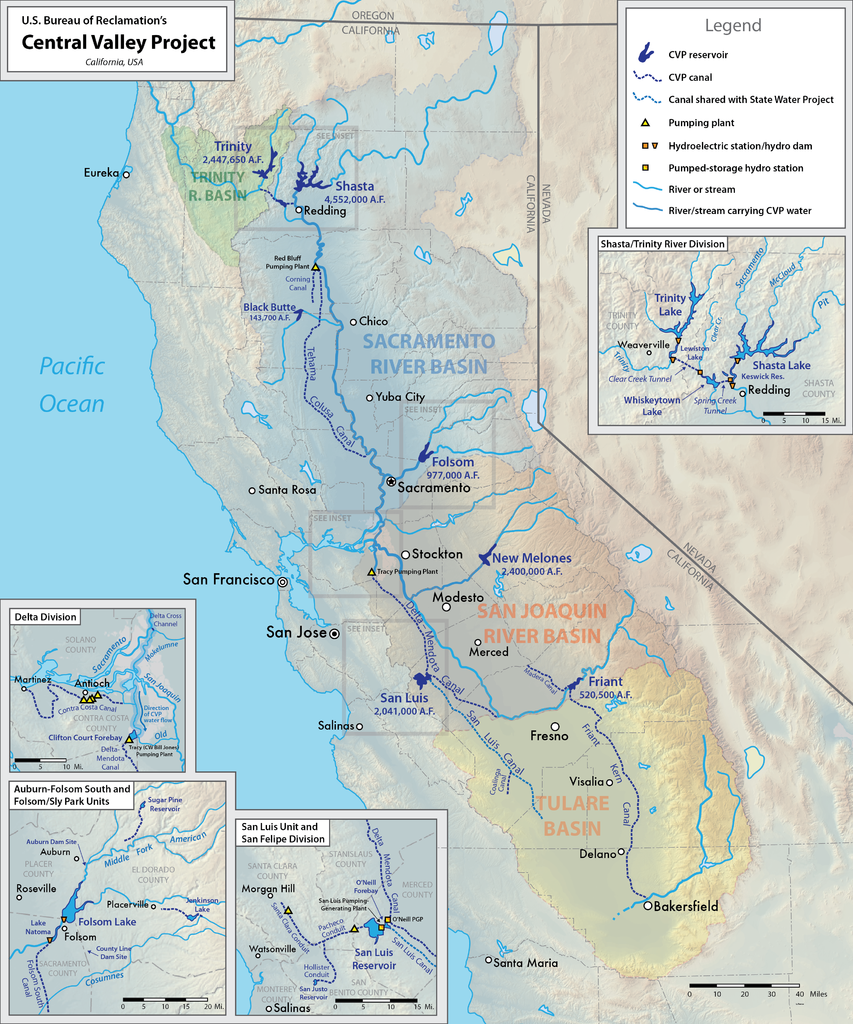
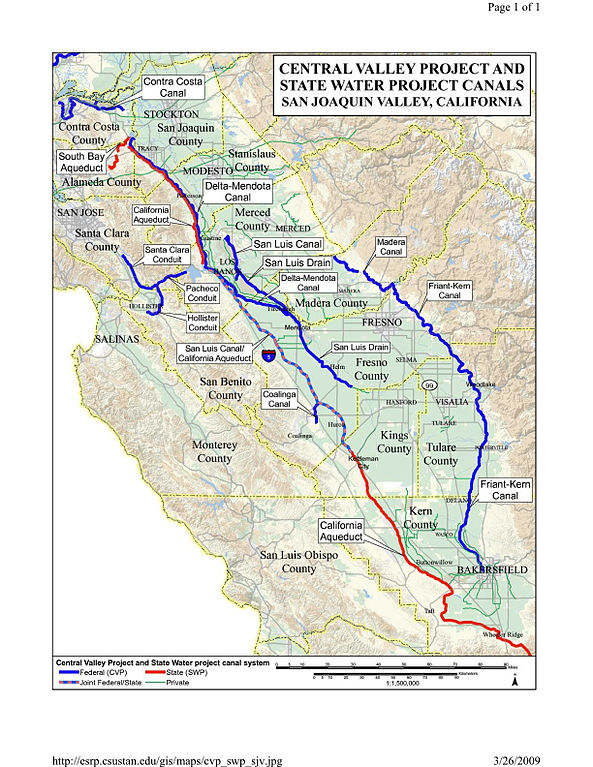
Aqueduct: Central Valley = 8.9 km3/year Central Valley Project
Aqueduct: State Water = 3.5 km3/year State Water Project
Aqueduct: Los Angeles = .49 km3/year
Aqueduct: Mokelumne = .45 km3/year
Aqueduct: Hetch Hetchy = .33 km3/year
Aqueduct: North Bay = .05 km3/year
Household total water use=504 m3/house/year
Household indoor use =237 m3/house/year
Household landscaping use=267 m3/house/year
Ave Max Height Vol Area Year
(GW) (GW) (m) (km^3) (km^2) completed
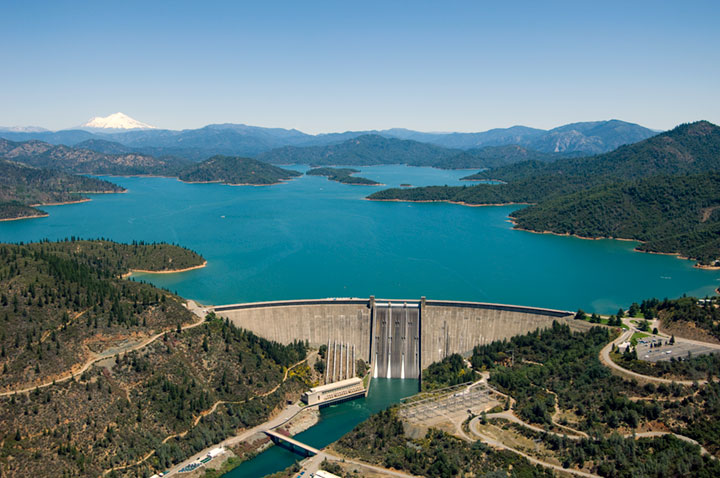
Shasta Dam .206 .676 100 5.6 120 1945
Oroville Dam .170 .819 187 4.4 64 1968
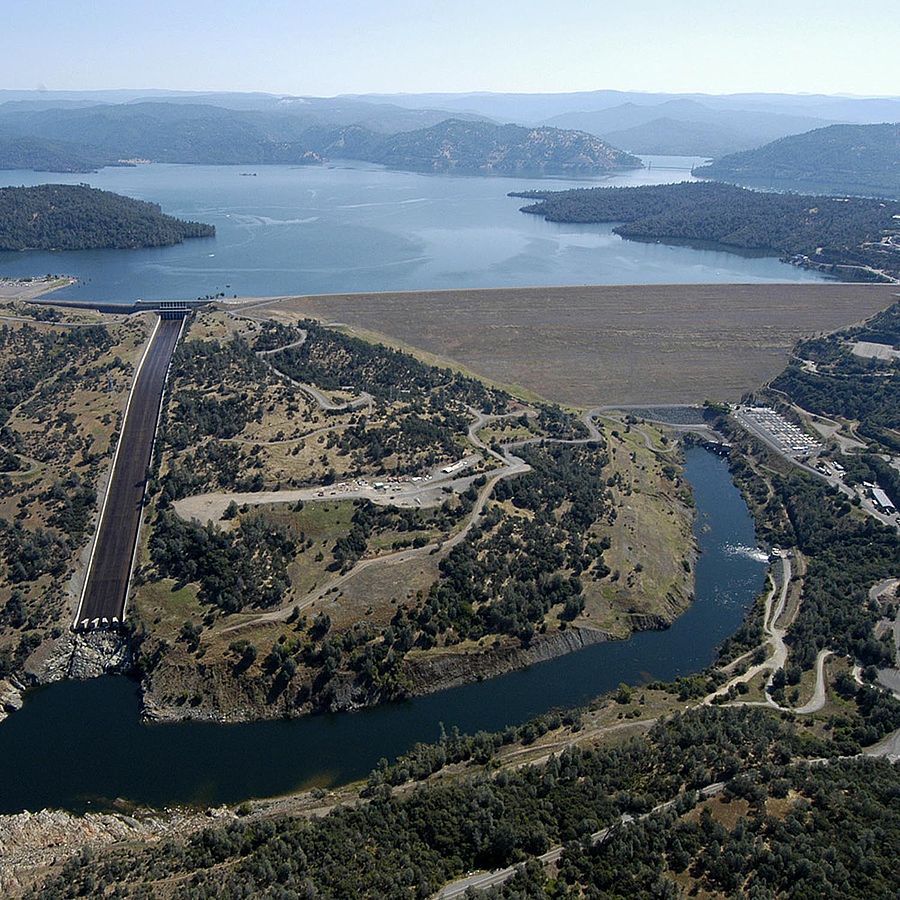
New Bullards .150 .340 398 1.2 20 1969
Folsom Dam .079 .199 91 1.4 48 1956
New Don Pedro .071 .203 170 2.5 52 1971
Parker Dam .052 .120 .8 78 1938
Pine Flat Dam .048 .165 129 1.2 24 1954
Trinity Dam .041 .140 130 3.0 72 1962
New Melones .037 .300 150 3.0 51 1979
New Exchequer .036 .094 133 1.3 29 1967
Canyon Dam .018 .041 109 1.6 114 1927
Monticello .007 .012 2.0 84 1957
San Luis Dam .424 2.5 51 1967
Oroville dam height         =  235 meters             Tallest dam in the USA
Lake Oroville lake volume   = 4.36 km3
Lake Oroville lake area     =   63 km2
Lake Oroville catchment area=10200 km2     Area of land that drains into Lake Oroville
Drainage basin = 6.4e5 km2
Farmland supported = 14000 km2
Flow rate = 637 m3/s (Very little makes it to the ocean)
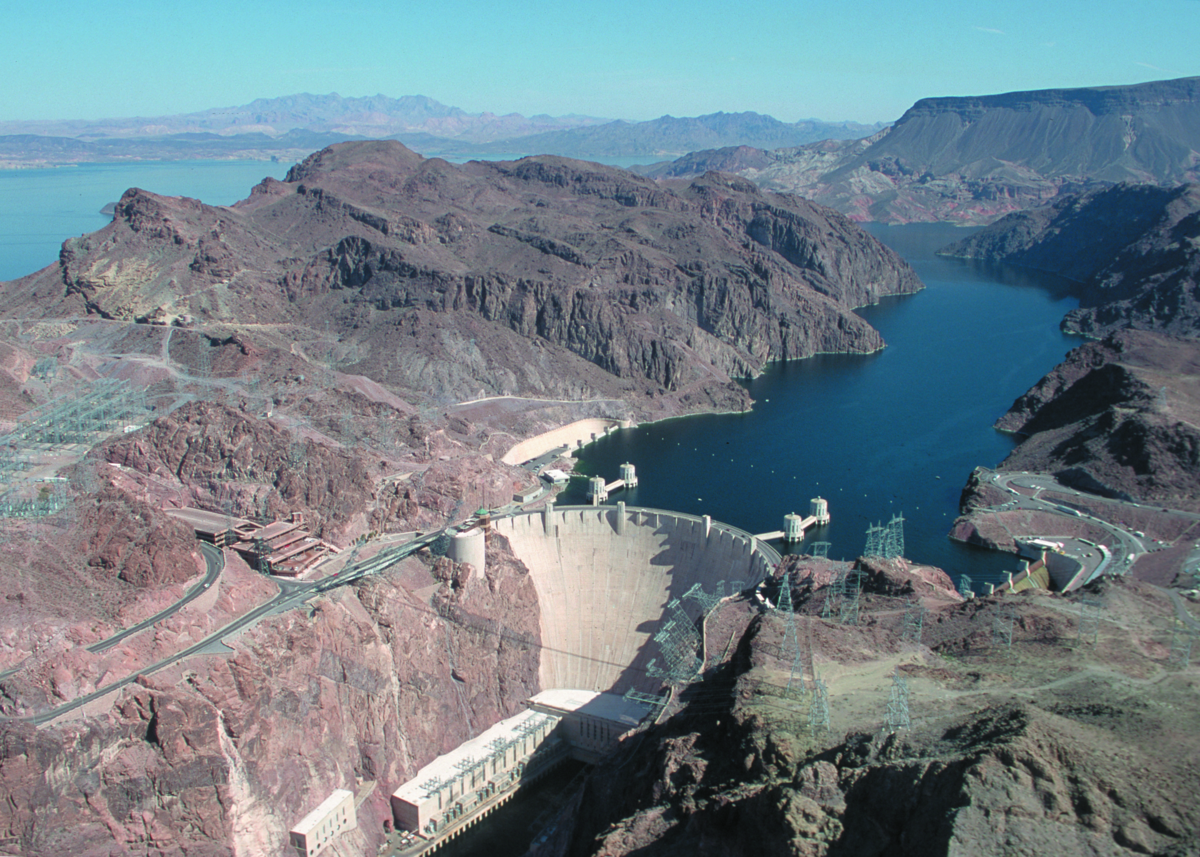
Hoover dam salt flow = 9e6 tons salt/year
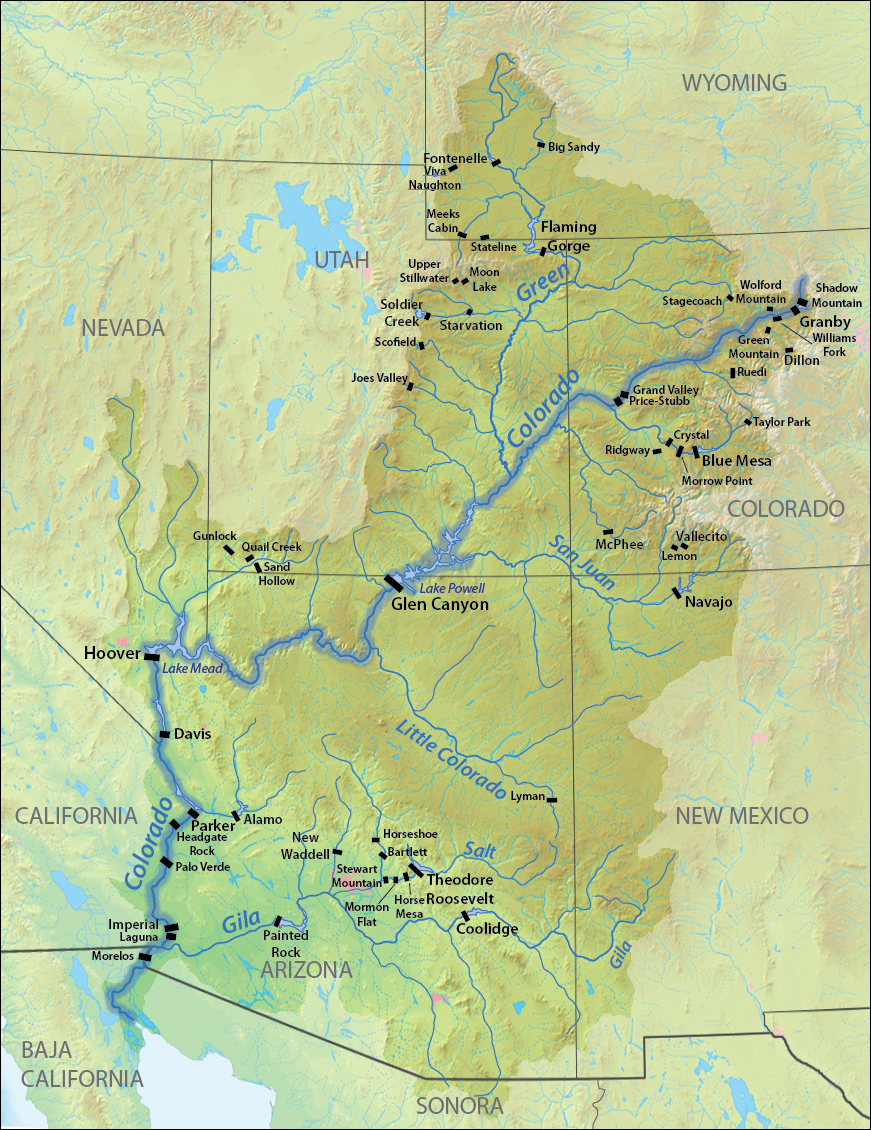
Total river flow = 20.3 km3/year
Upper basin allotment = 9.22 km3/year (Utah, Wyoming, Colorado)
Lower basin allotment = 9.22 km3/year (California, Arizona, Nevada, New Mexico)
Mexico allotment = 1.84 km3/year
California fraction = .267 (Fraction of river allotted to California)
Colorado fraction = .235
Arizona fraction = .170
Utah fraction = .104
Wyoming fraction = .064
New Mexico fraction = .051
Nevada fraction = .018
Mexico fraction = .091
Green River = 171 m3/s (Tributary)
Gunnison River = 73 m3/s (Tributary)
San Juan River = 62 m3/s (Tributary)
Dolores River = 18 m3/s (Tributary)
Little Colorado River = 12 m3/s (Tributary)
Ave Max Height Vol Area Year
(GW) (GW) (m) (km^3) (km^2) completed
Hoover Dam .48 2.08 180 35.2 640 1936
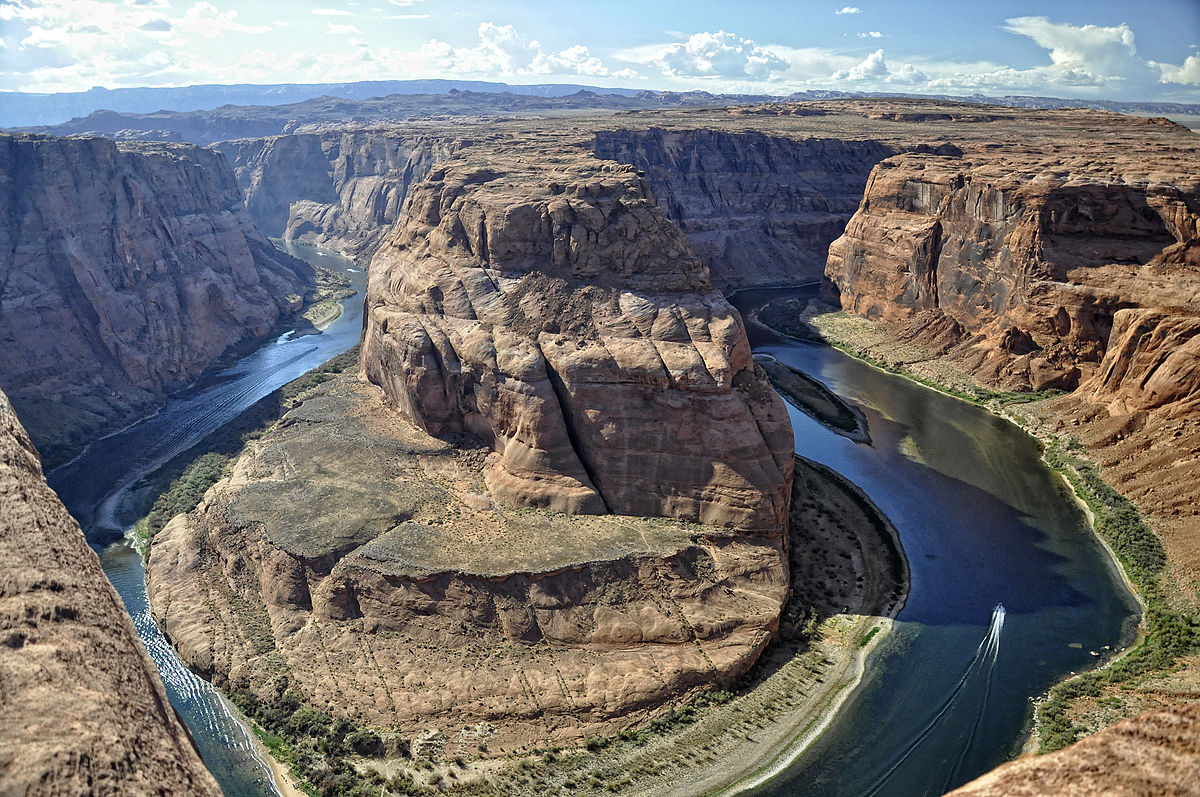
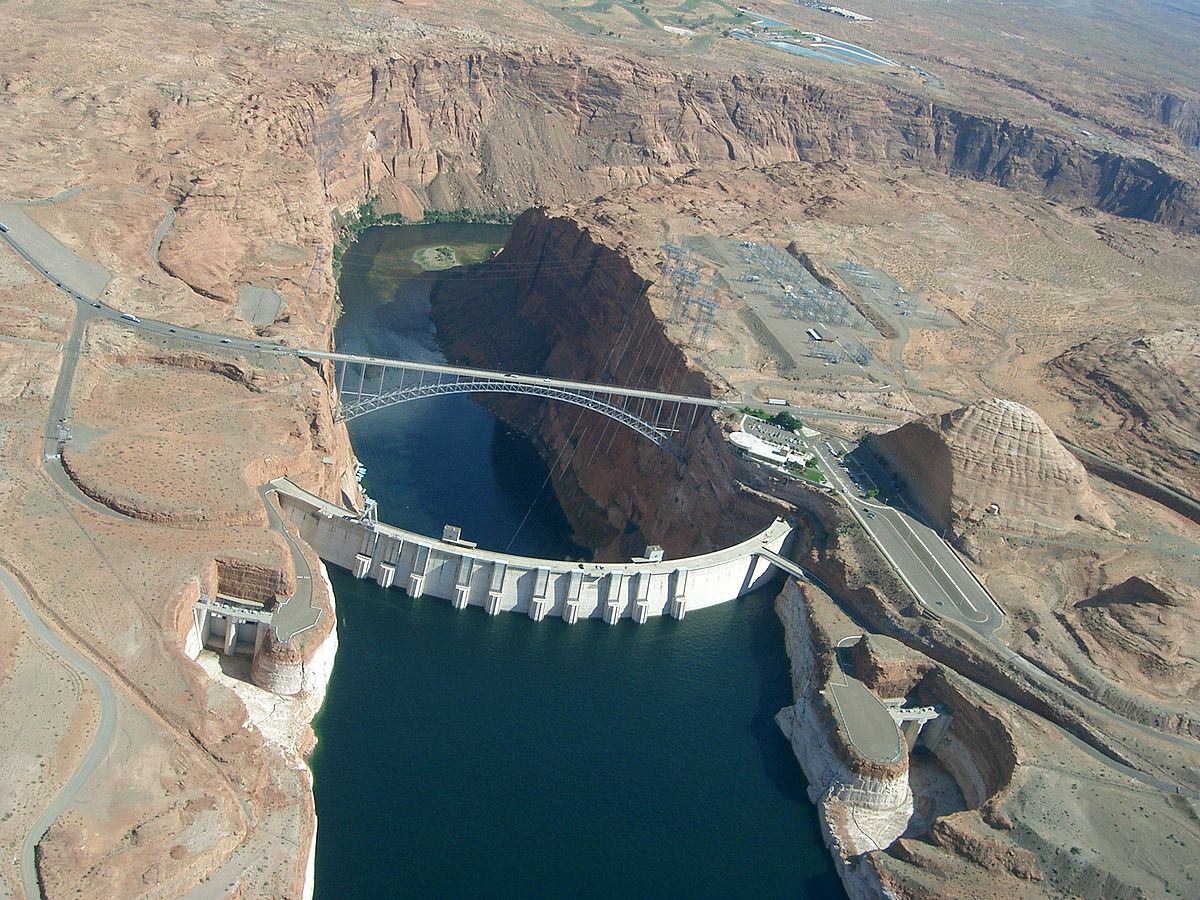
Glen Canyon .40 1.30 160 32.3 653 1966
Davis Dam .131 .255 41 .2 107 1951
Parker Dam .052 .120 .8 78 1938
Flaming Gorge .039 .153 120 4.7 170 1964
Morrow Point .033 .173 126 .1 3 1968
Blue Mesa .023 .086 101 1.2 37 1966
Horse Mesa .015 .129 .3 11 1927
Navajo Dam .015 .032 116 2.1 63 1962
Ave: Average power generation in GWatts
Max: Max power capacity in GWatts
Height: Height of waterfall for power generation
Vol: Volume of reservoir
Area: Area of reservoir
California is the most water-stressed state in terms of tons of
rain per person.
          People    Land   People    Rain  Tons of
          (10^6)   (10^6    /Ha      (m)    rain
                    km^2)                  /person

World     7254    148.9     .49      .990   20.2
USA        321.4    9.53    .33      .715   21.7
Mexico     121.7    1.96    .61      .758   12.2
Montana      1.03  .381     .27      .390  144
Wyoming       .59  .253     .23      .328  141
Nebraska     1.90  .200     .95      .599   63.1
New Mexico   2.09  .315     .66      .371   56.0
Idaho        1.65  .216     .76      .481   54.7
Kansas       2.91  .213    1.37      .733   53.5
Oregon       4.03  .255    1.58      .695   44.0
Oklahoma     3.91  .181    2.16      .927   43.9
Iowa         3.12  .146    2.14      .864   40.4
Missouri     6.08  .181    3.36     1.071   31.9
Washington   7.17  .185    3.88      .976   25.2
Wisconsin    5.77  .170    3.39      .829   24.5
Nevada       2.89  .286    1.01      .241   23.9
Utah         3.00  .220    1.36      .310   22.8
Colorado     5.46  .270    2.02      .405   20.0
Texas       27.47  .696    3.95      .734   18.6
Arizona      6.83  .295    2.32      .345   14.9
California  39.14  .424    9.23      .563    6.1
World population            =  7.25 billion people
Atmosphere carbon increase  =  4000 billion kg/year  =  550 kg/person/year
Tree carbon capture per area=     1 kg/meter2/year
Tree area                   =   100 meters2
Tree carbon capture rate    =   100 kg/year
*) Fast-growing
*) No obnoxious emissions like cottonwood seeds.
*) Taproot (if near buildings)
Heart roots: Red Oak, Sycamore
Flat roots: Evergeen, Bamboo, Willow, Poplar, Maple, Cottonwood, Redwood, Ash
                  Tree mass fraction
Transport roots         .15
Fine roots              .05
Trunk                   .60
Branches                .15
Leaves                  .05
Height         = H      =  30 meters
Diameter       = R      =   1 meters          Measured 1.5 meters above the ground
Volume         = V ∼ .25 π H R2
Wood density   = D      = 600 kg/meter2       Density can vary from 300 to 1100 kg/m3
Tree mass      = M = DV =3500 kg
Carbon fraction= f      =  .5
Carbon mass    = m = fM =1800 kg
![]()
© Jason Maron, all rights reserved.