

|
|
|
|
|
|
|---|---|---|---|---|---|
|
|
 |
 |
 |
|---|---|---|
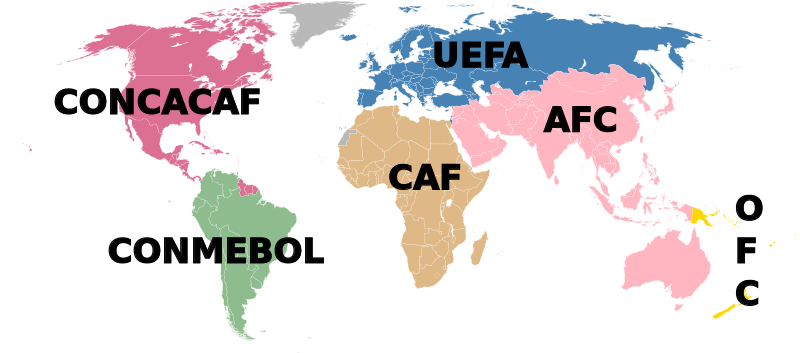
The league and playoff systems in common use tend to prevent interesting games from happening. The Football World Cup offers a set of examples for how things can go wrong, and old-school college football offers an example of how things can go right. We summarize below and expand on each point in the chapters that follow.
In knockout tournaments, few games occur between top teams, and even fewer if there are upsets. In the history of the World Cup the two most successful teams are Germany and Brazil and they have played only once.
In knockout tournaments there's no reason why knocked out teams can't schedule games. Who wouldn't want to watch a game between Argentina and Brazil after the conclusion of the 2014 World Cup?
Group stages suffer the same perils as knockout stages, plus they throw away information. A team can win every group game yet lose in the first round of the knockout stage.
For many leagues, the regular season is unimportant compared to the playoffs. Leagues for which the playoffs matter include college football and the NFL, and leagues for which the playoffs don't matter include college basketball and the NBA.
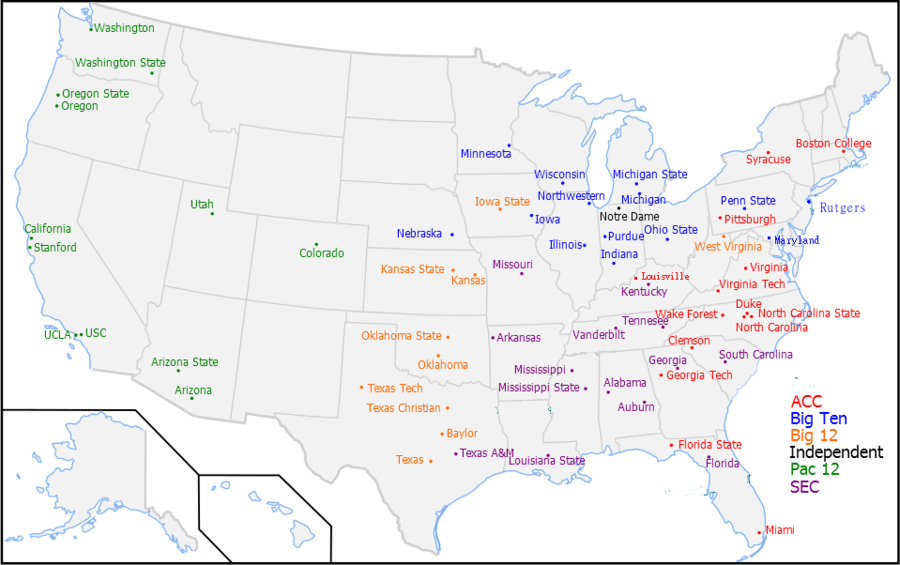
Many sports are dominated by oligarch leagues and plebe leagues have a hard time getting attention. Examples of oligarch leagues include the college football 5 power conferences, the English Football Premiere League, and the NFL.
                     Regular  Teams  Post-   Oligarch  Postseason        Oligarch
                     season          season  leagues   format            leagues
                     games           teams

Football    Pro          16    32     12       1      knockout           NFL
Basketball  Pro          82    30     16       1      knockout           NBA
Hockey      Pro          82    30     16       1      knockout           NHL
Baseball    Pro         162    31     10       1      knockout           MLB
Football    College      12  Many      4       2      knockout           Big10, Big12, Pac10, SEC, ACC
Basketball  College      27  Many     64      10      knockout           Big10, Big12, Pac10, SEC, ACC, East, AAC, MW, WC, A10
Hockey      College      35    59     16       2      knockout           Big10, National Collegiate Hockey Conf
Wrestling   College      12  Many      -       2      -                  Big10, Big12
Soccer      England Pro  38    20      -       1      -                  Premier League
Soccer      England Cup   -     -    763       -      knockout           -
Soccer      World Cup     -     -     32       -      groups, knockout   -
Rugby       World Cup     -     -     20       2      groups, knockout   4-Nations, 6-Nations
Rugby       College          Many     16       2      knockout           Division 1A, Varsity Club
LoL         College       -  Many      8       -      knockout           -
Formula-1                20    24      -       1                         Formula-1
NASCAR                   36    59     16       1                         NASCAR
The Rugby Championship is a double round robin between New Zealand, Australia,
S. Africa, and Argentina.
6 Nations Rugby is a round robin between England, France, Wales, Scotland, Ireland, and Italy.
The Rugby Pacific Nations Cup is a round robin between Fiji, Japan, Samoa, and Tonga.
The three rugby leagues are rare examples where there is no postseason.
 |
|---|
In American football, the regular season matters. Each regular season win tends to increase the playoff seed by 1, and the playoff seed matters because it determines home field advantage and wildcard byes.
The following table gives the average number of regular season wins for each seed, using data from 2007-2016. The regular season has 16 games.
Seed   Wins   Privilege

  1    13.3   Home field for the semifinal and quarterfinal.  Wildcard game bye.
  2    12.1   Home field for the quarterfinal.                Wildcard game bye.
  3    10.9   Home field for the wildcard game.
  4     9.2   Home field for the wildcard game.
  5    11.0
  6    10.0
Seeds 1-4 go to division winners and seeds 5-6 go to the best records among the remaining teams.
 |
|---|
 |
|---|
In the NBA, the regular season has little impact on the playoffs. For example, suppose the Milwaukee Bucks are the best team and they win the conference and gain the #1 seed. In the conference playoffs they can expect to face the 8th, 4th, and 2nd seeds. If the Bucks decide to slack and place 8th, they can expect to face the 1st, 2nd, and 3rd seeds in the playoffs. But since the Bucks are the best team the 1st seed is the 2nd best team, the 2nd seed is the 3rd best team, etc.
                                                      Rank of teams played in playoffs

If the Bucks play hard and place 1st in the conference:   2nd, 4th, and 8th
If the Bucks slack and place 8th in the conference:       2nd, 4rd, and 3rd
No matter what the Bucks will face the 2nd and 4th ranked team. The only difference
between playing hard and slacking is that they have to play the 3rd ranked team
instead of the 8th ranked team.
The following table gives the average number of games won by each seed, using data from 2009-2016. The regular season has 82 games. The difference between the 1st and 8th seeds is typically 20 games. That's a lot of slack.
Seed   Wins

  1    60.8
  2    55.9
  3    52.2
  4    49.9
  5    47.6
  6    45.2
  7    43.7
  8    41.9
 |
|---|
 |
 |
 |
|---|---|---|
 |
|---|
                                     Knockout  Group  Teams  Round  Previous  Next
                                      stage    stage   per   robin
                                      teams    teams  group

World             World Cup               16    32      4      1     2014    2018
Europe            European Cup            16    24      4      1     2016    2020
Europe            UEFA Nations League      4    12      3      2        -    2019
South America     Copa America             8    12      4      1     2015    2019
North America     CONCACAF Gold Cup        8    12      4      1     2017    2019
Central America   Copa Centroamericana     2     7      3.5    1     2014    2018
Caribbean         Caribbean Cup            2     8      4      1     2014    2018
Asia              Asian Cup                8    16      4      1     2015    2017
Asia East         EAFF E-1 Football Champ  0     4      4      1     2017    2019
Asia South        SAFF Championship        4     7      3.5    1     2015    2018
Asia ASEAN        AFF Championship         4     8      4      1     2016    2018
Asia West         WAFF Championship        4     9      3      1     2014    Postponed
Oceana            OFC Nations Cup          4     8      4      1     2016    2020
Africa            Africa Cup of Nations    8    16      4      1     2017    2019
N + S America     Copa America Centenario  8    16      4      1     2016    2020
Europe            World Cup Qualifying     0    54      6      2     2017    2021
South America     World Cup Qualifying     0    10     10      2     2017    2021
North America     World Cup Qualifying     0     6      6      2     2017    2021
Asia              World Cup Qualifying     0    12      6      2     2017    2021
Oceana            World Cup Qualifying     0     6      3      2     2017    2021
Africa            World Cup Qualifying     0    20      4      2     2017    2021

Round robin:  Number of times a team plays the other teams in the group.
We tally each team's results for 1994-2014, and then sum over the teams from each region.
            Qualifying     Round   Round   Quarter   Semi    Final   Win
              places       of 32   of 16    final    final

Europe          13           92      51      30       16       8      4
South America    4.5         28      21      13        7       4      2
North America    3.5         19      11       2
Asia             4.5         23       6       1        1
Oceana            .5          2
Africa           5           28       7       2
The number of qualifying places is out of balance with the strength of the regions.
Europeand South America should have more placesand Africa should have less.
The South American qualification tournament is a round robin. Since South America has many strong teams, qualification games are interesting. The other regions rarely see games involving top teams.
For Africa, qualification is largely luck and teams don't get a chance to play other finalists.
 |
|---|
Qualifying for each region is a double round robin group. The fraction of teams from each group that qualify is:
             Teams/group   Teams/group   Fraction of teams
             that qualify                that qualify

North America     3.5           6           .58
South America     5            10           .50
Asia              2.5           6           .42
Europe            1.5           6           .25
Africa            1             4           .25
Oceana             .5           3           .17
The larger the fraction of qualifying teams, the better. If the fraction is low then good teams are at risk of not qualifying. In 2018 Italy, The Netherlands, and The USA failed to qualify.
Most soccer group stages use the following scoring:
       Points

Win      3
Draw     1
Loss     0
This is bull. If a game is tied in the final minute it's in the interest of both teams to
flip a coin and let the coin toss winner score a free goal.
This scoring penalizes defensive teams. A low scoring game is more likely to draw than a high scoring game.
For a 4-year World Cup cycle,
            Regional   Subregional   World Cup   World Cup  Total
           tournament  tournament    qualifying    games    games
             games       games         games

Europe           9          0           10          4        23
South America    8          0           18          4        30
North America   16          0           10          4        30
Asia             8          8           10          4        30
Oceana           4          0            4          4        12
Africa           8          0            6          4        18
Regional tournaments:
Europe            European Cup
Europe            UEFA Nations League
South America     Copa America
North America     CONCACAF Gold Cup
Asia              Asian Cup
Oceana            OFC Nations Cup
Africa            Africa Cup of Nations
N + S America     Copa America Centenario
Sub-regional tournaments:
Central America   Copa Centroamericana
Caribbean         Caribbean Cup
Asia East         EAFF E-1 Football Champ
Asia South        SAFF Championship
Asia ASEAN        AFF Championship
Asia West         WAFF Championship
The USA averages 16 games per year. From 2014-2017:
World Cup 2014 final        4
World Cup 2014 qualifying  13
CONCACAF Gold Cup 2015      4
Copa America Cent 2017      4
CONCACAF Gold Cup 2017      4
Friendlies, 2014           11
Friendlies, 2015           11
Friendlies, 2016            7
Friendlies, 2017            5

Total                      63
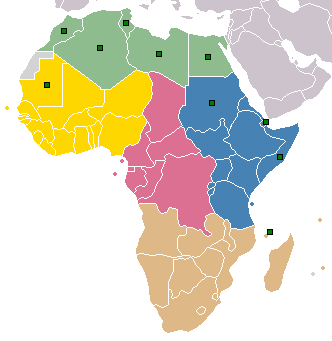
For the past 9 World Cups, the number of times each team qualified is:
S America     N America      Asia          Africa          Oceana

Brazil    9   USA        7   S Korea   9   Cameroon    6   New Zealand 1
Argentina 9   Costa Rica 5   Japan     6   Nigeria     6
Uruguay   6   Mexico     3   S Arabia  5   Tunisia     4
Paraguay  5   Honduras   2   Iran      4   Morocco     4
Colombia  5   Panama     1   N Korea   1   S Africa    3
Chile     3   Canada     1   UAE       1   Ghana       3
Ecuador   3   Trin Tob   1   Australia 1   Ivory Coast 3
Bolivia   1   Jamaica    1   China     1   Algeria     3
Peru      1                  Iraq      1   Egypt       2
                                           Senegal     2
                                           Angola      1
                                           Togo        1
 |
 |
 |
|---|---|---|
The bowl system is designed to make the national championship game the last game, an inflexibility that prevents interesting games from happening. Furthermore, one can never be sure that the two teams selected for the championship game are the two best teams because few matchups between non-conference teams occur during the season. There's no reason that premier teams can't play each other early on, and this adds interesting games to the season.
There is no good way to decide the playoff teams because there are few non-conference games to go on. In 2017, the non-conference games featuring top teams were:
Oklahoma     def.   Ohio St      31 16      Big 12  #1  vs.  Big Ten #1
Clemson      def.   Auburn       14  6      ACC     #1  vs.  SEC #3
Georgia      def.   Notre Dame   20 19      SEC     #1
Notre Dame   def.   Mich St      38 18      Big 10  #4
Notre Dame   def.   USC          49 19      Pac 12  #1
Notre Dame   def.   N Carol St   35 14      ACC     #3
Miami        def.   Notre Dame   41  8      ACC     #2
Stanford     def.   Notre Dame   38 20      Pac 12  #3
6 of the 8 games involve Notre Dame. Notre Dame is a benchmark for comparing conferences and this year their strength of schedule was overwhelmingly strongest in the nation. They took on two conference #1s, a #2, three #3s, and a #4.
Once the bowls were played it became clear that the toughest conference in terms of depth is the Big Ten, and the weakest conference is the Pac Twelve.
No team from outside the 5 oligarch conferences achieved any success against oligarch conferences except UCF, which defeated Auburn and Maryland. The toughest non-oligarch conferences are the American Athletic Conference and the Sun Belt Conference.
The conference championship game are a way of sneaking in an extra round of bowl games, and so we might as well make the most of it. The teams not in the conference championship should also have a chance to schedule games.
Sometimes a conference championship game makes sense and sometimes it doesn't. Consider the top teams from each conference.
                    Losses   Teams not played

Big 12    Oklahoma      1    -
          TCU           2    -

Big Ten   Wisconsin     0    Ohio St
          Ohio State    1    Wisconsin

SEC       Georgia       1    Alabama,  LSU
          Alabama       1    Georgia
          Auburn        1    -
          LSU           2    Georgia

Pac 12    USC           1    Washington
          Stanford      2    -
          Washington    2    USC

ACC       Clemson       1    Miami
          Miami         1    Clemson,  N Carol St
          N Carol St    2    Miami
The Big Twelve is unambiguous. The top two teams played each other during the regular
season and Oklahoma has fewer losses, and so there is no need for a conference
championship game. Such a game only gives Oklahoma a chance to lose and miss out
on the playoffs. It would be better for Big Twelve teams to schedule out-of-conference
games that are compelling to watch and will make money. One might schedule games
with teams not involved in conference championship games such as Washington, Penn State,
and Alabama.
Wisconsin has the fewest losses in the Big Ten but they didn't play Ohio State, and so a game between them is appropriate. If Ohio State wins then both teams have the same number of conference losses and they could be said to share the Big Ten championship.
The SEC has 3 teams with 1 conference loss, Georgia, Auburn, and Alabama. During the regular season, Auburn played Georgia and Alabama, and Georgia didn't play Alabama. It would be appropriate for Georgia to play Alabama in the postseason. If Georgia defeats Alabama then Georgia and Auburn share the conference championship. If Alabama defeats Georgia then Alabama and Auburn share the conference championship.
In the Pac Twelve season, USC didn't play Washington and so it would be appropriate for them to play. The conference championship instead featured USC vs. Stanford but this was unnecessary because they had alread played.
In the ACC, Clemson and Miami had one conference loss and they didn't play during the season, and so it was appropriate for them to play a conference championship game.
To summarize:
             What happened                What should have happened

Big Ten      Wisconsin vs. Ohio State     Wisconsin vs. Ohio State
Big Twelve   Oklahoma vs. TCU             Out-of-conference games
SEC          Georgia vs. Auburn           Georgia vs. Alabama
Pac Twelve   USC vs. Stanford             USC vs. Washington
ACC          Clemson vs. Miami            Clemson vs. Miami
In the Big Ten,
Ohio State  def.  Wisconsin
Wisconsin   def.  Iowa
Iowa        def.  Ohio State
Ohio State and Wisconsin each have 1 conference loss. Ohio State is regarded as the conference champion because they defeated Wisconsin in the championship game, but this diminishes the importance of the conference. If one regards conference games as important than one should consider Wisconsin and Ohio State to share the Big Ten championship because they have the same number of conference losses. This also provides incentive for teams not in contention for the championship to win spoiler games over contenders.
Oligarch conferences:    Big Ten, Big Twelve, ACC, SEC, Pac Twelve
Plebe conferences:       AAC, Sun Belt, Mountain West, C-USA, MAC
Independents:            Notre Dame, BYU, Army
The gap between oligarch and plebe conferences is vast.
The college football season could be improved by:
*) Increase the flexibility of the conference championship game to reflect the best interests of the teams, and have all teams in the conference play a game. Games can be either in-conference or out-of-conference, whatever the teams decide.
*) Ditch conference subleagues and instead schedule games that make sense regionally and matchup-wise.
*) Have a round of bowls early in the season in the north when the weather is warm. This adds interesting games to the season and it fixes the injustice of southern stadiums getting all the bowl games.
For example, the schedule for Wisconsin might look like:
 Boise State     Away     Play a northern team while the weather is warm
 Alabama         Home     Host a prominent southern team
 Hawaii          Away
 Notre Dame      Home
 Minnesota       Away     Nearby team.  Play Minnesota while the weather is warm
 Michigan State  Home
 Illinois        Home     Nearby team
 Michigan        Away
 Northwestern    Home     Nearby team
 Ohio State      Home
 Iowa            Away     Nearby team.  Iowa City has great bars
 Nebraska        Away     Play in Nebraska because it's warmer
 Oklahoma        Away     Play a non-conference game instead of conf champ game
 Stanford        Away     Bowl game
The schedule emphasizes conference games with nearby teams. Nebraska is always the last game because Nebraska is consistently highly-ranked. The Wisconsin-Nebraska game is analogous to the Michigan vs. Ohio State game.
With this schedule, Wisconsin plays every prominent Big Ten team except Penn State.
The NCAA football system is awkward and change is inevitable. Some things that could happen are:
Conferences could seceed from the NCAA. Any conference can be self-sufficient.
The Big Twelve has ten members and plenty of room for more. They recently added West Virginia and TCU and additional possibilities include Boise State, Hawaii, and Houston.
Allow players to promote themselves with advertisers.
Numbers indicate the number of time the team was ranked in the top 25 from 2009-2017.
                  Big  Big  Pac  SEC  ACC
                  10   12   12

Alabama       9                   *
LSU           9                   *
Clemson       8                        *
Ohio St       7    *
Wisconsin     7    *
Oklahoma      7         *
Stanford      7              *
Oregon        7              *
Mich St       6    *
Oklahoma St   6         *
TCU           6         *
Boise St.     6                             Mountain West
USC           6              *
Auburn        6                   *
Florida St.   6                        *
Utah          5              *
Georgia       5                   *
Numbers indicate the number of teams ranked in the top 25 from 2009-2017.
SEC             53
Big Ten         38
Pac Twelve      35
Big Twelve      34
Atlantic Coast  32
American        12
Mountain West   10
Mid American     5
Notre Dame       3
C-USA            1
BYU              1
Numbers indicate end-of-season rankings.
Year        17 16 15 14 13 12 11 10  9

Ohio St      5  3  7  4  7        6  5
Mich St     15     3  8  4    17  9
Wisconsin    7  8    18 19    10  5 16
Michigan        6 14       18 13
Penn State   8  5             22     9
Nebraska                   16 20 18 14
Iowa               5
Minnesota            25              7
Northwest   17    13       20

Alabama      1  1  2  1  3  1  2 16  1
LSU         18 20 20 23 16  8  1 11 17
Auburn      10 14    19  2    25  1
Georgia      2       13 22  7 16
Florida        17 19        3        3
S. Carolina              9 10  9 20
Arkansas                       6  8
Missouri             16  8       12
Tennessee      21 23
Miss. St.   19        7          21
Ole Miss          12  9             20
Texas AM                21  9    17

Oklahoma     3  7  4    11 11 14  7
Oklahoma St 14 12 16    13  3    14
TCU          9    11  6       18  3  6
Baylor            17  5  6    12
Kansas               11
W. Virginia    16             23 22 25
Kansas St.               5     8
Texas                      23 24     2
Texas T                             21

Oregon            15  2 10  4  5  2 11
Stanford    20 18  6     5  6  4  4
USC         12  9 25 24 25          22
Utah           19 22 22          19 18
Washington  16  4
UCLA                 14 17 17
Arizona St.          15 14
Colorado       10
Arizona              10
Oregon St.                 13

Clemson      4  2  1 17 12 14 15    24
Florida St.    11  9  3  1 12    23
Georgia T            12       11    13
Virginia T  24 22                13 10
Pittsburgh     23                   15
Louisville     13    21 18 21
N. Carolina       10
Duke                    24
Miami       13                   19
N Carol St  23

Notre Dame  11     8        2              Independent
BYU                                 12     Independent

Boise St.   22       20    19  7 10  4     Mountain West
Nevada                           15        Mountain West
Fresno St               20                 Mountain West
Utah St.                   22              Mountain West
Hawaii                           24        Mountain West
San Jose St                24              Mountain West

UCF          6          15       25        American
Houston           18          19           American
Temple         24 24                       American
Navy           25 21                       American
Cincinnati                           8     American
S Florida   21                             American
Memphis     25                             American

W. Michigan    15                          Mid American
C Michigan                          23     Mid American
Kent State                 25              Mid American
N. Illinois             23 15              Mid American

Southern Miss                 21           CUSA
        Champs   #2    #3

Ohio St    11     7     3
Wisconsin   6     3     5
Michigan    5     4     5
Penn St     4     2     5
Mich St     3     3     2
Northwest   3     0     2
Iowa        2     2     2
Purdue      1     2     0
Illinois    1     1     0
Nebraska    0     0     1


Year      17 16 15 14 13 12 11 10  9  8  7  6  5  4  3  2  1  0 99 98 97 96 95 94 93

Ohio St   *1  1  1 *0  0  0  5  1 *1 *1 *1 *0 *1  4  2 *0  3  3  5 *1  2 *1  1  2 *1d
Wisconsin  0  2  2  1  2 *4 *2 *1  3  5  3  1  3  2  4  6  5  4 *1 *1  3  5  4d 2d*1d
Michigan   4  2  2  5  5  2  2  5  7  6  2  1  3 *1 *1  2  2 *2  2 *1 *0  3  3  3  3
Penn St    2 *1  4  6  4  2  2  4  2 *1  4  3 *1  6  7  3  4  4  3  3  2  2  3 *0  2
Mich St    2  8 *1  1 *0  5  1 *1  4  2  5  7  6  4  3  6  5  6  2  4  4  3  3d 8  4
Northwest  2  4  2  5  7  3  5  5  3  3  5  6  3  3  4  7  6 *2  7  8  5 *1 *0  5  8
Iowa       5  3  0  4  3  6  4  4  2  3  4  6  3 *1  3 *0  4  5  8  6  4  2  4  4d 5
Purdue     5  8  7  7  8  5  4  6  4  6  5  3  5  4  2  4  4 *2  4  2  2  6  5d 4  8
Illinois   9  7  6  5  7  8  6  4  6  5  2  7  8  7  8  4 *1  6  4  6  8  7  4d 4  3
Minnesota  7  4  6  3  4  6  6  6  5  5  8  5  4  5  3  5  6  4  3  6  7  7  7  7  5
Indiana    7  5  6  7  5  6  8  7  7  7  5  5  7  7  7  7  4  6  5  6  7  7  8  5  3
Nebraska   6  3  6  3  3  1  3
Rutgers    6  9  7  5
Maryland   7  6  7  4

* = conference champion
d = draw
Numbers are conference losses.
A March Madness "high seed" is a seed of 8th or better. For 1999-2017, we tally the number of high seeds for each team.
              High    Big Big Pac SEC ACC AAC East
              seeds   Ten 12  12

Kansas          19         *
Duke            19                     *
Wisconsin       17     *
Kentucky        16                 *
N Carolina      16                     *
Michigan St     15     *
Texas           15         *
Arizona         14             *
Florida         14                 *
Syracuse        13                     *
Louisville      13                     *
Ohio St         12     *
Notre Dame      12                     *
UCLA            12             *
Cincinnati      12                         *
Gonzaga         12                                  West Coast
Indiana         11     *
Maryland        11     *
Connecticut     11                         *
Oklahoma        11         *
Pittsburgh      10                     *
Illinois         9     *
W Virginia       9         *
Marquette        9                             *
Villanova        9                             *
Xavier           9                             *
Memphis          9                         *
Stanford         8             *
Oregon           8             *
Georgetown       8                             *
Purdue           7     *
Iowa St          7         *
California       7             *
Tennessee        7                 *
Butler           7                             *
Miami (Fl)       7                     *
Washington       6             *
Utah             6             *
Boston C         6                     *
Wake Forest      6                     *
UNLV             6                                  Mountain West
Baylor           6         *
Virginia         6                     *
Michigan         5     *
Iowa             5     *
BYU              5                                  West Coast
San Diego St     5                                  Mountain West
LSU              5                 *
Vanderbilt       5                 *
Creighton        5                             *
Temple           5                         *
Kansas St        4         *
Texas Tech       4         *
Missouri         4                 *
USC              4             *
New Mexico       4                                  Mountain West
Texas AM         4                 *
N Carolina St    4                         *
Wichita St       4                         *
Mississippi St   4                 *
Minnesota        3     *
Florida St       3                     *
Alabama          3                 *
Dayton           3                                  Atlantic 10
St John's        3                             *
Clemson          3                     *
Saint Joseph's   3                                  Atlantic 10
VCU              3                                  Atlantic 10
Georgia T        3                     *

                      Big Big Pac SEC ACC AAC East
                      Ten 12  12
A "high seed" is a March Madness seed of 8th or better. We tally the number of high seeds for each conference from 1999-2017.
              High seeds

ACC              118
Big Ten           97
Big Twelve        75
Pac Twelve        71
SEC               68
East              55
AAC               48
Mountain West     18
West Coast        18
Atlantic 10       15
Missouri Valley    4
Heartland          2
CUSA               2
Ohio Valley        1
Colonial           1
America East       1
Numbers indicate March Madness seeds.
Year 17 16 15 14 13 12 11 10 9 8 7 6 5 4 3 2 1 0 9 Kansas 1 1 2 2 1 2 1 1 3 1 1 4 3 4 2 1 4 8 6 Duke 2 4 1 3 2 2 1 1 2 2 6 1 1 1 3 1 1 1 1 Wisconsin 8 7 1 2 5 4 4 4 12 3 2 9 6 6 5 8 6 8 5 N Carolina 1 1 4 6 8 1 2 1 1 1 3 1 6 2 8 3 Kentucky 2 4 1 8 1 4 1 8 8 2 1 1 4 2 5 3 Texas 6 11 7 11 4 8 7 2 4 2 8 3 1 6 6 5 7 Michigan St 9 2 7 4 3 1 10 5 2 5 9 6 5 7 7 10 1 1 1 Florida 4 1 3 7 2 10 1 3 4 5 2 5 3 5 6 Arizona 2 6 2 1 6 5 12 10 8 8 3 9 1 3 2 1 4 Louisville 2 4 4 1 4 4 9 1 3 6 4 10 4 7 7 Syracuse 10 3 4 1 3 1 3 5 4 5 3 5 4 8 Notre Dame 5 6 3 7 7 2 6 5 6 5 8 6 UCLA 3 11 4 6 7 6 1 2 2 11 8 4 6 5 Ohio St 10 6 2 2 1 2 8 1 2 4 5 3 4 Cincinnati 6 9 8 5 10 6 6 7 4 8 1 5 2 3 Gonzaga 1 11 2 8 1 7 11 8 4 7 10 3 3 2 9 6 12 10 Indiana 5 10 1 4 8 7 6 7 5 4 6 6 Connecticut 9 7 9 3 1 4 1 2 2 5 2 5 1 Maryland 6 5 4 4 10 4 4 6 1 3 3 2 Oklahoma 2 3 5 10 2 6 6 3 1 2 4 3 Pittsburgh 10 9 8 1 3 1 4 3 5 9 3 2 3 Villanova 1 2 1 2 9 9 2 3 12 9 1 5 8 Illinois 7 9 5 12 4 1 5 4 4 1 4 Xavier 2 6 10 6 6 4 3 9 14 7 3 7 11 Memphis 8 6 8 12 2 1 2 1 7 7 Marquette 10 3 3 11 6 6 6 8 7 3 5 W Virginia 4 3 5 10 5 2 6 7 6 7 Stanford 10 3 11 8 1 4 8 1 1 2 Georgetown 4 2 3 6 3 2 2 7 10 Oregon 3 1 8 7 12 9 3 8 2 7 Purdue 4 5 9 10 3 4 5 6 9 9 6 California 4 12 8 7 7 8 6 8 Tennessee 11 9 6 2 5 2 8 4 4 Butler 4 9 6 6 8 5 9 7 5 12 10 12 Iowa St 5 4 3 3 10 8 9 2 2 Miami (Fl) 8 3 2 7 5 6 2 Oklahoma St 10 9 9 5 7 2 2 6 7 11 3 Washington 7 11 4 5 1 8 7 Utah 3 5 5 6 11 9 12 8 2 Wake Forest 9 4 2 4 2 7 7 Boston C 7 7 4 4 6 11 3 UNLV 5 6 8 8 8 7 10 Baylor 3 5 3 6 3 3 11 Michigan 7 11 2 4 4 8 10 Virginia 5 1 2 1 10 4 5 LSU 9 8 4 6 8 4 Vanderbilt 9 5 5 4 4 6 San Diego St 8 4 7 6 2 11 11 13 BYU 10 14 3 7 8 8 8 12 12 12 Arkansas 8 5 9 12 8 7 11 4 Creighton 6 3 7 8 10 10 6 12 10 10 Temple 10 9 5 7 5 11 11 2 6 Iowa 7 7 3 10 7 5 N Carolina St 8 12 8 11 10 10 3 9 7 Missouri 9 2 11 10 3 6 12 9 9 8 Texas AM 3 7 5 9 9 3 12 Wichita St 10 11 7 1 9 5 7 Kansas St 11 9 4 8 5 2 11 Texas Tech 8 10 6 8 6 USC 11 8 10 5 4 6 New Mexico 7 3 5 3 12 Mississippi St 13 8 9 2 5 3 Florida St 3 3 10 9 5 Alabama 9 10 5 8 10 2 Minnesota 5 11 11 10 8 7 Dayton 7 7 11 11 11 10 4 11 St John's 9 6 9 2 3 Clemson 12 7 7 5 Saint Joseph's 8 10 11 1 7 9 VCU 10 10 7 5 5 12 11 11 13 Georgia T 10 10 5 3 8 S Illinois 4 11 7 9 11 11 Auburn 10 7 1 Saint Louis 5 4 9 9 Colorado 8 8 10 10 Seton Hall 9 6 10 8 10 Providence 9 6 11 5 10 SMU 6 6 Virginia T 9 5 Saint Mary's 7 11 7 10 10 10 Nevada 12 7 5 9 10 Georgia 10 10 14 3 8 Washington St 4 3 Charlotte 7 9 9 9 5 Colorado St 8 11 14 Richmond 7 11 Southern Cal 6 Tulsa 13 13 12 7 Arizona St 10 6 10 Pacific 15 13 8 12 Drake 5 Massachusetts 6 Oregon St 7 N Iowa 11 5 9 12 10 11 14 S Carolina 7 10 Murray State 6 13 14 12 14 DePaul 7 9 Penn State 10 7 Northwestern 8 Binghampton 15 6 Mississippi 11 12 3 George Mason 8 12 11 14 George Wash 9 11 8 12 College of Charleston 8 Wagner 15 UTEP 12 11 13 Utah State 12 12 11 12 14 15 12 12 Southern Utah 14 Air Force 13 11 Siena 13 9 13 16 Sam Houston St 14 15 E Illinois 15 IUPUI 16 S Alabama 10 14 Texas AM CC 15 Corpus Christi Florida Atlantic 15 C Connecticut St 14 15 N Texas 15 C Conn St 16 Ball State 11 Appalachian St 14 Lamar 16 Old Dominion 9 11 12 12 Oral Roberts 14 16 Long Beach St 12 12 Hofstra 13 14 Albany 16 15 13 16 Pepperdine 10 11 N Carolina AT 16 Ohio 13 14 13 Coast Carolina 16 16 Cal St Fullerton 14 McNeese State 14 Cornell 12 14 S Florida 12 Houston 13 Manhattan 13 12 14 Mercer 14 UC Santa Barbara 15 15 14 Alabama St 16 16 Illinois Chicago 15 Little Rock 12 Montana 13 14 12 16 15 Belmont 11 14 13 15 15 15 SE Louisiana 15 Farleigh Dickinson 16 Miss Valley St 16 Detroit 15 Vermont 16 16 13 15 16 Texas San Antonio 16 Iona 14 13 15 13 14 14 Southern 16 16 WKU 12 12 13 Fresno St 14 9 9 Cal St Northridge 15 13 Milwaukee 15 12 N Arizona 15 Akron 12 15 13 Boston U 16 16 Nebraska 11 Bradley 13 San Diego 13 13 Davidson 10 14 13 10 13 15 13 UIC 13 James Madison 16 Wyoming 12 11 Boise State 14 Princeton 13 14 15 Indiana St 14 13 12 Long Island 15 UTSA 16 UC Irvine 13 Albany 14 Oakland 13 14 16 Bucknell 14 9 14 N Colorado 15 Belmont 15 N Carolina Cent 14 Lafayette 16 15 Louisiana-Lafayette 13 14 13 Cleveland St 13 Richmond 12 Morehead State 13 16 Morgan State 15 15 Radford 16 Saint Peter's 14 UW Milwaukee 11 12 Delaware 13 Yale 12 UNC Wilmington 13 11 13 15 Green Bay 14 UNC Greensboro 16 CalSt Bakersfield 15 Holy Cross 16 13 14 16 15 Wright State 14 Weber State 15 12 Niagara 16 14 Kent St 14 9 12 10 13 M Tennessee 12 15 Winthrop 13 13 11 15 14 16 14 Kent St 14 N Kentucky 15 E Kentucky 15 16 15 W Kentucky 16 16 9 14 Delaware St 16 Texas Southern 16 15 N Texas 15 S Carolina St 16 16 UC Davis 16 Miami (Ohio) 14 Chattanooga 12 16 15 Stony Brook 13 Stephen F Austin 14 12 12 14 E Washington 13 15 Liberty 16 UAB 14 9 11 9 Weber State 15 Vermont 13 Rhode Island 11 W Michigan 14 11 UMBC 15 Ole Miss 9 La Salle 13 SE Missouri State 13 Southern Miss 9 Wofford 12 15 14 13 Cal Poly SLO 16 Portland State 16 Harvard 13 12 14 12 Montana 13 St Bonaventure 14 12 Samford 13 Loyola 15 Georgia St 14 11 UNC Wilmington 9 Jacksonvill St 15 Jackson State 16 16 C Michigan 11 Northwestern St 14 14 16 Norfolk State 15 Long Island 16 S Dakota St 16 12 13 14 N Dakota St 15 12 14 Lehigh 15 16 Robert Morris 16 15 15 Arkansas Pine Bluff 16 Hawaii 13 10 12 Buffalo 14 12 Valparaiso 13 14 15 13 16 Northeastern 14 UNC Asheville 15 16 16 16 Austin Peay 16 16 13 Penn 14 15 13 11 11 13 Princeton 12 Bucknell 13 11 Xavier 11 Florida Gulf C 14 16 15 C Florida 15 14 Florida AM 16 Mount St Mary's 16 N Dakota 15 New Mex St 14 15 13 13 13 12 13 Louisiana-Laf 14 American 15 Weber State 16 Hampton 16 16 16 15 15 Monmouth 16 15 16 Troy 15 Troy State 14 UNC Wilmington 12 Mt St Mary's 16 E Tenn St 13 13 American 15 E Tennessee St 16 15 Year 17 16 15 14 13 12 11 10 9 8 7 6 5 4 3 2 1 0 9
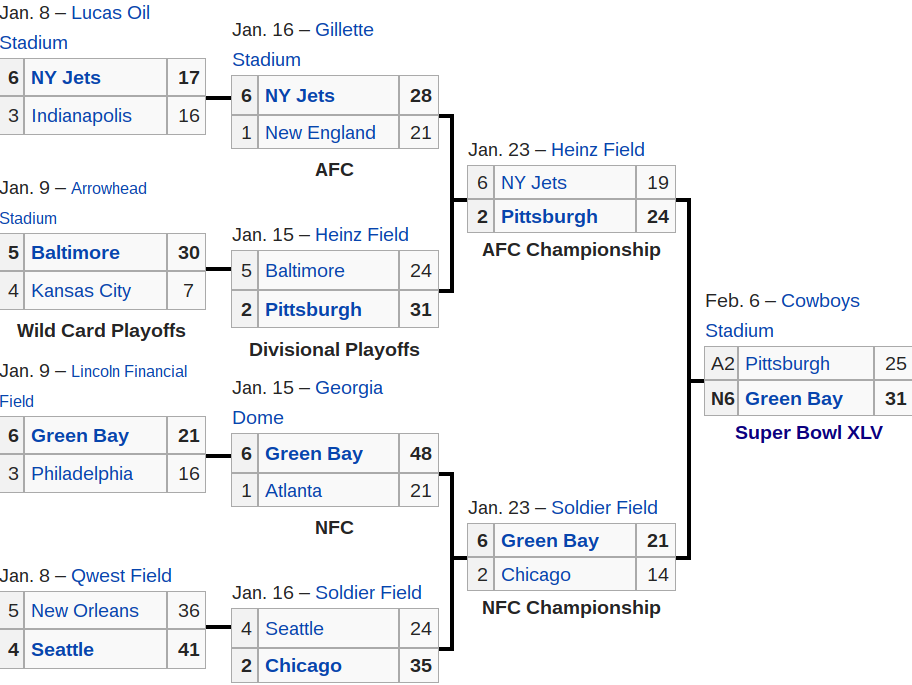
The following table is for 2001-2017, with all teams with at least 6 playoff appearances included.
               Champ  Final  Semi  Playoffs

New England      5      7    11     15
Green Bay        1      1     4     13
Pittsburgh       2      3     7     12
Indianapolis     1      2     4     12
Seattle          1      3     3     11
Baltimore        1      1     4      9
Philadelphia     1      1     5      9
Denver           1      2     3      8
Atlanta                 1     3      8
NY Giants        2      2     2      7
Arizona                 2     3      7
Carolina                2     3      7
Kansas City                          7
Cincinnati                           7
New Orleans      1      1     2      6
NY Jets                       2      6
Minnesota                     1      6
Dallas                               6
1:  Superbowl winner
2:  Superbowl loser
3:  Conference championship loser
4:  Divisional round loser
5:  Wildcard game loser


Year        17 16 15 14 13 12 11 10  9  8  7  6  5  4  3  2  1    Champ  Final  Semi  Playoffs

New England  2  1  3  1  3  3  2  4  5     2  3  4  1  1     1      5      8    12     16
Pittsburgh   4  3  4  5        5  2     1  5     1  3     4  3      2      3     7     13
Green Bay       3  4  3  5  4  4  1  5     3        5  4  5  4      1      1     4     13
Indianapolis          3  4  5     5  2  5  4  1  4  4  3  5         1      2     4     12
Seattle         4  4  2  1  4     4        4  4  2  5  5            1      3     3     11
Philadelphia 1           5        5  5  3     4     2  3  3  3      1      2     6     10
Baltimore             4     1  3  4  4  3     4        5     4      1      1     3      9
Atlanta      4  2           3  5  4     5           3     4                1     3      9
Denver             1  4  2  4  4                 3  5  5            1      2     3      8
Carolina     5     2  4  4              4        3     2                   2     3      8
Kansas City  5  4  4     5        5           5        4                                8
NY Giants       5              1        4  1  5  5        5         2      2     2      7
New Orleans  4           4     4  5  1        3                     1            1      7
Arizona            3  5              4  2           4  4     2             2     3      7
Minnesota    3     5        5        3  5           4                            2      7
Cincinnati         5  5  5  5  5     5           5                                      7
NY Jets                           3  3        5     4     4  5                   2      6
Tennessee    4                          4  5           4  3                      1      6
Dallas          4     4              4     4  5        5                                6
S Francisco              3  2  3                          4  5             1     3      5
San Diego                4           4     3  4     5                            1      5
Chicago                           3           2  4           4             2     3      4
Oakland         5                                         2  4             1     1      4
Jacksonville 3                             4     5                               1      4
Tampa Bay                                  5     5        1  5      1                   4
Washington         5        5              5     4                                      4
Houston         4  5        4  4                                                        4
Detroit         5     5        5                                                        3
Miami           5                       5                    5                          3
Los Angeles  5                                                                          2
Buffalo      5                                                                          2
Cleveland                                                 5                             1
-->
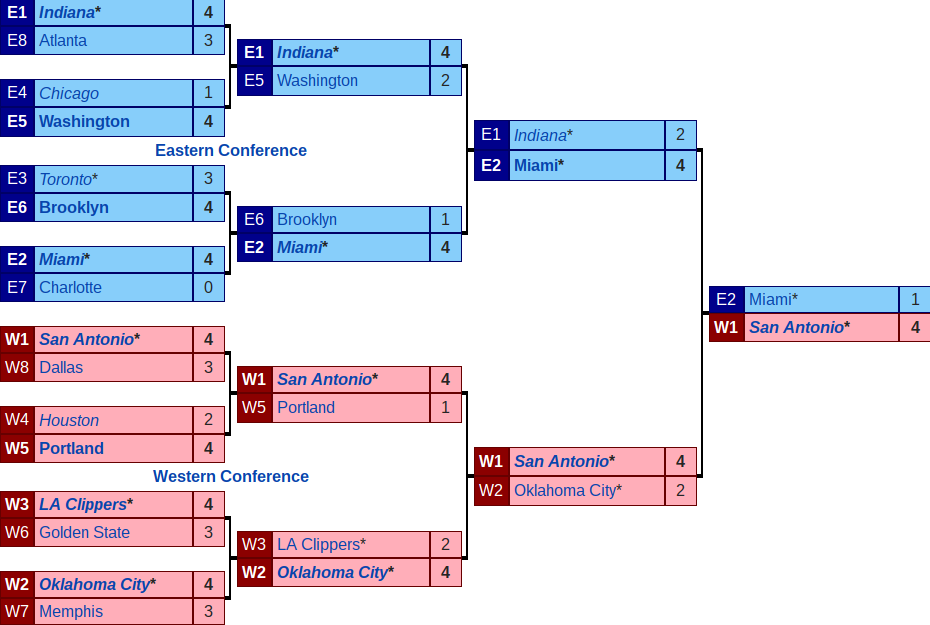
Data is for 2003-2017.
Year           Champ   Final   Semifinal

San Antonio      4       5        8
Miami            3       5        6
Detroit          1       2        6
Cleveland        1       4        5
LA Lakers        2       4        4
Boston           1       2        4
Oklahoma City            1        4
Golden State     2       3        3
Dallas           1       2        3
Phoenix                           3
Indiana                           3
1:  Champion
2:  Final
3:  Semifinal
4:  Quarterfinal
5:  Round of 16

Year          17 16 15 14 13 12 11 10  9  8  7  6  5  4  3  Champ   Final   Semifinal

San Antonio    3  4  5  1  2  3  5  4  5  3  1  4  1  4  1    4       5        8
Miami             4     2  1  1  2  5  5     5  1  3  4       3       5        6
Detroit           5                    5  3  3  3  2  1  3    1       2        6
Cleveland      2  1  2              4  3  4  2  4             1       4        5
LA Lakers                  5  4  4  1  1  2  5  5     2  4    2       4        4
Boston         3  5  5     5  3  4  2  4  1        5  5  4    1       2        4
Oklahoma City  5  3     3  4  2  3  5              4                  1        4
Golden State   1  2  1  5  4                                  2       3        3
Dallas            5  5  5     5  1  5  4  5  5  2  4  5  3    1       2        3
Phoenix                             3     5  4  3  3     5                     3
Indiana        5  5     3  3  4  5              5  4  3  5                     3
Orlando                       5  5  3  2  4  5           5            1        2
Brooklyn             5  4  5                 4  4  5  4  2            1        1
Atlanta        5  4  3  5  5  5  4  4  4  5                                    1
Chicago        5     4  5  4  5  3  5  5     4  5  5                           1
Memphis        5  5  4  5  3  5  4              5  5  5                        1
Toronto        4  3  5  5                 5  5                                 1
Houston        4  5  3  5  5           4  5  5     5  5                        1
Denver                     5  5  5  5  3  5  5  5  5  5                        1
Utah           4              5     4  5  4  3           5                     1
Minnesota                                             3  5                     1
Portland       5  4  5  4        5  5  5                 5
LA Clippers    5  5  4  4  5  4                 4
Milwaukee      5     5     5        5           5     5  5
Washington     4        4                 5  5  5
Charlotte         5     5           5
Washington           4                             4
New Orleans          5           5     5  4           5  5
New York                   4  5  5                    5
Philadelphia                  4  5     5  5        5     4
Golden State                                 4
Sacramento                                      5  5  4  4

Year          17 16 15 14 13 12 11 10  9  8  7  6  5  4  3
          Win  Final  Semi   Quarter   Europe  South    North
                      final  final             America  America

Germany      4    8     13     17        *
Brazil       5    7     11     16                *
Italy        4    6      8     10        *
Argentina    2    5      5     10                *
England      1    1      2     10        *
France       1    2      5      9        *
Spain        1    1      2      7        *
Serbia                   2      7                *
Uruguay      2    2      5      6        *
Neth.             3      5      6        *
Sweden            1      4      6        *
Hungary           2      2      5        *
Russia                   1      5        *
Czech             2      2      4        *
Austria                  2      4        *
Belgium                  1      4        *
Mexico                          4                        *
Switz.                          4        *
USA                      1      3                        *
Poland                   1      3        *
Chile                    1      3                *
Paraguay                        3                *
Portugal                 2      2        *
Romania                         2        *
Bolivia                         2                *
Peru                            2                *
N Ireland                       2        *
We tally each team's results for 1994-2014, and then sum over the teams from each region.
            Qualifying   Round   Round   Quarter   Semi    Final   Win
              places     of 32   of 16   final     final

Europe          13         92      51       30      16       8      4
South America    4.5       28      21       13       7       4      2
North America    3.5       19      11        2
Asia             4.5       23       6        1       1
Oceana            .5        2
Africa           5         28       7        2
Teams from Europe and South America perform well and teams from Africa perform poorly. The number of qualifying places for each region is out of balance with the strength of the regions.
6: Win    5: Final    4: Semifinal    3: Quarterfinal    2: Round 16    1: Round 32


Year      3 3 3 5 5 5 6 6 7 7 7 8 8 9 9 9 0 0 1 1 1   Win  Final  Semi   Quarter
          0 4 8 0 4 8 2 6 0 4 8 2 6 0 4 8 2 6 0 4 8               final  final

Germany     4 2   6 4 3 5 4 6 3 5 5 6 3 3 5 4 4 6 *    4    8     13     17
Brazil    3 2 4 5 3 6 6 2 6 4 4 3 2 3 6 5 6 3 3 4 *    5    7     11     16
Italy       6 6 3 2   2 2 5 2 4 6 2 4 5 3 2 6 1 1      4    6      8     10
Argentina 5 2       2 2     3 6 3 6 5 2 3 1 3 3 5 *    2    5      5     10
England         3 3 2 3 6 3     3 3 4   2 3 3 2 1 *    1    1      2     10
France    3 2 3 3 2 4   2     2 4 4     6 1 5 1 3 *    1    2      5      9
Spain       3   4     2 2     2 3 3 2 3 1 3 2 6 1 *    1    1      2      7
Serbia    4     3 3 3 4     3   2   3   2   1 1   *                2      7
Uruguay   6     6 4   2 3 4 2     2 2     1   4 2 *    2    2      5      6
Neth.       2 2             5 5     2 3 4   2 5 4           3      5      6
Sweden      3 4 4   5     2 3 2     1 4   2 2     *         1      4      6
Hungary     3 5   5 2 3 3     2 2 1                         2      2      5
Russia              3 3 4 3     3 2 1 1   1     1 *                1      5
Austria     4 2   4 2         3 3   1   1         *                2      4
Czech       5 3   2 2 5   2     2   3       1               2      2      4
Belgium   3 2 2   2       2     3 4 2 2 1 2     3 *                1      4
Switz.      3 3 3 3   2 2             2     2 1 2 *                       4
Mexico    3     3 2 2 2 2 3   2   3   2 2 2 2   2 *                       4
USA       4 2   3                   1 2 1 3 1 2 2                  1      3
Poland        2           3 4 3 4 2       1 1     *                1      3
Chile     3     3     4 2   2   2       2     2 2                  1      3
Paraguay  3     3   2             2     2 2 1 3                           3
Portugal                4         1       1 4 2 1 *                2      2
Romania   3 2 2           2         2 3 2                                 2
Bolivia   3     3                     1                                   2
S. Korea          2               1 1 1 1 4 1 2 1 *                1      1
Bulgaria              2 2 2 2     2   4 1                          1      1
Turkey            2                       4                        1      1
Cameroon                        2   3 1 1 1   1 1                         1
Denmark                           2     3 2   1   *                       1
Costa Rica                          2     1 1   3 *                       1
Senegal                                   3       *                       1
Ukraine                                     3                             1
India           3                                                         1
Ireland                             3 2   2                               1
Colombia              2             2 1 1       3 *                       1
Peru      3                   3 2                 *                       1
North_Korea             3                     1                           1
Ghana                                       2 3 1                         1
Japan                                   1 2 1 2 1 *
Croatia                                 4 1 1   1 *
Ecuador                                   1 2   1
Iceland                                           *
Panama                                            *
Scotland          2 2       2 2 2 1 1   1
Nigeria                               2 2 1   1 2 *
Honduras                        2             1 1
Algeria                         2 1           1 2
Ivory Coast                                 1 1 1
Iran                          2         1   1   1 *
Bosnia Herz                                     1
Greece                                1       1 2
Israel                    2
Norway        2                       1 2
El_Salvador               2     2
Tunisia                       2         1 1 1     *
UAE                                 1
South_Africa                            1 1   1
Canada                            1
N_Ireland           3           3 1                                       2
Wales               3                                                     1
Saudi_Arabia                          2 1 1 1     *
Trin_Tob                                    1
Egypt       2                       1             *
Morocco                   2       2   1 1         *
Haiti                       2
Australia           2       2                   1
Togo                                        1
Austria                                 1
Zaire                       2
Slovakia                                1   2
Jamaica                                 1
China                                     1
Kuwait                          2
Angola                                      1
Algeria                           1           1
New_Zealand                     2             1
Iraq                              1
            Championships

Oklahoma State  34
Iowa            23
Iowa State       8
Oklahoma         7
Penn State       5
Minnesota        3
Ohio State       1
Arizona State    1
Michigan State   1
Northern Iowa    1
Cornell College  1
Indiana          1


Big Twelve      49
Big Ten         33
Other            3
Few schools outside of the Midwest have won championships.
 |
 |
|---|---|
 |
|---|
Men's hockey:
            Championships   Frozen Four

Michigan             9       24
North Dakota         7       21
Denver               7       14
Wisconsin            6       12
Boston College       5       24
Boston University    5       22
Minnesota            5       21
Lake Superior State  3        4
Michigan State       3       11
Michigan Tech        3       10
Cornell              2        8
Maine                2       11
Colorado College     2       10
RPI                  2        5
Minnesota-Duluth     1        4
Harvard              1       12
Providence           1        4
Bowling Green        1
Northern Michigan    1
Union                1
Yale                 1
St Lawrence                   9
Clarkson                      7
New Hampshire                 7
Dartmouth                     4
Women's hockey:
               Championships   Final

Minnesota-Duluth     5          6
Minnesota            5          7
Wisconsin            4          6
Clarkson             1          1
Harvard                         4
Numbers are for 2001-2017. All teams with at least one placement in the top 3 are included.
                  Champ  2nd  3rd

Manchester U        7     3    3
Chelsea             5     4    3
Arsenal             2     4    4
Manchester City     2     2    2
Liverpool                 3    3
Tottenham                 1    1
Leicester City      1
Newcastle U                    1
12 teams qualified from the 2015 World Cup by placing in the top three of their pool. The Oceana regional qualifier conributes 2 teams and the Americas regional qualifier contributes 2 teams. The best teams from regional qualifiers not yet already qualified then played a cross-regional qualifier to decide 4 more teams.
           Qualified from    Regional     Cross-regional
           2015 World Cup    qualifier    qualifier

Oceana     New Zealand       Fiji         Samoa
           Ausralia          Tonga        Tahiti

Europe     Scotland
           Wales
           Ireland
           France
           England
           Italy
           Georgia

Americas   Argentina         USA          Canada
                             Uruguay

Asia       Japan

Africa     South Africa
                                                 New Zealand
                                 New Zealand     France
                 New Zealand
                                 South Africa    Wales
                                                 South Africa
New Zealand
                                                 Argenina
                                 Argenina        Ireland
                 Ausralia
                                 Ausralia        Scotland
                                                 Ausralia


Rank   Pool A       Pool B         Pool C        Pool D

  1    Ausralia     South Africa   New Zealand   Ireland
  2    Wales        Scotland       Argentina     France
  3    England      Japan          Georgia       Italy
  4    Fiji         Samoa          Tonga         Romania
  5    Uruguay      USA            Namibia       Canada
The 2015 World Cup has 20 teams. 12 qualified based on 2011 World Cup results, 7 qualifed based on regional tournaments, and 1 qualified based on a repechage tournament.
                   Oceana          Europe       Americas      Africa        Asia

Qualified from     New Zealand     England      Argentina     S. Africa
2011 World Cup     Australia       France
                   Samoa           Wales
                   Tonga           Scotland
                                   Ireland
                                   Italy

Regional           Fiji            Georgia      Canada        Namibia       Japan
qualifiers                         Romania      USA

Repechage                                       Uruguay
Repechage bracket:
                        Uruguay
            Uruguay     Hong Kong
Uruguay
            Russia      Zimbabwe
                        Russia
Data since the formation of the World Cup in 1987.
                                                  20 20 20 20 19 19 19 19
           Win Final Semi Quar Pool               15 11 07 03 99 95 91 87

New Zealand  3    1    3    1         New Zealand  1  1  4  3  3  2  3  1
Australia    2    2    2    2         Australia    2  3  4  2  1  4  1  3
S. Africa    2         2    2         S. Africa    3  4  1  4  3  1
England      1    2    1    3    1    England      5  4  2  1  4  3  2  4
France            3    3    2         France       4  2  3  3  2  3  4  2
Wales                  2    3    3    Wales        4  3  5  4  4  5  5  3
Argentina              2    2    4    Argentina    3  4  3  5  4  5  5  5
Scotland               1    6    1    Scotland     4  5  4  4  4  4  3  4
Ireland                     6    2    Ireland      4  4  5  4  5  4  4  4
Canada                      1    7    Canada       5  5  5  5  5  5  4  5
Italy                            8    Italy        5  5  5  5  5  5  5  5
Romania                          8    Romania      5  5  5  5  5  5  5  5
Samoa                       2    5    Samoa        5  5  5  5  5  4  4
Fiji                        2    5    Fiji         5  5  4  5  5     5  4
USA                              7    USA          5  5  5  5  5     5  5
Japan                            7    Japan        5  5  5  5  5     5  5
Tonga                            7    Tonga        5  5  5  5  5  5     5
Namibia                          5    Namibia      5  5  5  5  5
Georgia                          4    Georgia      5  5  5  5
Uruguay                          3    Uruguay      5        5  5
Zimbabwe                         2    Zimbabwe                       5  5
Russia                           1    Russia          5
Portugal                         1    Portugal           5
Spain                            1    Spain                    5
Ivory Coast                      1    Ivory Coast                 5

                                                   1: Win
                                                   2: Final
                                                   3: Semifinal
                                                   4: Quarterfinal
                                                   5: Pool
Hockey World Championships, 2010-2017.
         Win Final Semi Quar Pool

Russia     2   4    7    8    8
Sweden     2   3    5    8    8
Canada     2   3    3    8    8
Finland    1   3    6    8    8
Czech Rep  1   1    5    8    8
USA                 3    7    8
Switz.         1    1    4    8
Slovakia       1    1    2    7
Germany             1    4    8
Norway                   2    8
Denmark                  2    8
Belarus                  2    8
France                   1    8
Latvia                        8
Latvia                        5
Slovenia                      5
Italy                         4
Kazakhstan                    4
Austria                       3
Hungary                       1
1: Win
2: Final
3: Semifinal
4: Quarterfinal
5: Pool

            17 16 15 14 13 12 11 10

Canada       2  1  1  4  4  4  4  4
Finland      3  2  4  2  3  3  1  4
USA          4  3  3  4  3  4  4  5
Sweden       1  4  4  3  1  4  2  3
Russia       3  3  2  1  4  1  3  2
Czech Rep    4  4  3  3  4  3  3  1
Germany      4  4  5  5  5  5  4  3
Switzerland  4  5  4  5  2  5  5  4
Denmark      5  4  5  5  5  5  5  4
Latvia       5  5  5  5  5  5  5  5
Slovakia     5     5  5  4  2  5  5
Norway       5  5  5  5  5  4  4  5
Belarus      5  5  4  4  5  5  5  5
France       5  5  5  4  5  5  5  5
Slovenia     5  5  5     5     5
Italy        5        5     5     5
Kazakhstan      5     5     5     5
Austria            5     5     5
Hungary         5
Cricket World Cup, 1987-2015.
           Win Final Semi Quar Pool

Australia    5   6    6    8    8
Sri Lanka    1   3    4    7    8
India        1   2    5    7    8
Pakistan     1   2    4    6    8
New Zealand      1    5    8    8
England          2    2    5    8
South Africa          4    6    7
West Indies           1    6    8
Zimbabwe                   4    8
Kenya                 1    1    5
Bangladesh                 2    5
Netherlands                     4
Ireland                    1    3
Scotland                        3
Canada                          3
UAE                             2
Afghanistan                     1
Bermuda                         1
Namibia                         1
1: Win
2: Final
3: Semifinal
4: Quarterfinal
5: Pool

             15 11 07 03 99 96 92 87

Australia     1  4  1  1  1  2  4  1
Sri Lanka     4  2  2  3  5  1  4  4
India         3  1  5  2  4  3  4  3
New Zealand   2  3  3  4  3  4  3  4
Pakistan      4  3  5  5  2  4  1  3
England       5  4  4  5  5  4  2  2
West Indies   4  4  4  5  5  3  4  4
South Africa  3  4  3  5  3  4  3
Zimbabwe      5  5  5  4  4  5  4  4
Kenya            5  5  3  5  5
Bangladesh    4  5  4  5  5
Netherlands      5  5  5     5
Ireland       5  5  4
Scotland      5     5     5
Canada           5  5  5
UAE           5              5
Afghanistan   5
Bermuda             5
Namibia                5
Numbers are league rank.
Year               17  16  15  14 13 12 11 10  9  8  7  6  5  4  3  2  1  Champ  2nd  3rd

Manchester U        6   5   4   7  1  2  1  2  1  1  1  2  3  3  1  3  1    7     3    3
Chelsea             1  10   1   3  3  6* 2  1  3  2  2  1  1  2  4  6  6    5     4    3
Arsenal             5   2   3   4  4  3  4  3  4  3  4  4  2  1  2  1  2    2     4    4
Manchester City     3   4   2   1  2  1  3  5 10  9 14 15  8 16  9    18    2     2    2
Liverpool           4   8   6   2  7  8  6  7  2  4  3  3- 5  4  5  2  3          3    3
Tottenham           2   3   5   6  5  4- 5  4  8 11  5  5  9 14 10  9 12          1    1
Leicester City     12   1  14                                18    20 13    1
Newcastle U            18  15  10 16  5 12    18 12 13  7 14  5  3  4 11               1
Everton             7  11  11   5  6  7  7  8  5  5  6 11  4 17  7 15 16
Aston Villa            20  17  15 15 16  9  6  6  6 11 16 10  6 16  8  8
West Ham U         11   7  12  13 10    20 17  9 10 15  9       18  7 15
Sunderland         20  17  16  14 17 13 10 13 16 15    20       20 17  7
Stoke City         13   9   9   9 13 14 13 11 12
West Bromwich      10  14  13  17  8 10 11    20       19 17    19
Southampton         8   6   7   8 14                      20 12  8 11 10
Crystal Palace     14  15  10  11                         18
Swansea City       15  12   8  12  9 11
Burnley            16      19
Watford            17  13
Hull City          18      18  16          19 17
Middlesbrough      19                         19 13 12 14  7 11 11 12 14
Norwich City           19      18 11 12                   19
Queens Park                20     20 17
Fulham                         19 12  9  8 12  7 17 16 12 13  9 14 13
Cardiff City                   20
Wigan Athletic                    18 15 16 16 11 14 17 10
Reading                           19
Bournemouth         9  16
Boston Wanderers                     18
Blackburn Rovers                     19 15 10 15  7 10  6 15 15  6 10
Wolverhampton                        20 17 15                20            Wanderers
Bolton Wanderers                        14 14 13 16  7  8  6  8 17 16
Birmingham City                         18  9    19    18 12 10 13
Blackpool                               19
Burnley                                    18
Portsmouth                                 20 14  8  9 17 17 13
Reading                                          18  8
Derby County                                     20                19 17
Sheffield U                                         18
Charlton Athletic                                   19 13 11  7 12 14
Watford                                             20                 9
Leeds United                                                 19 15  5  4
Ipswich Town                                                       18  5
Coventry City                                                         19
Bradford City                                                         20
Varsity Club Championship teams:
Arizona State     Air Force       Arkansas State    BYU       California
Cent. Washington  Clemson         Dartmouth         Navy      Notre Dame
Oklahoma          Texas           UCLA              UTAH
Division 1-A Rugby:
East:        Army,  Delaware,  Kutztown,  Penn State,  Wheeling Jesuit
             St. Bonaventure,  Iona,  University at Buffalo
Mid-South:   Lindenwood,  Life University,  Davenport University
California:  Cal Poly,  Saint Mary's,  UC Davis,  San Diego State,
             UC Santa Barbara,  Santa Clara,  Sacramento State,  Stanford
West:        Colorado,  Colorado State,  Wyoming  Northern Colerado,  New Mexico


            Championships

California       25
BYU               4
Air Force         3
Harvard           1
San Diego State   1
The Varsity Club conference was formed in 2013.
http://en.wikipedia.org/wiki/Varsity_Cup_Championship
http://en.wikipedia.org/wiki/Division_1-A_Rugby
                      Team    Population    Money

League of Legends       5
Soul Caliber            1
Call of Duty
 |
|---|
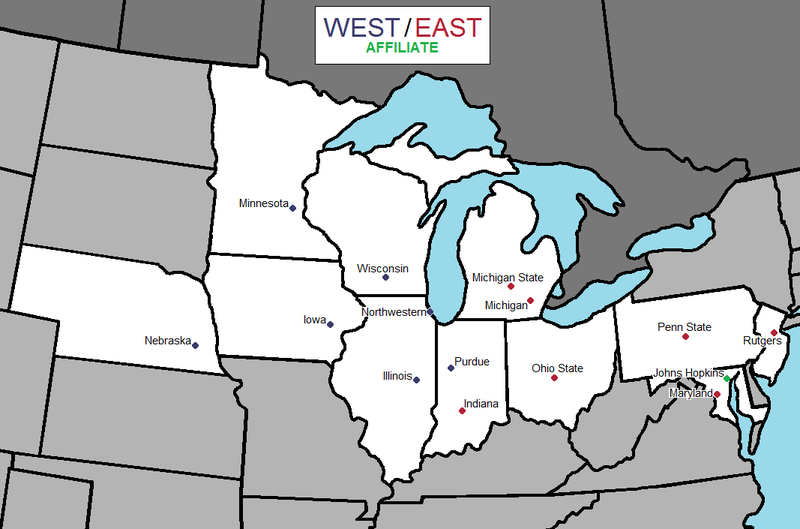
Big 10 East    Ohio St.   Michigan    Penn St.    Mich St.    Purdue      Maryland   Rutgers
Big 10 West    Wisconsin  Nebraska    Iowa        Northwest   Minnesota   Illinois   Indiana

SEC East       Florida    Georgia     S. Carol.   Kentucky    Missouri    Vander     Tennessee
SEC West       Alabama    Auburn      LSU         Miss  St.   Texas AM    Miss       Arkansas

ACC Atlantic   Clemson    NC State    Boston C.   Louisville  Wake Forest Florida St Syracuse
ACC Coastal    Miami      Virginia T  Georg Tech  Virginia    Pittsburgh  Duke       N. Carol

Pac 10 North   Stanford   Oregon      Washington  Wash St     Oregon St.  Cal
Pac 10 South   UCLA       USC         Arizona     Arizona St  Colorado    Utah

Big 12 North   Oklahom    Okla St     Iowa St     Kansas      Kansas St.
Big 12 South   Texas      TCU         Baylor      Texas Tech  W. Virginia

C-USA  East    Flor Atl   FIU         Marshall    W Kentucky  M Tenn      Old Dominion  Charlotte
C-USA  West    N Texas    UAB         S Miss      Louis Tech  UTSA        Rice          UTEP

AAC    East    UCF        S Florida   Temple      Cincinnati  Connecticut E Carolina
AAC    West    Memphis    Houston     SMU         Navy        Tulane      Tulsa

MW     Mount   Boise St   Colorado S  Wyoming     Utah St     Air Force   N Mexico
MW     West    Fresno St  SDiego St   UNVL        Nevada      Hawaii      San Jose St

MAC    East    Akron      Ohio        Miami       Buffalo     Bowl Green  Kent St
MAC    West    Toledo     C Michigan  N Illinois  W Michigan  E Michigan  Ball St

Sun Belt       Troy       AppalachSt  Arkans St   Georgia St  N Mexico St Louisiana
               Lou-Monroe Idaho       S Alabama   CoastCarol  Georgia S   Texas St


Big East       Pioneer           Atlantic 10      West Coast       Missouri Valley

Butler         Butler            Davidson         BYU              N Iowa
Creighton      Davidson C        Duquesne         Gonzaga          Illinois State
DePaul         Drake U           Fordham          Loyola Marymount Southern Illinois
Georgetown     Jacksonville U    George Mason     Pacific          Indiana State
Marquette      Marist College    George Washing   Pepperdine       Loyola U Chicago
Providence     Morehead St U     La Salle         Portland         Missouri State
St. John's     U San Diego       U Massachusetts  St Mary's        Drake
Seton Hall     Stetson U         Rhode Island     U San Diego      Valparaiso
Villanova      Valparaiso U      Richmond         U San Francisco  Bradley
Xavier         U Dayton          St Bonaventure   Santa Clara      U Evansville
                                 St Joseph's
                                 St Louis
                                 Virginia Common
                                 U Dayton


       Teams   Conference games

Big 10   14      9
SEC      14      8
Pac 10   12      9
Big 12   10      9
ACC      14      8      Atlantic Coast Conference
AAC      12      8      American Athletic Conference
C-USA    14      8      Conference USA
MAC      12      8      Mid American
MW       12      8      Mountain West
SB       12      8      Sun Belt


NCAA basketball:

Division  Conferences  Teams
   1          32        351
   2          23
   3          45
               Mir  Mioc  Werd  Over  Lesn  Vela  Sant  Hunt  Arlo  Silv  Cout  Carw  Nogu   Win  Loss

Stipe Miocic               +     +                 +-    +     +                              5    1
Cain Velasquez             -           +           ++-               ++                +      6    2
A. Overeem     +     -     ++-         +           +     +     +     -                 --     7    5
F. Werdum            -           +--         +     -     +     -     +                 +-     5    6
Frank Mir                        -     +-          -     -     -     +           +     ++     5    5
Brock Lesnar   +-                -           -                             +     +            3    3
J. dos Santos  +     +-    +     -           +--         +                       +            6    4
Mark Hunt      +     -     -     -                 -                 +o                       2    4
A. Arlovski    +     -     +     -                                   ++                       4    2
Antonio Silva  -           -     +           --          -     +-                             2    6
Randy Couture                          -                                               -      0    2
Shane Carwin   +                       -           -                                          1    2
A. Nogueira    --          +-                -                             +                  2    3

+: Victory
-: Defeat
o: Draw
For example, Miocic defeated Werdum


               Holm  Tate  Rousey  Zing  Nunes  Penn  Pena  McMann  Eye  Kaufman  Shev  Davis
Holly Holm            -      +                   +                                 -     f
Miesha Tate      +           -      -      -     -            +      +     -
Ronda Rousey     -    +             +      -                  +            +             +
Cat Zingano           +      -             +     +     -
Amanda Nunes          +      +      -                         +                    ++    -
Raq. Pennington  -    +             -
Julianna Pena                       +                                +             -
Sarah McMann          -      -             -                         +                   +
Jessica Eye           -                                -      -                          -
Sarah Kaufman         +      -                                                     -     +-
Val. Shevchenko  +                         --          +                   +
Alexis Davis                 -             +                  -      +     +-
Ger. de Randamie +                         -
               Honinbo  Meijin  Kisei  Tengen  Oza  Gosei  Judan   Birth

Cho Chikun       12       9       8      2      2     2      6     1956
Iyama Yuta        5       5       5      5      4     5      4     1989
Cho U             2       4       3      1      7     4      2     1980
Yamashita Keigo   2       2       5      2      2     1            1978
Takao Shinji      3       2              1                   2     1976
Yoda Norimoto             4                           6      2     1966
O Rissei                          3             4            4     1972
Hane Naoki        2               2      3            1            1976
O Meien           2                             1                  1961
               ELO

Ke Jie         3620
Park Junghwan  3593
Mi Yuting      3571
Shin Jinseo    3537
Iyama Yuta     3525
Lian Xiao      3524
Lee Sedol      3516
                 Men      Women
   50 meter      5.47      5.96  seconds
   60 meter      6.31      6.92  seconds
  100 meter      9.58     10.49  seconds
  200 meter     19.19     21.34  seconds
  400 meter     43.18     47.60  seconds
  800 meter    100.91    113.28  seconds
 1000 meter    131.96    148.98  seconds
 1500 meter    206.00    230.07  seconds
 5000 meter  12:37.35  14:11.15  seconds
10000 meter  26:17.53  29:31.78  seconds
Marathon      2:02:57   2:17:42  seconds
40 km         1:56:29            seconds
90 km         5:20:49            seconds
4x100 meter     36.84     40.82  seconds
4x200 meter     78.63     87.46  seconds
4x400 meter    174.29    195.17  seconds
High jump        2.45      2.09  meters
Pole vault       6.16      5.06  meters
Long jump        8.95      7.52  meters
Shot put        23.12     22.63  meters    Men=7.26 kg.  Women=4.0 kg
Discus          74.08            meters
Hammer          86.74            meters
Javelin         98.48     72.28  meters
Broad jump       3.73            meters
Baseball pitch  46.98     30.85  meters/second