
|
|
|
|
|
|
|---|---|---|---|---|---|
To start python, open a terminal and type "python". From here you can type python commands. For example,
>>> print 1. * 2.
2.0
>>> x = 2.
>>> y = 3.
>>> print x*y
6.0
>>> # Anything typed after a "#" is ignored by python
>>> def function(x,y)                  # Define a function
...   function = x*y                   # The content of a function must be indented
...   return function
...                                    # Type "return" to end the function
>>> print function(x,y)
6.0
>>> exit()                             # Exits the python session
If you have a file on disk called "program.py", you can load it and run it with
>>> import program as program # Loads and runs file "program.py"Once a program has been loaded, it can be reloaded and run by typing
>>> reload(program)if a program has already been loaded and you type "import program as program", the program will not be run. running it requires "reload(program)"
It may be necessary to load the "reload" package.
>>> from importlib import reload
to use a library you have to first import it. for example, to use the numpy library,
>>> import numpy as numpy
>>> print numpy.log(10.)
2.30258509299

                        -----------------------------------
the first few lines of a typical python program usually consists of import statements.
the following program imports a comprehensive set of libraries.
#!/usr/bin/env python
import numpy                as numpy
import math                 as math
import pylab                as pylab
import pil                  as pil
import os                   as os
import sys                  as sys
import matplotlib           as matplotlib
import matplotlib.pyplot    as plt
import matplotlib.image     as mpimg
import image                as image
import matplotlib.animation as animation
int      could be int32 or int64.  depends on the system.
int8     128 to 127
int16    -32768 to 32767
int32    -2147483648 to 2147483647
int64    -9223372036854775808 to 9223372036854775807
uint8    0 to 255
uint16   0 to 65535
uint32   0 to 4294967295
uint64   0 to 18446744073709551615
float    = float64
float16  half precision float:   sign bit,  5 bits exponent, 10 bits mantissa
float32  single precision float: sign bit,  8 bits exponent, 23 bits mantissa
float64  double precision float: sign bit, 11 bits exponent, 52 bits mantissa

>>> i = 1        defines "i" to be an integer with value "1".
>>> x = 1.       defines "x" to be a float with value "1.".  the "." designates a float
>>> x = 1.e10    defines "x" to be a float with value 1*10^10
python functions do not change the values of parameters passed to them. for example,
>>> def zzz(x):
...   x = x + 1.
...
>>> x = 2.
>>> zzz(x)
>>> print x
2.0
>>> numpy.random.random()                # generate a random number from 0. to 1.
>>> os.system("ls")                      # sends the "ls" command to the terminal shell
>>> array = numpy.zeros([2,3],float) # create an array
>>> numpy.shape(array)               # obtain dimensions of an array
(2, 3)
>>> numpy.amax(array)                # maximum element in array
0.0
>>> numpy.int(1.5)                   # convert to integer
>>> numpy.float(1)                   # convert to float
>>> str(9)                           # convert to string
>>> repr(9)                          # convert to machine readable string
>>> print 1
1
>>> print 1.
1.0
>>> print 'iron'
iron
>>> print repr(123).rjust(3)
123
>>> print repr(23).rjust(3)
 23
>>> print repr(12).ljust(3)
12
>>> print repr(2).center(3)
 2
>>> print '{:4d}'.format(42)
  42
>>> s = "%.3f" % 12.345678       #float to string
>>> print("%.2f" % 3.14159)
  3.14
>>> print '{:06.2f}'.format(3.14159)
  3.14
>>> print '{:06.2f}'.format(3.14159)
003.14
>>> print '{:>6}'.format('test')      #right justify
  test
>>> print '{:6}'.format('test')       #left justify
test
>>> print '{:^6}'.format('test')      #center
 test
>>> print 1,                          #no newline
1
>>> for j in range(4):
  print j,                            #no newline
0 1 2 3
file = open('file.txt','r')
while (1 = 1):
  line = file.readline()
  if not line:  break
  print line.split()[0]
  print line.split()[1]

file = open('file.txt','w')
file.write('string')
file.close()
def plot1():
  plt.close()
  fig  = plt.figure(figsize=(10,10),dpi=100,facecolor='black')   # 10x10 inches, 100 dpi
  axes = fig.add_axes([.05,.05,.95,.95])
  axes.xaxis.set_visible(true);axes.set_xlim([0.,1.])
  axes.yaxis.set_visible(true);axes.set_ylim([0.,1.])
  im = image.new("rgb",(1000,1000),"white")
  x = numpy.zeros([21],float)
  y = numpy.zeros([21],float)
  for j in range(0,21):
    x[j] = .05*float(j)
    y[j] = x[j]*x[j]
  axes.plot(x,y,color='green',lw=1,ls='-',marker='',markersize=3)
  axes.plot(x,y,color='blue',lw=1,ls='',marker='o',markersize=10)
  axes.text(.5,.1,'text',color='green',ha='center',va='center',fontsize=20)
  plt.imshow(im,extent=[0.,1.,0.,1.])
  plt.savefig('plot1.png')
the "plot" and "scatter" commands have the following marker types:
'.'  =  point
','  =  pixel
'o'  =  circle
'^'  =  triangle up
'v'  =  triangle down
'<'  =  triangle left
'>'  =  triangle right
'8'  =  octagon
's'  =  square
'p'  =  pentagon
'*'  =  star
'h'  =  hexagon 1
'h'  =  hexagon 2
'+'  =  plus
'x'  =  x
'd'  =  diamond
'd'  =  thin diamond
'|'  =  vertical line
'-'  =  horizontal line
''   =  blank
'$ $'=  render the string using mathtext
'tickup'     =  tick up
'tickdown'   =  tick downup
'tickleft'   =  tick left
'tickright'  =  tick right
'caretup'    =  caret up
'caretdown'  =  caret downup
'caretleft'  =  caret left
'caretright' =  caret right
line types:
'-'  =   solid
'--' =   dashed
'-.' =   dash dot
':'  =   dotted
to make an open circle, plt.plot(x,y,color='red',lw=1,ls='-',marker='o',markersize=6,markeredgewidth=1.,markerfacecolor='none',markeredgecolor='red')
 |
|---|
 |
|---|
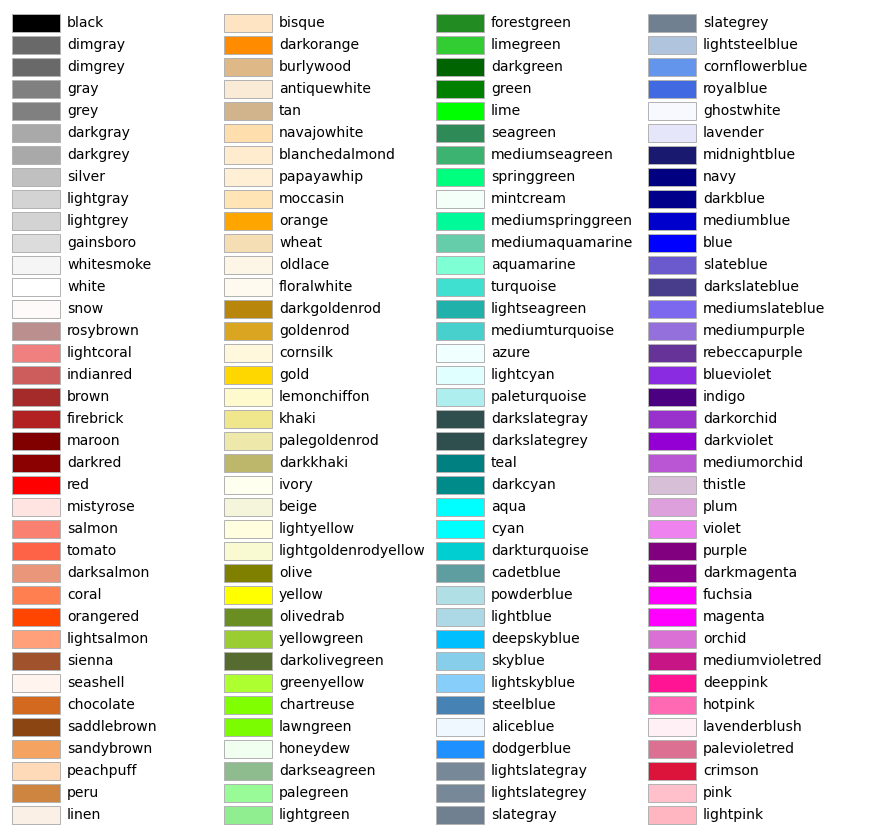
in the colormap command, "z" is a variable from 0 to 1.
>>> color = matplotlib.cm.hot(z)
Divide the color spectrum into 12 discrete colors:
Color name    Red   Green   Blue

red           255      0      0
orange        255    128      0
yellow        255    255      0
chartreuse    128    255      0
green           0    255      0
teal            0    255    128
cyan            0    255    255
azure           0    128    255
blue            0      0    255
purple        128      0    255
magenta       255      0    255
crimson       255      0    128
img = image.open('jupiter.jpg')         # read image.  3d array of integers from 0 to 255
img = image.new("rgb",(10,10),"black")  # create image. 3d array of integers from 0 to 255
plt.imshow(img,extent=[0.,1.,0.,1.])    # plot image
plt.savefig('plot.png')                 # save image
upside_down = img.transpose(flip_top_bottom)     # flip image vertically
left_right  = img.transpose(flip_left_right)     # flip image horizontally
image.rotate(90)           #rotate by 90 degree
img.show()
img.save('filename')
img.resize((100,100))
print img.size, img.mode, img.format    #format is something like "jpeg" and mode is something like "rgb". size is a two-element object
arr = numpy.asarray(img)                #convert an image to an array
arr = numpy.array(img)
img2 = image.fromarray(arr)             #convert an array to an image

fig = plt.figure()
fig.tight_layout(pad=0)
fig.canvas.draw()
arr = np.fromstring(fig.canvas.tostring_rgb(), dtype=np.uint8, sep='')
arr = data.reshape(fig.canvas.get_width_height()[::-1] + (3,))
images     #array of images
images[0].save('ani.gif',save_all=true,append_images=images[1:],duration=100,loop=0)
  #duration is the time between frames in milliseconds
  #loop is the number of times the animation repeats
save_animated_gif('simple-gif.gif', frames, 1/frate)

import imageio
imageio.mimsave(outputfile,images,duration=duration)
Netpbm can convert a ppm to a gif.
> apt install netpbm
> ppmtogif image.ppm > image.gif
Python can be downloaded from https://www.python.org/downloads
You will also want to install the following numerical and plotting libraries.
Numpy        http://www.numpy.org
Matplotlib   http://matplotlib.org/downloads.html
Scipy        http://www.scipy.org/scipylib/download.html
"Basemap" is a utility for generating maps. http://www.scipy.org/scipylib/download.html
To install "pip", > python -m ensurepip --default-pip
To install with pip, > pip install mendeleev
2023:
brew install gfortran
python3
Success:
pip3 install matplotlib==3.3.4
scipy
geopy
nuclyr
nucml
npat
convert. installed but not found
netpbm. installed but not found
gifsicle. package not found
imagemagick. package not found
Already present:
os
pylab
csv
Fail:
pyne. Installs but doesn't load PIL Basemap openmc doesn't install python3.11 -m pip install --upgrade pip pip3 install basemap
To install bash, first make sure that you have installed the Windows 10 Aniversary Update.
Instructions for installing bash on Windows 10.
Python is included in bash but it includes few libraries. "math" is one of the only ones. To install more libraries, type:
> sudo apt-get install python-numpy
> sudo apt-get install python-scipy
> sudo apt-get install python-matplotlib
> sudo apt-get install python-mpltoolkits.basemap
To remove a library type:
> sudo apt-get autoremove python-numpy
from mpl_toolkits.basemap import Basemap
m = Basemap(projection='merc',llcrnrlat=y1,urcrnrlat=y2,llcrnrlon=x1,urcrnrlon=x2,lat_ts=0,resolution='i')        #Resolution options: c, l, i, h, f
m = Basemap(projection='aeqd',width=width,height=width,lat_0=lat_0,lon_0=lon_0)  #Equidistant from center
m = Basemap(projection='ortho',lon_0=-105,lat_0=40,resolution='l')     #view from infinitely high satellite
m.drawcoastlines(color='white',linewidth=1.0,linestyle='solid',antialiased=1,ax=None,zorder=None)
m.fillcontinents(color='black',lake_color='black')
m.drawmapboundary(fill_color='black')       # Ocean color
m.drawcountries(color='black')
m.drawstates()
m.drawcounties()
m.drawrivers()
m.drawlsmask(land_color='coral',ocean_color='aqua',lakes=True)
m.bluemarble()   #Satellite view, with ocean floor
m.etopo()     #Land and ocean topography. Looks nicer than shadedrelief()
m.shadedrelief()   #Land and ocean topography
Create an animated gif from a set of still images.
> im.save('out.gif', save_all=True, append_images=[im1, im2, ...])
Python can be run online at Cloud 9.
Useful chromatic color sequence: ['maroon','darkred','red','orange','goldenrod','gold','yellow','yellowgreen','green','cyan','blue','magenta','purple']
netpbm
imagemagick
mogrify
convert
ffmpeg
youtube-dl
scipy
matplotlib
geopy
gmplot
pandas
br>
geopandas
mpltoolkits.basemap
mpltoolkits.basemap-data
cartopy
pil
libgeos-dev
pyqtgraph DNE
pyqt5 DNE