
|
|
|
|
|
|
|---|---|---|---|---|---|
 |
 |
 |
 |
 |
.jpg) |
|
|---|---|---|---|---|---|---|
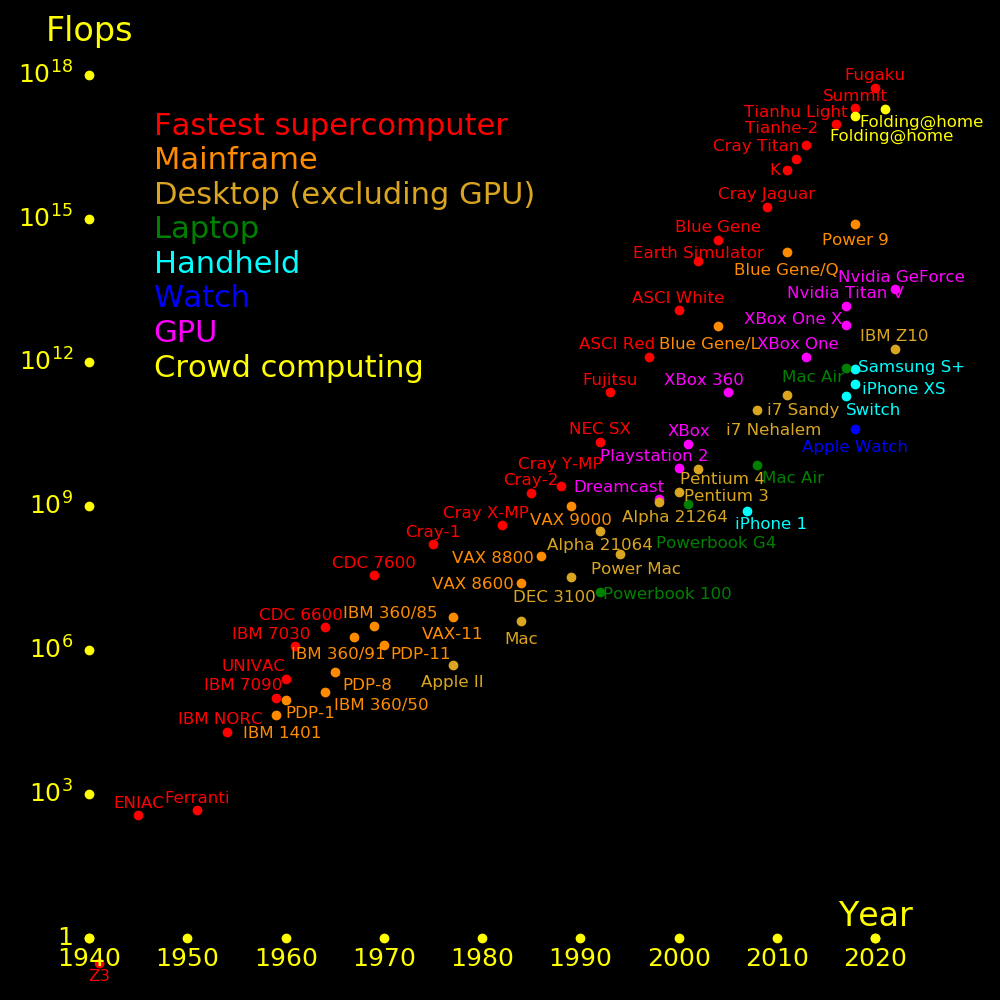
A modern wristwatch is more powerful than a 1990 supercomputer.
Desktop gaming is driven by speed/$ and mobile gaming is driven by speed/Watt.
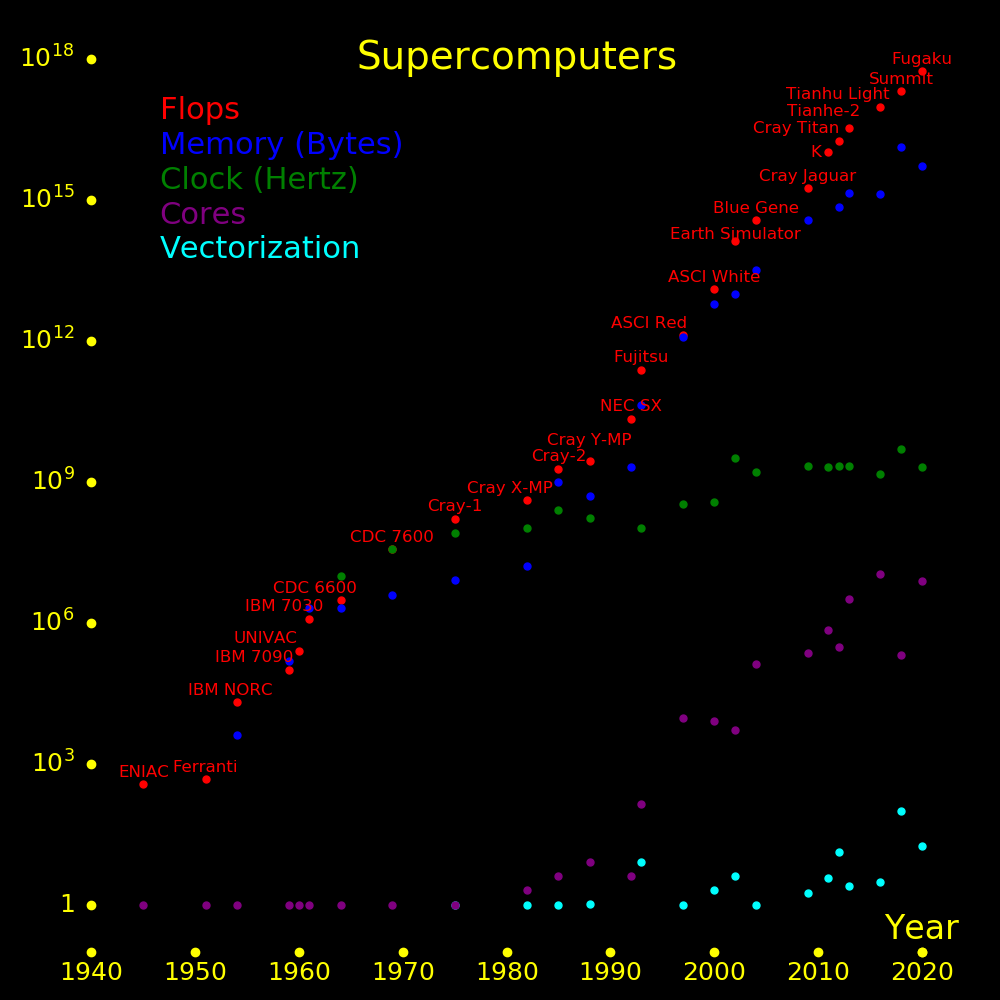
Clock speed once advanced exponentially but has since maxed out. Engineers turned to parallelization and vectorization, which the basis of GPUs. GPUs are used for both gaming and supercomputing.
The history of supercomputers is:
 |
|---|
Speed per dollar, CPU   =    2  GFlop/$
Speed per dollar, GPU   =   40  GFlop/$
Memory, RAM             =   .2  GByte/$
Memory, solid state     =    7  GByte/$
Memory, disk            =   33  GByte/$
Speed per power         =  200  GFlop/Watt   (GPU)

Battery energy per mass = 1000  MJoule/kg
Battery power  per mass = 1000  Watt/kg
 |
|---|
Computation speed is measured in GFlops (Giga Floating point operations per second). A floating point operation (Flop) is an add or a multiply.
A "core" is an independent floating point unit. Different cores can do different computations.
A core produces an add and a multiply once every clock cycle, hence it produces 2 floating point operations per cycle.
A core can be "vectorized", which means that it does many adds and multiples simultaneously. For vectorization, each element in the vector has to do the same computation. Gaming hardware is heavily vectorized.
The speed of a supercomputer is
Supercomputer speed = S = 2FCV
Clock frequency     = F
Cores               = C
Vectorization       = V                Number of vectors per core
Supercomputing is fueled by Flops/$ and mobile computing is fueled by Flops/Watt.
For battery-powered computing, performance is determined by the following numbers:
Battery energy/mass   = 1200 kJoules/kg       (Lithium-polymer battery)
Computer speed/power  =  300 GFlops/Watt
Battery energy/mass advances slowly and processor speed/power advances rapidly. The way forward is to advance the speed/power of computers.
Define a unit of time as the duration of one clock cycle. In these units, the duration of various operations is:
          Clock cycles

If              1
Abs             1
+               3
-               3
*               3
/              12
Sqrt           16
exp            24
log            24
sin            24
cos            24

L0 access       1        Access to L0 memory
L1 access       3
L2 access      12
L3 access      24
Main memory   128
Parallel    10000        In a parallel computer, access to memory on a neighboring computer
SSD        100000        Access to a solid state drive.  25 microseconds
Disk     20000000        Access to a spinning disk.       5 milliseconds
Adds and multiplies are pipelined so that a CPU produces an add and a multiply each clock cycle. A pipeline is like an assembly line. It may takes many clock cycles to assemble something, but the assembly line produces a new output each cycle.
Memory is arranged in stages. The sizes of the stages is such that
L0 < L1 < L2 < L3 < Main memory
L0 is faster than L1, L1 is faster than L2, etc.
The speed of various gaming systems is:
GFlops
PC gaming system 15000 Backed by a Graphical Processing Unit (GPU), an Nvidia Quadro
XBox One X 6000
Playstation 4Pro 4200
Macbook Pro 2060
Macbook Air 768
Samsung S+ 727
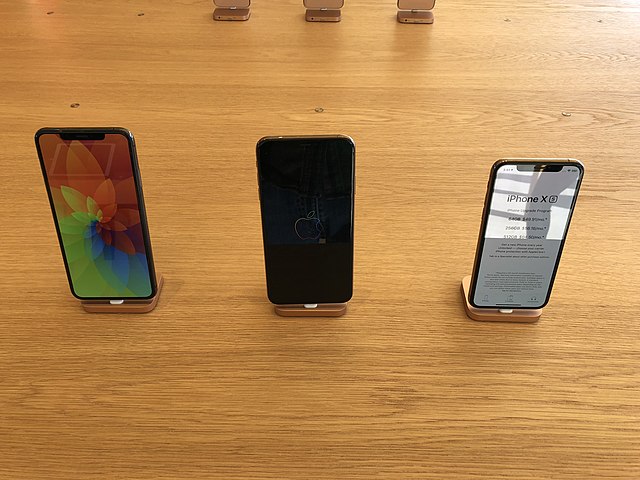
iPhone X 350
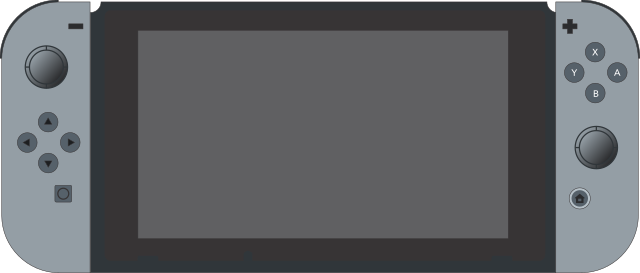
Nintendo Switch 195 Battery mode. 1000 GFlops on AC power
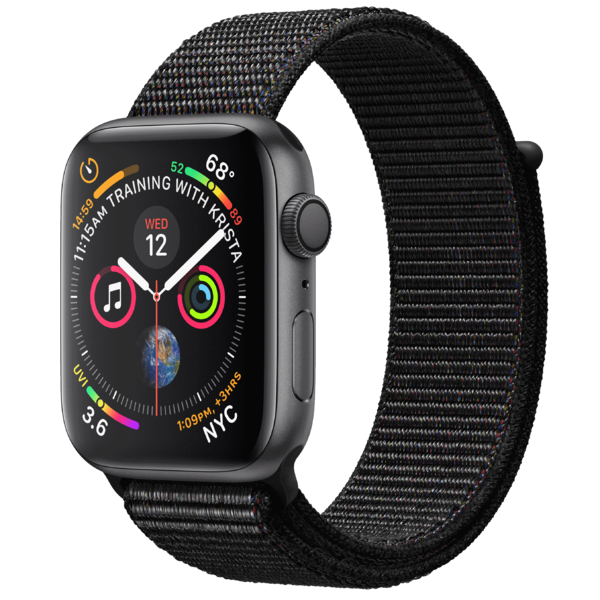
Apple Watch 4 40
The power consumption of various devices is:
           Display  Battery  Power  Mass  Energy/Mass  GFlops  GFlops
           inches   kJoule   Watt    kg   kJoules/kg           /Watt

Apple Watch 4  1.3     4.0    .11   .048      83        40     360
iPhone XSM     6      44     1.2    .21      210       350     290
iPad Mini      8      70     1.9    .30      230
iPad Pro      10     111     3.1    .47      240
Mac Air       11     137     3.8    1.0      140       768     200
Mac Pro       15     301     8.4    1.8      170      2060     240
We assume a battery life of 10 hours.
To calculate the speed of a machine, using the Samsung S+ as an example,
Machine mass        = M       =    .20 kg
Battery energy      = E       =  44000 Joules
Machine energy/mass = e = E/M =    220 kJoules/kg
Battery life        = T       =  36000 seconds = 10 hours      Typical lifetime for battery-powered devices
Power               = P = E/T =   1.22 Watts
Machine speed       = V       =    727 GFlops
Machine speed/power = v = V/P =    600 GFlops/Watt
For a machine on AC power, the critical number is GFlops/$, which is in the range of 12 GFlops/$.
               Speed    Memory    Cores   Cores   Clock  Disk    Year  Speed/Power  Cost
               Gflops   GByte      CPU     GPU     GHz   TByte         GFlop/Watt    M$

Aurora     2000000000 10900000  22600000 67800000                 2023   33          500
Frontier   1680000000             606208  8335360  2.0            2022   80          600
Fugaku      537000000  5090000   7630848           2.0            2020   13.4       1000
Summit      200000000 12900000    202752   598016  5.0   250000   2018   14.7
TiahuLight   93000000  1310000  10600000           1.45   20000   2016    6.2        273
Tianhe-2     33900000  1375000   3120000           2.2    12400   2013
Cray Titan   17600000   694000    299008           2.2    40000   2012    2.15        97
K Computer   10500000             710000           2.0            2011
Cray Jaguar   1750000   360000    224256           2.2            2009
Blue Gene      360000    32000    131000        0  1.6            2004
Earth Sim      131000    10000      5120           3.2      700   2002
ASCI White      12300     6000      8192            .375    160   2000
ASCI Red         1300     1212      9298        0   .333          1997
Fujitsu Wind      240       42       140            .105          1993
NEC SX-3/44        22        2         4                          1992
Cray Y-MP           2.7       .5       8        0   .167          1988
Cray-2              1.9      1         4        0   .244          1985
Cray X-MP            .4       .016     2        0   .105          1982
Cray-1               .16      .008     1        0   .08   .000303 1975
CDC 7600             .036     .036     1        0   .036          1969
CDC 6600             .002     .003     1        0   .002          1964
IBM 7030             .0012    .002     1        0   .0033         1961
UNIVAC LARC          .00025   .00073   1        0                 1960
IBM 7090             .0001    .00015   1        0                 1959
IBM NORC      19600 Flops     .000004  1        0                 1954
Ferranti Mk 1   460 Flops              1        0                 1951   First commercial computer
ENIAC           360 Flops              1        0                 1945
Z3               .3 Flops   64 Bytes   1        0                 1941   First programmable computer
Supercomputers tend to have 10 times as many Gflops as GBytes.
The largest crowd computing project runs at 137 PFlops (Folding@home).
The fastest supercomputer, "Summit", consists of 3 GPUs for each CPU. Each Power9 CPU has 2.8 TFlops and each Nvidia GV100 GPU has 7 TFs. Most of Summit&8217;s GFlops come from GPUs. The ratio of GPU GFlops to CPU GFlops is 7.5.
A processor consists of a CPU, with independent AMUs, and a GPU, where the AMUs all execute the same instruction. CPUs are divided into cores, and each core has a number of AMUs.
                CPU      Cores  AMUs  Clock   RAM    Power  Year
               Gflops           /core  GHz    GB     Watt

IBM Power9 rack 780000     792   16    5.0                  2018
IBM Power9        3840      24   16    5.0    600           2018
i9 9960X          1590      16   16?   3.1                  2018   No GPU        Skylake
i9 9900K           920       8   16?   3.6     95           2018   GPU=UHD 630   Coffee Lake
Xeon Plat 8168    4150      24   32    2.7    768    205    2017   No GPU   Skylake
Xeon Phi 7290F    6910      72   32    1.5    384    260    2016   No GPU
Xeon Phi SE10X    1074      61         1.1      8           2012
i7 Sandy           218       4    8    3.4                  2011
IBM Blue Gene/Q 210000   16384    4    1.6  16000           2011
i7 Nehalem         102       4    4    3.2                  2008
IBM Blue Gene/P  13900    4096    2     .85  2000           2007
IBM Blue Gene/L   5700    2048    2     .7    512           2004
Pentium IV           6       1    1    3.0                  2002
Pentium III          1.35    1    1    1.0                  2000
DEC Alpha 21264      1.2     1    1     .600                1998
DEC Alpha 21164       .6     1    1     .300                1995
DEC Alpha 21064       .3     1    1     .150                1992
DEC VAX 7000 6x0      .73    4    1     .091    3.5         1992
DEC 3100              .033   1    1     .0167    .024       1989
DEC VAX 9000         1.0     4    1     .0625               1989   125 MFlops GPU per core
DEC VAX 8800          .09    2    1     .022     .5         1986
DEC VAX 8600          .025   1    1     .0125    .256       1984
VAXstation I                 1          .004                1984
DEC VAX-11/780        .001   1     .1   .005     .002       1977
IBM 370/158           .00064 1     .037 .0087               1972
DEC PDP-11                   1          .00125    56k       1970
IBM 360/85            .0032  1                   .004       1969
IBM 360/91            .0019  1                   .004       1967
DEC PDP-8        350 kflops  1     .21  .00083    32k       1965
IBM 360/50       133 kflops  1     .033 .002     .0005      1964
DEC PDP-1         93 kflops  1     .25  .000187             1960
IBM 1401                     1          .000087             1959
UNIVAC I         1.9 kflops  1    .0004 .00225     3k       1952

Apple PowerMac               1          .10                 1994
Apple Mac II                 1          .016                1987
Apple Mac                    1          .008                1984
Apple II                     1          .001      64k       1977

Macbook Pro                  6         2.9     32           2018
Macbook Air        282       2    8    2.2      8           2017   i7 5650U. HD Graphics 6000   769 GFlops GPU
Powerbook G4                 1          .55      .25        2001
Powerbook 100                1          .016     .008       1992

XBox One X                   8         2.3     12    150    2017
Nintendo Switch              8         1.02     4      5    2017
iPhone XS                    6         2.5      4           2018
Samsung Galaxy S+            8         2.2      6           2018   CPU Kryo 385   GPU Mali-G72 MP18
Samsung Watch                2         1.15     1.5     .2  2018   Exynos 9110   6300 Joules  13x46x49 mm
Sony Watch 3        38       4    4    1.2       .5         2018   CPU Arm Cortex-A
Apple Watch 4                2         1.0       .5         2018   4010 Joules    16GB disk
Examples of GPUs:
               Speed    AMUs  Clock  RAM    Year   GPU model
               Gflops          GHz   GB

Nvidia Quadro   14800   5120   1.13   32    2018   GV100
Nvidia Quadro   16300   4608   1.35   50    2018   RTX 8000
Nvidia Tesla    14028   5120   1.36   16    2017   V100
Nvidia Titan V  13800   5120   1.2    12    2017
AMD Radeon Vega 13110   4096   1.6    16    2017

XBox One X       6000   2560   1.17   12    2017
Playstation 4Pro 4200  ~2300    .911   8    2016   AMD Radeon
Macbook Pro      2060   1024   1.0    32    2018   Radeon Pro 560X
Macbook Air       768    384   1.0     8    2017
Samsung S+        727    512    .71         2018   Adreno 630
iPhone X          350                       2018
Nintendo Switch   195    256    .38    4    2017

Playstation 4    1843   1150    .8     8    2013   AMD Radeon
XBox One         1310    768    .853   8    2013
Nintendo Wii U    352           .55         2012
Playstation 3     230                       2006
XBox 360          240           .50         2005
XBox               20           .233        2001
Nintendo Gamecube   9.4                     2001
Playstation 2       6.2         .30?        2000
Sega Dreamcast      1.4         .10         1998
 |
 |
|---|---|
1941  First programmable computer, built from vacuum tubes
1947  Transistor invented
1953  First transistor computer
1957  First Fortran compiler
1958  Kilby builds first integrated circuit
1963  Mouse
1971  8 inch floppy disk
The cost of a supercomputer is far larger than the cost of electricity to run it. For a supercomputer in 2018, typical numbers are:
Speed            =  V                  GFlops
Power            =  P                  Watt
Speed/Power      =  v  =  V/P  =   10  GFlops/Watt
Machine cost     =  C          =       $
Speed/cost       =  s  =  V/C  =   .4  GFlops/$
Time of operation=  T          =  1e8  seconds  =  3.2 years
Electric energy  =  E  =  P T
Energy/Dollar    =  e          =  4e8  Joules/$
Electricity cost =  c  =  E/e
Cost ratio       =  R  =  c/C  = Ts/(ev) = .01