
|
|
|
|
|
|
|---|---|---|---|---|---|
 |
|---|
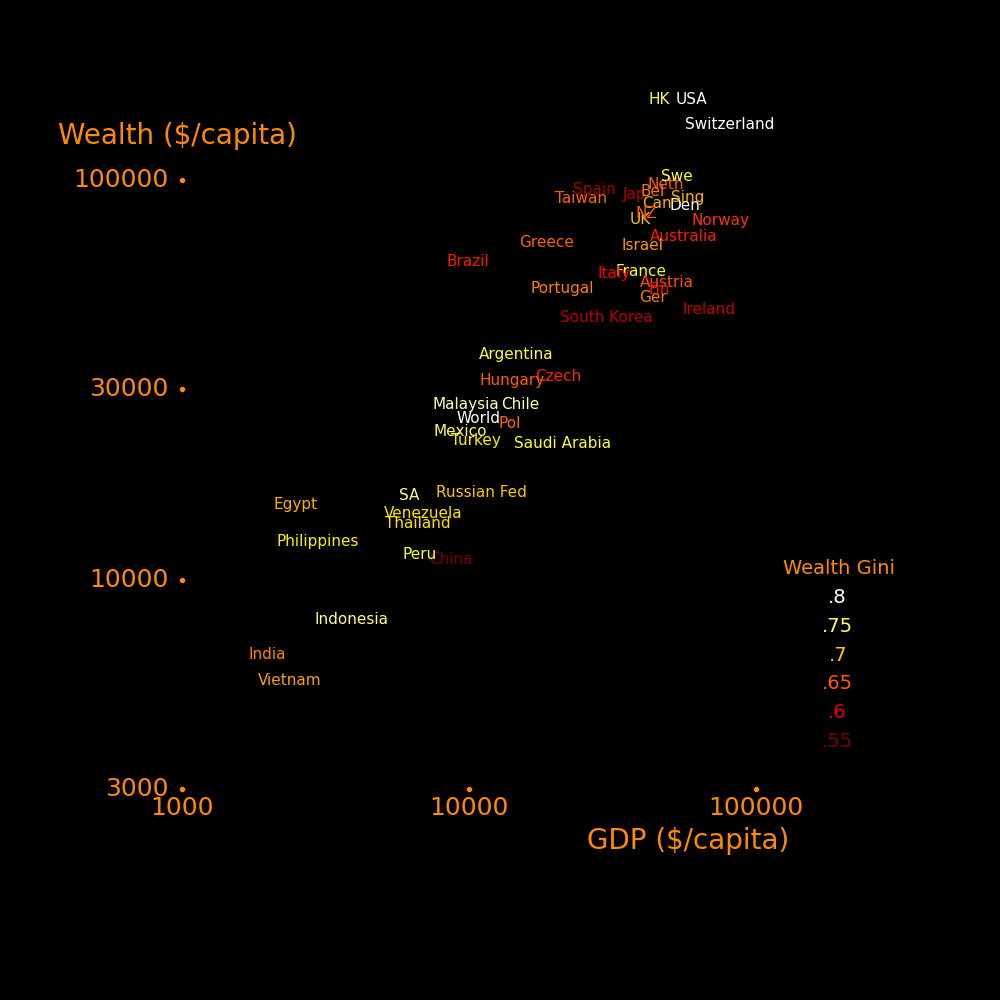
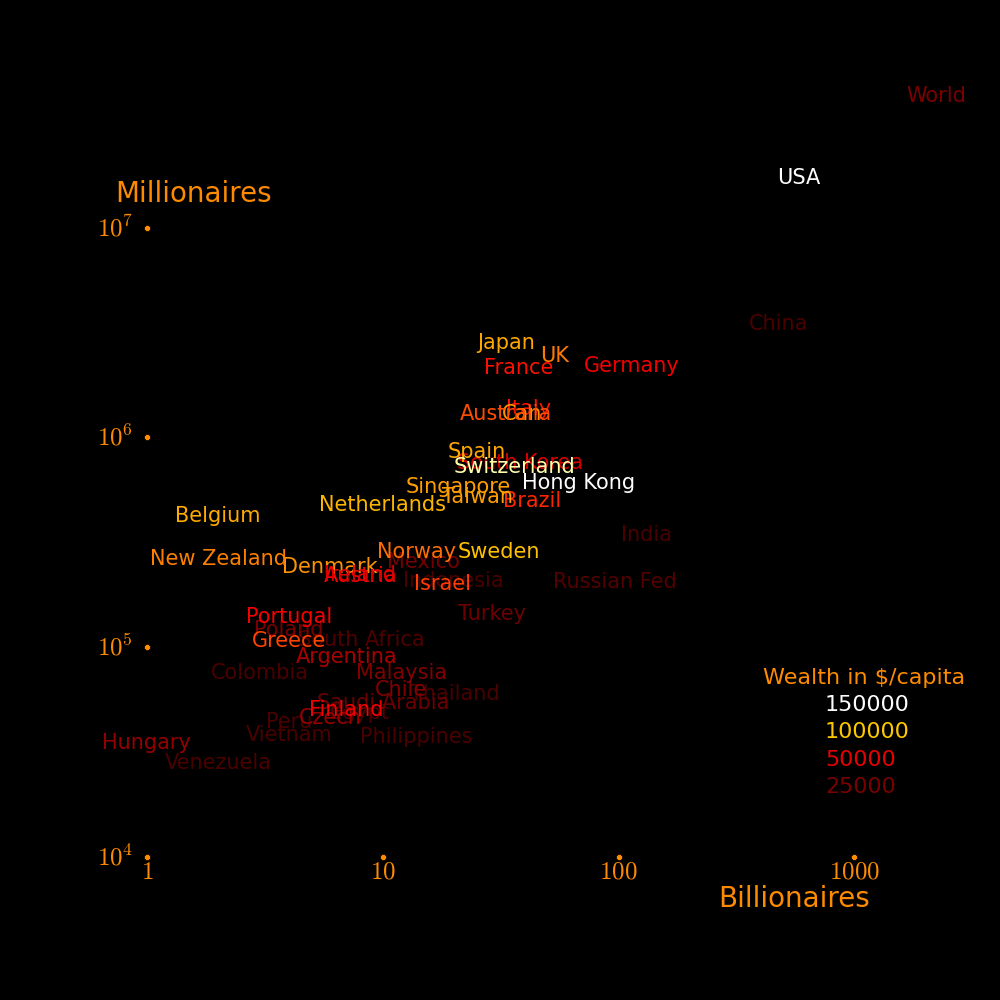
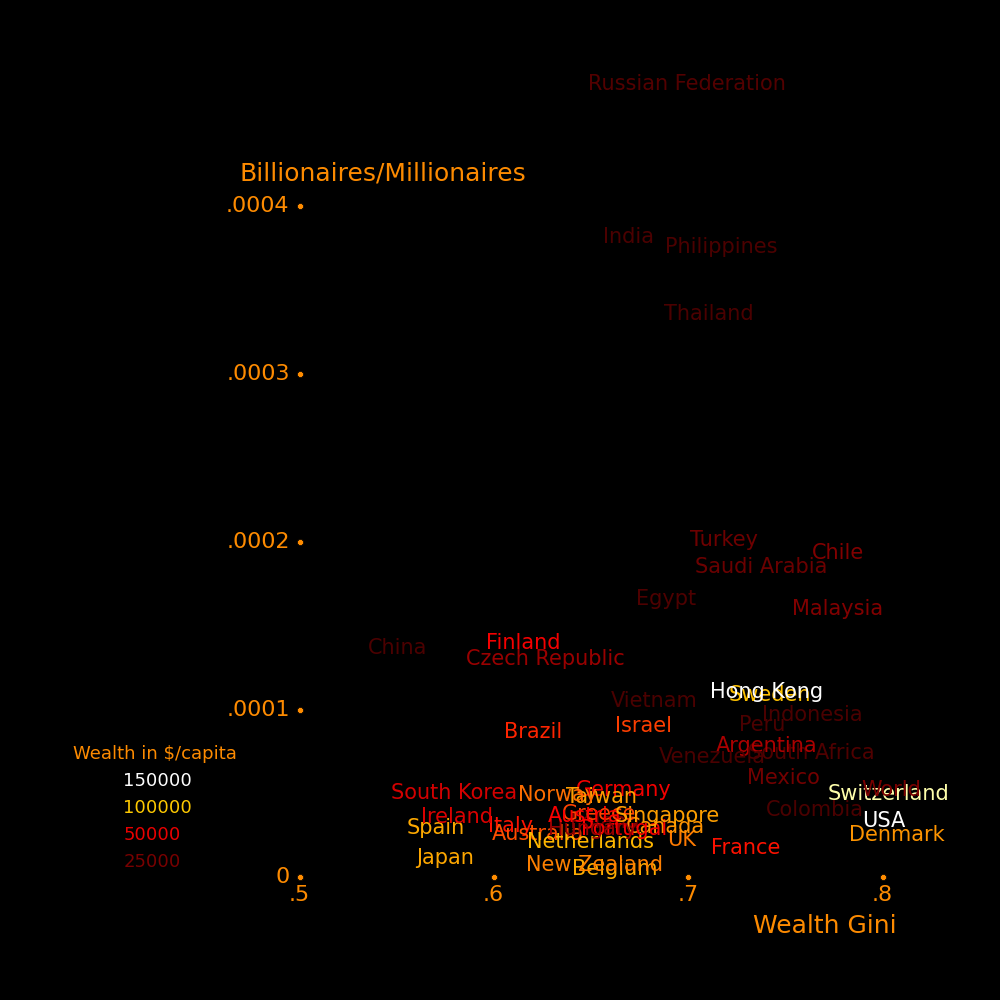
Nations to the upper right tend to have low wealth inequality and nations to the lower left tend to have high wealth inequality.
Ideally, a nation should have large wealth/capita, large GDP/capita, and small wealth Gini. The nations that stand out in this regard are Norway, Australia, and Japan.
 |
|---|
 |
|---|
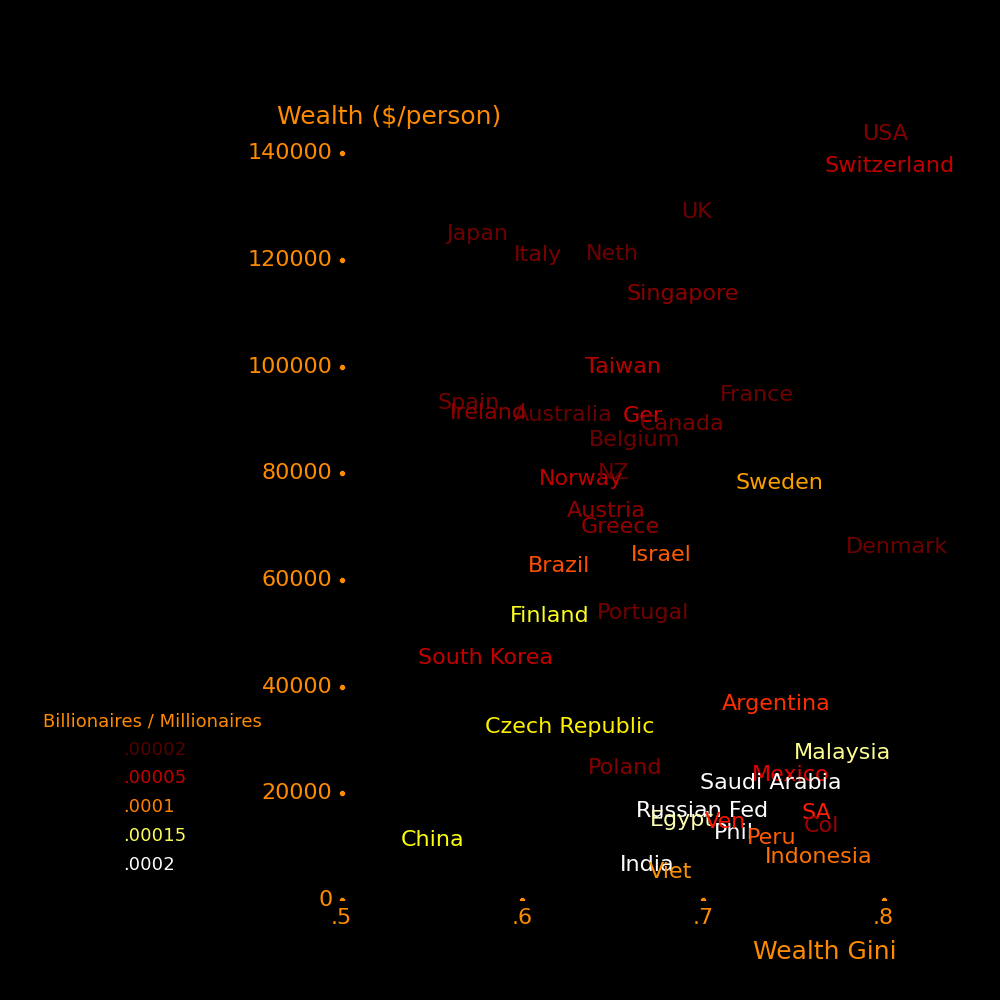
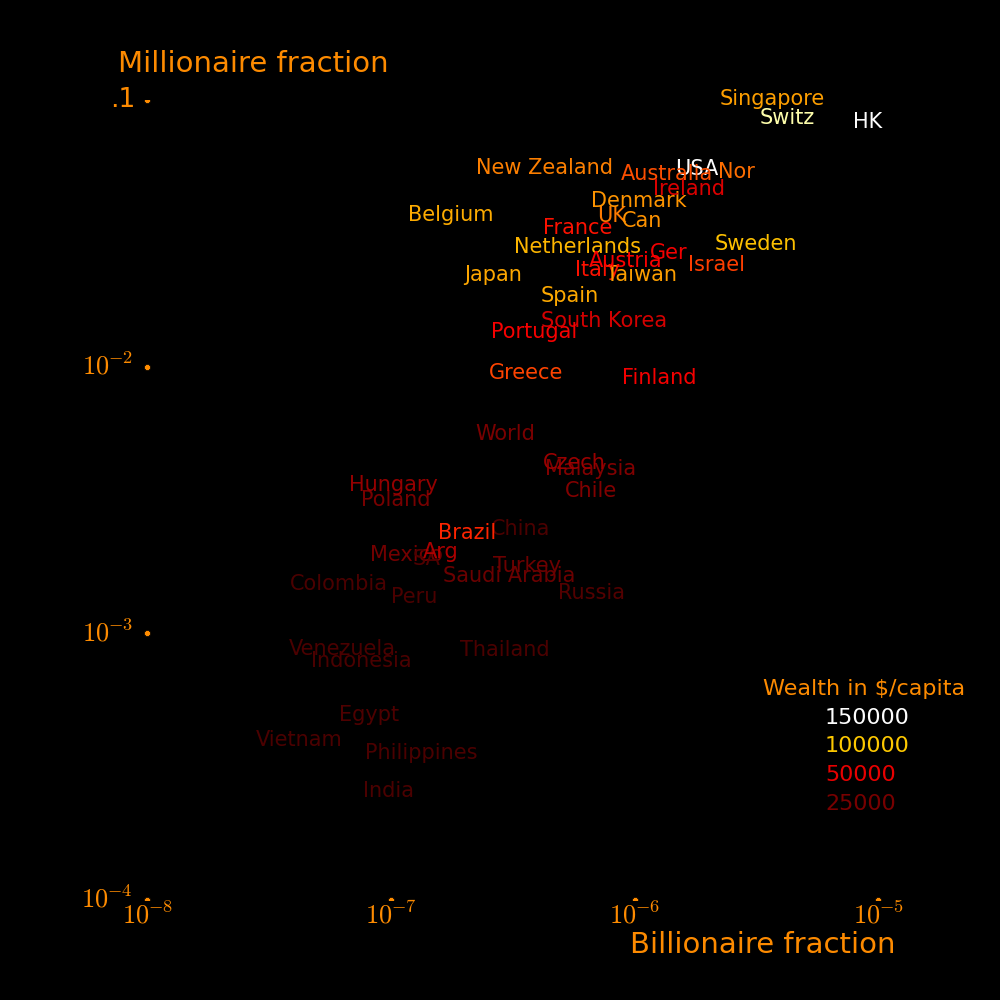
The wealth Gini is more sensitive to millionaires than billionaires. A nation can have a low wealth Gini and also be billionaire heavy.
 |
|---|
The world's undisputed economic superpower is the USA, in terms of wealth/capita, millionaires, and billionaires.
 |
|---|
 |
|---|
 |
 |
|---|---|
 |
 |
|---|---|
 |
 |
|---|---|
 |
 |
|---|---|
 |
|---|
 |
|---|
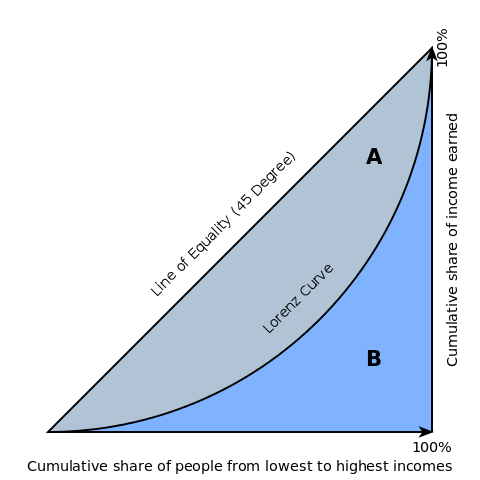
The Gini index characterizes the equality of a distribution. If everyone has the same wealth then the Gini index is 0 and if all the wealth is possessed by one person then the Gini index is 1.
In the above plot the Gini index is defined as
Area of the grey reagion  =  A
Area of the blue region   =  B
Gini index                =  G  =  A/(A+B)
 |
|---|
<0table width="100%">
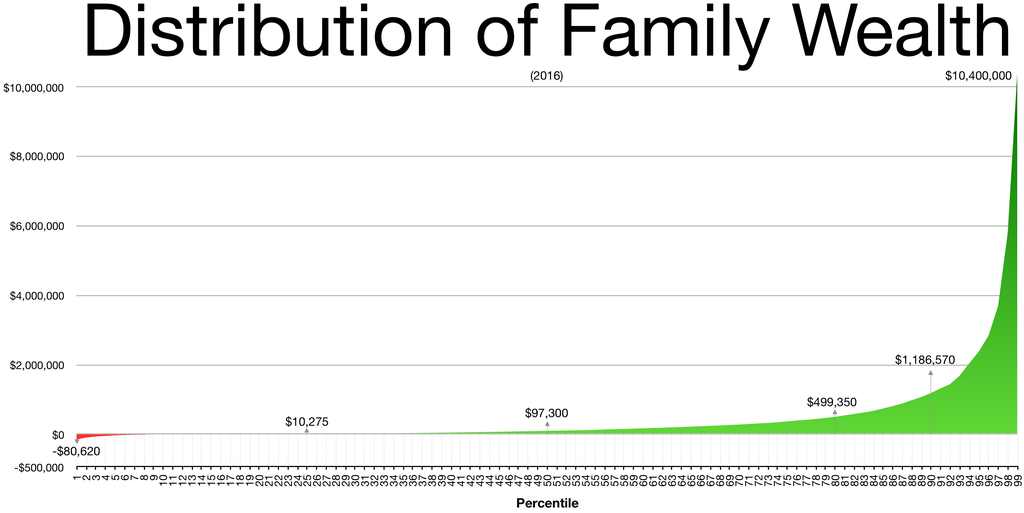
Percentile  Wealth   Fracion of total wealth
              M$

   1      10400000       .35
   2       7000000
   3       4500000
   4       2600000
   5       2200000       .62
  10       1187000       .73
  20        499000       .85
Billion $
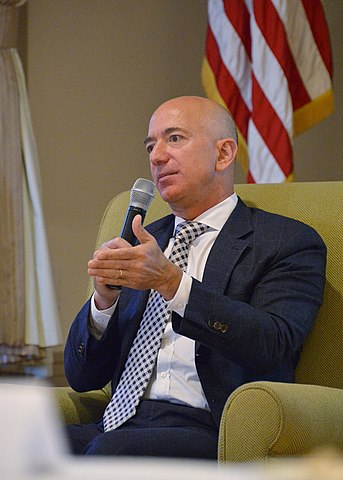
Jeff Bezos 131 Amazon
Bill Gates 96 Microsoft
Warren Buffett 83 Berkshire Hathaway
Larry Ellison 62 Oracle
Mark Zuckerberg 62 Facebook
Larry Page 60 Alphabet
Charles Koch 50 Koch Industries
David Koch 50 Koch Industries
Sergey Brin 50 Alphabet
Michael Bloomberg 49 Bloomberg LP
Jim Walton 45 Walmart
S. Walton 44 Walmart
Alice Walton 44 Walmart
Steve Balmer 41 Microsoft, LA Clippers
Sheldon Adelson 35 Las Vegas Sands Corp
Rupert Murdoch >10 Fox News
Michael Dell >10 Dell
Elon Musk >10 Tesla
Carl Icahn >10
Charles Schwab >10
George Lucas >4
George Soros >4
Steve Spielberg >4
Gordon Moore >4
Ross Perot >4
Bob Kraft >4
Tom Steyer
John Arnold
Donald Trump
Mark Cuban
California   165      Michigan     10    Missouri    6
New York     118      Pennsylvania 10    Virginia    5
Texas         56      Colorado     10
Florida       58      Tennessee    10
Massachusetts 17      Wyoming       9
Illinois      17      Wisconsin     9
Connecticut   17      Arizona       9
Georgia       13      New Jersey    8
Washington    12      Maryland      8
Nevada        11      Ohio          6
            Billion $

Apple          780
Alphabet       749
Microsoft      736
Amazon         728
Berkshire H.   450
Facebook       376
Johnson & J.   346
JPMorgan Chase 325
 |
|---|
 |
|---|
 |
 |
|---|---|
Trillion $
World wealth total 400
World stock markets 80
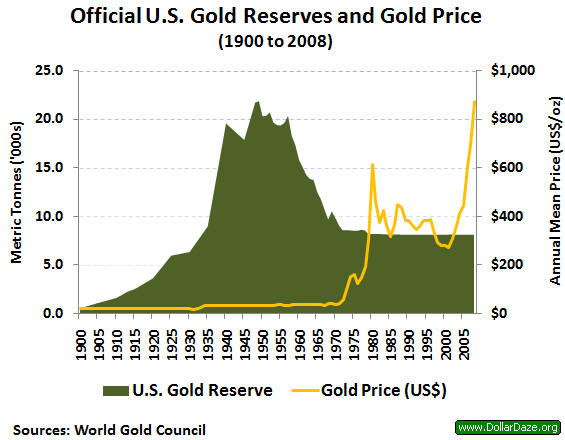
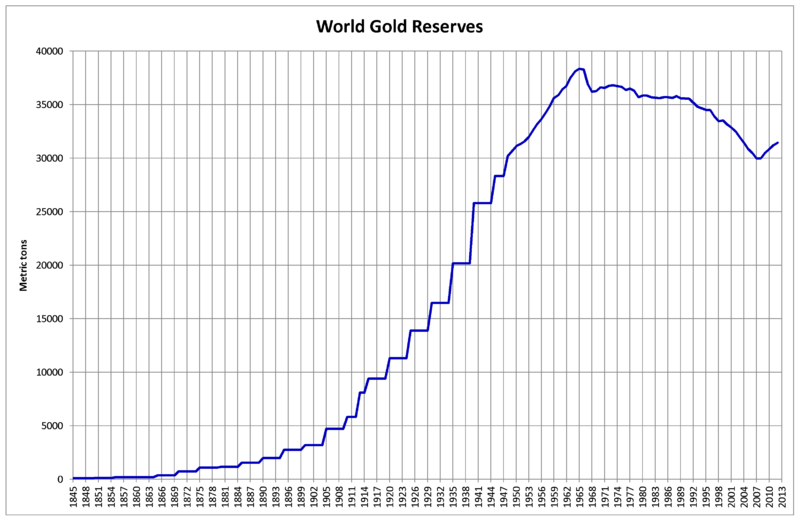
Gold, world reserves 10.9
World paper currencies 7
World cryptocurrencies 2.0
Silver, world reserves .01
Land
Buildings
Vehicles
Stock, New York 22.9
Stock, NASDAQ 10.9
Stock, Japan 5.7
Stock, London 4.6
Stock, Shanghai 4.0
Stock, Hong Kong 3.9
Stock, Euronext 3.9
Stock, Toronto 3.3
Stock, Shenzhen 2.5
Stock, Bombay 2.1
Stock, India National 2.0
Stock, Deutsche Borse 1.86
Stock, Switzerland 1.53
Stock, South Korea 1.46
Stock, NASDAQ Nordic 1.37
Stock, Australia 1.33
Stock, Taiwan .97
Stock, Brazil .94
Gold 10.9 60000 $/kg
Silver .044 .044 605 $/kg
Currency, USA 1.98
Currency, Europe 1.38
Currency, China 1.15
Currency, Japan 1.0
Currency, India .425
Currency, Russia .158
Currency, UK .104
Currency, Switz. .090
Currency, S. Korea .086
Cryptocurrency, Bitcoin 1.09
Cryptocurrency, Ethereum .210
Cryptocurrency, Binance .047
Cryptocurrency, Tether .041
Cryptocurrency, Cardano .038
Cryptocurrency, Polkadot .034
Cryptocurrency, XRP .025
 |
 |
 |
 |
 |
|---|---|---|---|---|
Who got the most bang for the buck?
Asimov sponsors the "Asimov Debates" at the American Museum of Natural History, and they draw a crowd of thousands. The debates cover exotic topics in science.
The Queen of England and 007 have a symbiotic relationship. The Queen has the money and 007 can get stuff done. It's a credit to the Queen that she bigly bankrolls 007. It's also a credit to the queen that 007 works for her. 007 doesn't work for just anyone.
Political offices are often purchased, and the money tends to go to oligarchs instead of the worthy. For example, money tends to flow to media executives. Senator Herb Kohl of Wisconsin set an example by donating lavishly to the University of Wisconsin and was rewarded with a senate seat.
The average spending required to win political office is:
               Winner      U.S. Total
              Million $    Million $

U.S. President   1200        2400
U.S. Senate        25        2500
U.S. House          2        2000
State Governor     10        1000
State Senate         .2       400
State House          .08      700
This tells you how much to demand for each office.
|
|---|
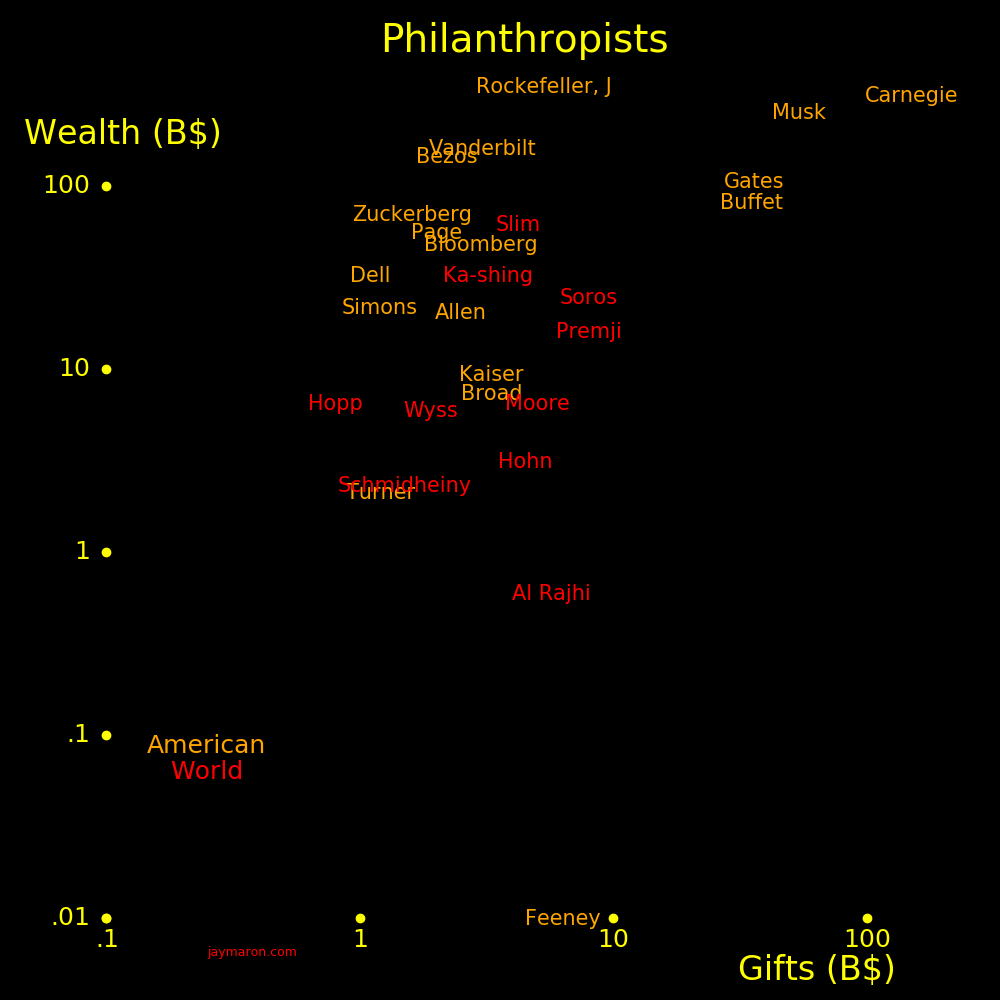
For a philanthropist, we can ask: What fraction of your wealth did you give away? as well as the worthiness of the recipients. In the era before the French Revolution, the French aristocracy was arrogant, much like the modern Democratic party. It bit them in the ass.
The French aristocracy had an opportunity. They were rich and they could have spent their money wisely, in a way that gains goodwill from the people. They could have spent their money on a batsuit and a batmobile, and they didn't. Lame!
A modern billionaire could use his money to build an Iron Man suit and be a superhero.
What should billionaires spend money on? Think there might be a conspiracy? The oligarchy is bourgeouis with their 1700 private jets at Davos. There is an epidemic of bourgeois, including the oligarchy, Taxing the rich doesn't work. They're good at hiding money. Instead coax them to spend money on your community. Treat them like celebrities if they do. Billionaire shaming. There are good billionaires and bad billionaires. Good billionaires turbocharge communities and bad billionaires poison them. A community should coax good billionaires to move in and be villigant in excluding bad billionaires. A wise billionaire could use his money to become a celebrity and be beloved by the community.
|
|---|
Prince Ranier of Monaco chose a hollywood wife, and he chose wisely. Prince Harry chose poorly.
The French Aristocracy of the 18th century was arrogant and it cost them their heads.
The British Monarchy gracefully instituted a smooth transition to democracy, and they got to keep their heads.
The American aristocracy of the 21st century is arrogant.
Robespierre created a world of guillotines, and Robespierre got guillotined.
George Carlin: The oligarchs own this place. It's a big club, and you aren't in it.
 |
 |
|---|---|
 |
 |
 |
|---|---|---|
Academic competitions
A measure of the quality of a rich person is the quality of the jobs he produces. Elon Musk creates great engineering jobs whereas the Waltons and Wal Mart create low-end jobs.
Dog park
Car
Wine
Yacht
Tax breaks can be given for worthy causes, for examle a science megaproject. Some examples might be:
Higgs factory collider, a circular electron collider
Electron linear collider
Telescopoe for asteroid fining
Radio telescopes and the search for intelligent life
Gravitational wave observatory
 |
|---|
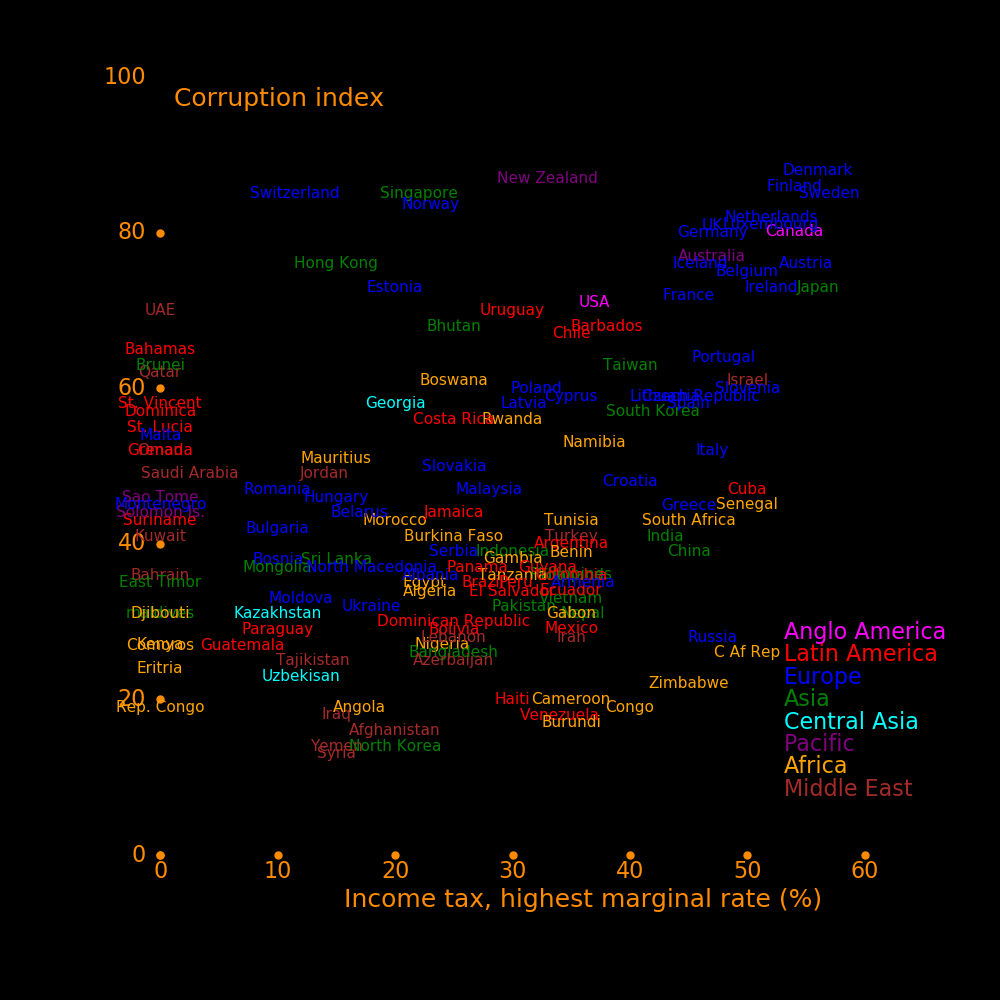
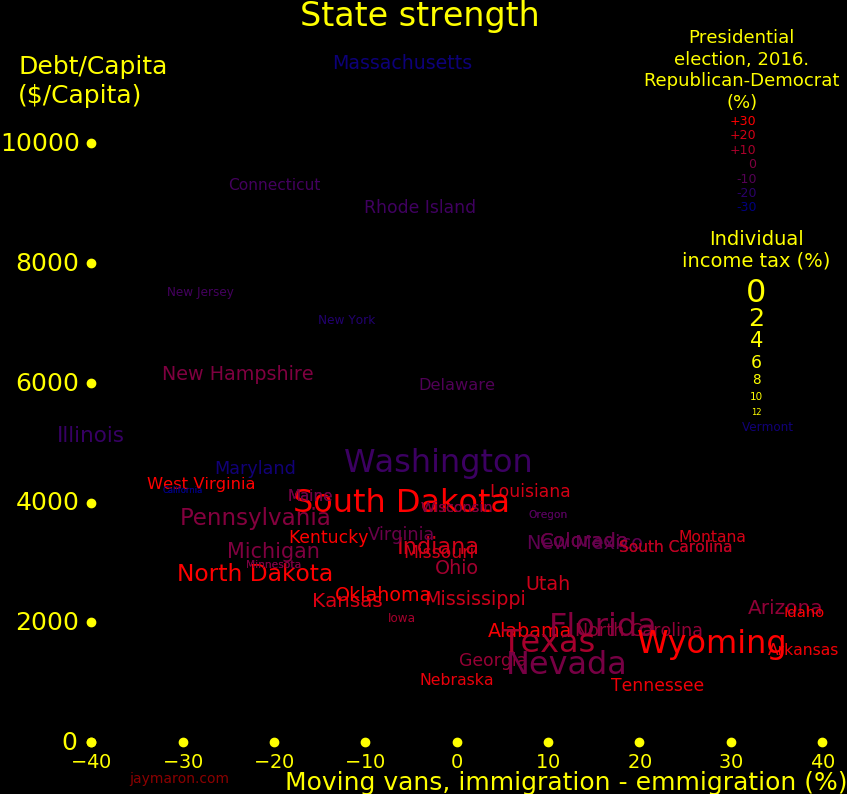
The wealthy tend to migrate in the direction of low tax, and this is happening in the United States.
Billionaires are a good thing to have around.
California   165      Michigan     10    Missouri    6
New York     118      Pennsylvania 10    Virginia    5
Texas         56      Colorado     10
Florida       58      Tennessee    10
Massachusetts 17      Wyoming       9
Illinois      17      Wisconsin     9
Connecticut   17      Arizona       9
Georgia       13      New Jersey    8
Washington    12      Maryland      8
Nevada        11      Ohio          6
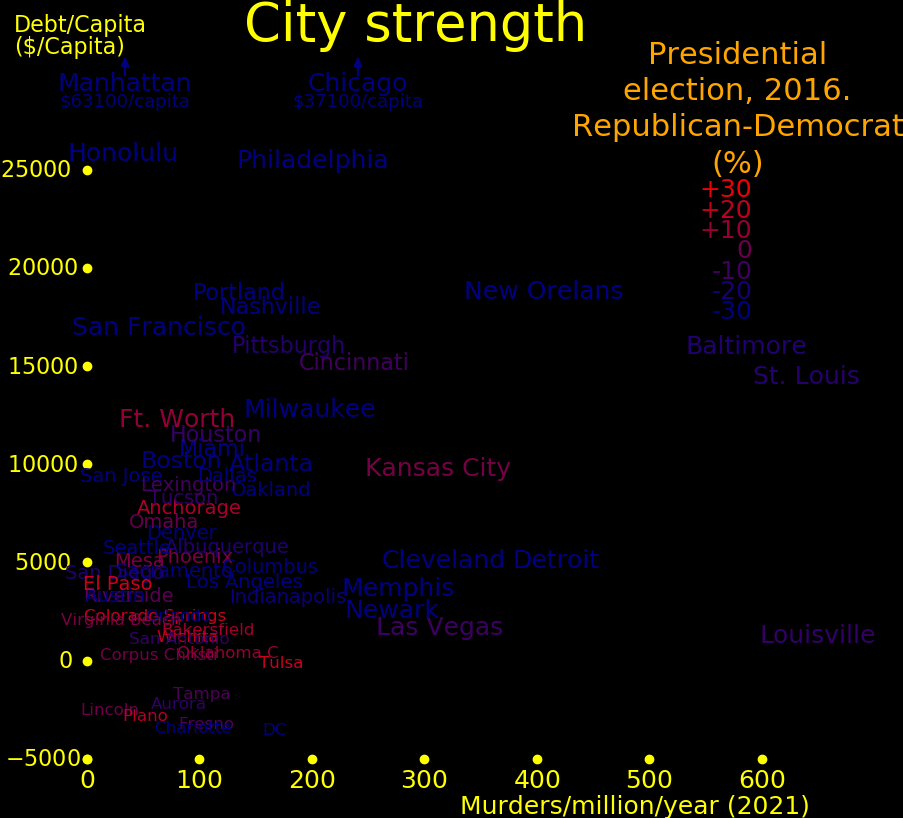
Billionaires tend to cluster in cities.
New York City   98    Palm Beach      10    Oklahoma City    3
San Francisco   41    Boston          10    Racine           3
Los Angeles     27    Seattle          8    Omaha            3
Dallas          17    Las Vegas        7    Cleveland        3
Atlanta         13    Phoenix          6    Potomac MD       3
Houston         12    Naples           5    Brookline, MA    3
Greenwich       11    Jackson          4    Cary, NC         3
Chicago         11    Denver           4    Philadelphia     3
 |
|---|
                 Billion $

Jeff Bezos          131       Amazon
Bill Gates           96       Microsoft
Warren Buffett       83       Berkshire Hathaway
Larry Ellison        62       Oracle
Mark Zuckerberg      62       Facebook
Larry Page           60       Alphabet
Charles Koch         50       Koch Industries
David Koch           50       Koch Industries
Sergey Brin          50       Alphabet
Michael Bloomberg    49       Bloomberg LP
Jim Walton           45       Walmart
S. Walton            44       Walmart
Alice Walton         44       Walmart
Steve Balmer         41       Microsoft, LA Clippers
Sheldon Adelson      35       Las Vegas Sands Corp
Rupert Murdoch      >10       Fox News
Michael Dell        >10       Dell
Elon Musk           >10       Tesla
Carl Icahn          >10
Charles Schwab      >10
George Lucas         >4
George Soros         >4
Steve Spielberg      >4
Gordon Moore         >4
Ross Perot           >4
Bob Kraft            >4
Tom Steyer
John Arnold
Donald Trump
Mark Cuban
|
|---|
Percentile  Wealth   Fracion of total wealth
              M$

   1      10400000       .35
   2       7000000
   3       4500000
   4       2600000
   5       2200000       .62
  10       1187000       .73
  20        499000       .85
            Billion $

Apple          780
Alphabet       749
Microsoft      736
Amazon         728
Berkshire H.   450
Facebook       376
Johnson & J.   346
JPMorgan Chase 325
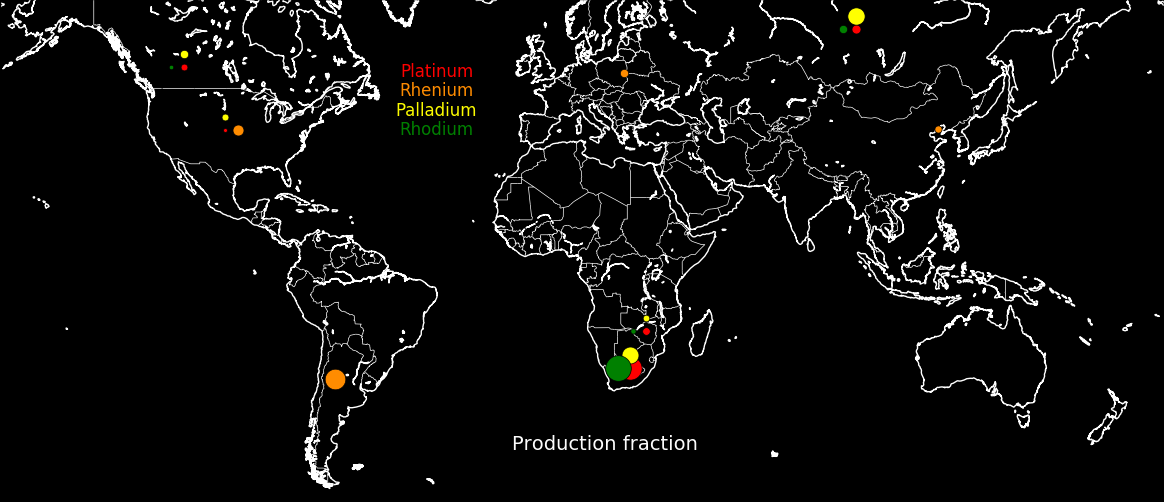
China dominates the production of most elements, with South Africa in second place. America dominates for only beryllium, rhenium, and thorium. The plot shows the fraction of world production for each element.
 |
|---|
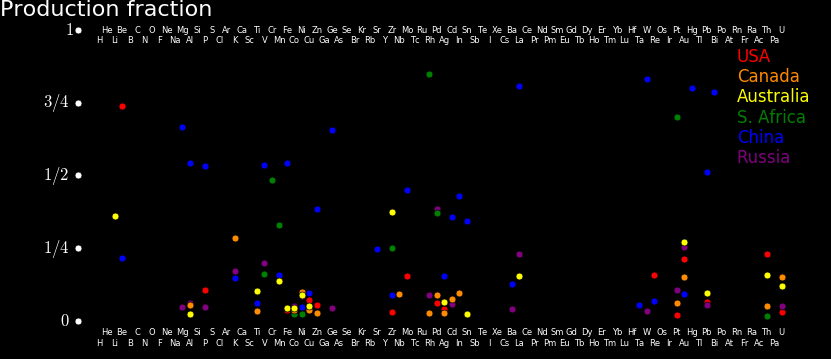
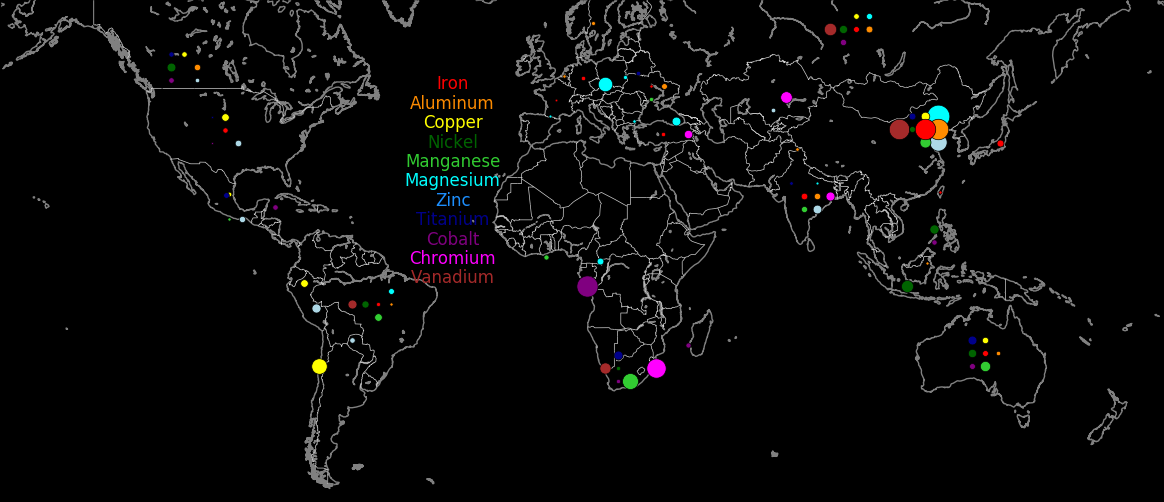
Macrometals are the metals mined by greatest mass. The macrometal superpowers are China, South Africa, Australia, Russia, India, and Canada. America has feeble production. The following plot shows each nation's fraction of world production for each metal. Data is from USGS 2018.
 |
|---|
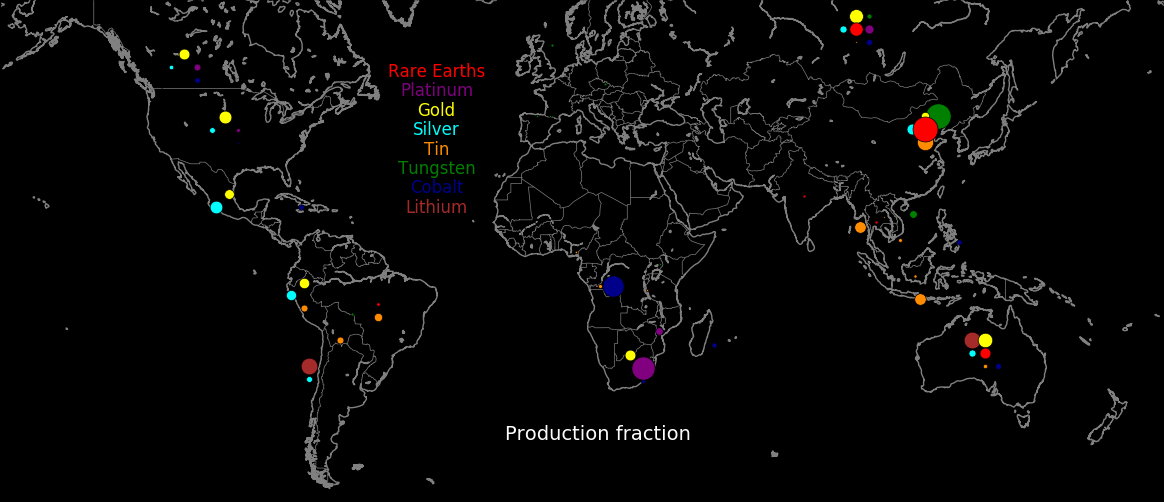
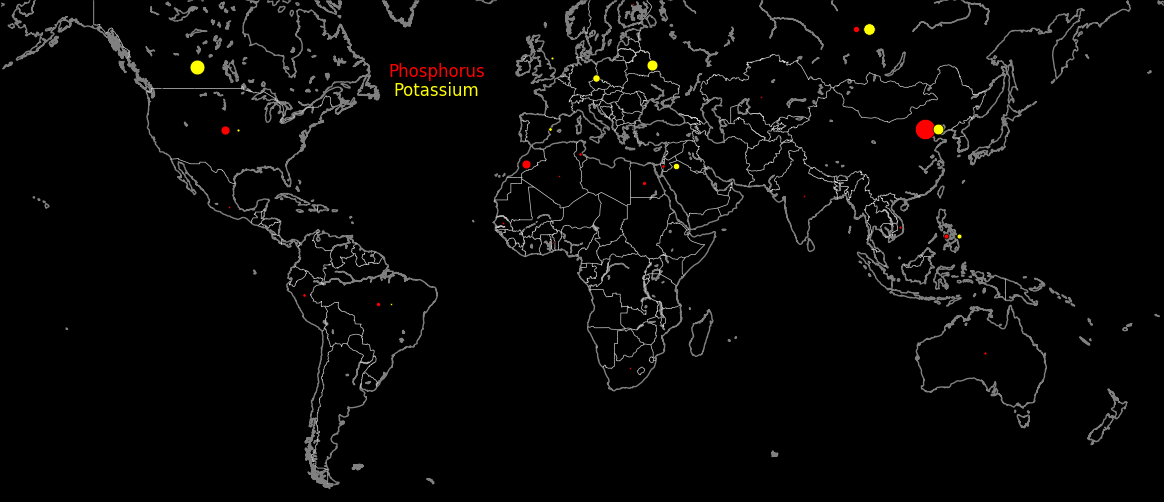
The plot shows the most endangered elements and where they are produced. Many come from conflict zones or from hostile nations. Most come from China.
 |
|---|
The endangered elements are:
Element       Source                   Use

Cobalt        DR Congo                 Lithium-ion batteries, steel alloy
Lithium       Australia, Chile         Lithium-ion batteries
Rare-earths   China                    All of the electronics industry, especially solar cells and magnets
Germanium     China                    Fiber optics
Tin           China                    Solder and bronze
Tungsten      China                    Superhard materials in the form of tungsten carbide
Scandium      China, Ukraine, Russia   Aluminum alloy
Phosphorus    China, Israel, Canada    Fertilizer
Potassium     China, Israel, Canada    Fertilizer
There isn't enough lithium and cobalt to build an electric car for everyone in the world.
The ultimite limit to how much food we can grow is from fertilizer, and this hinges on phosphorus and potassium. Biomass power is vast, hence phosphorus and potassium are critically important.
Most endangered elements are endangered because they're produced primarily in China.
Elements that are important but not endangered include:
Platinum     Canada South Africa     Catalyst
Palladium    Canada South Africa     Catalyst
Rhodium      Canada South Africa     Catalyst
Rhenium      Chile USA Peru Poland   Aircraft turbines
Osmium                               Superhard metal
Iridium                              Superhard metal
Molybdenum                           Strong metal
Beryllium    USA                     Strong lightweight metal
Tantalum     Australia Brazil Canada Capacitors and is produced in Australia, Brazil, and Canada.
Nickel       Worldwide               Steel alloy. Turbines
Caesium      Canada                  Drilling lubricant in the form of caesium formate
Gold         USA Canada Australia    Currency
Silver       Mexico Peru             Solar cells
Copper       Chile Peru USA Aus Chi  Power wires
Gallium      Worldwide               Extracted from aluminum ore
Uranium      Worldwide               Nuclear energy
Thorium      Worldwide               Nuclear energy
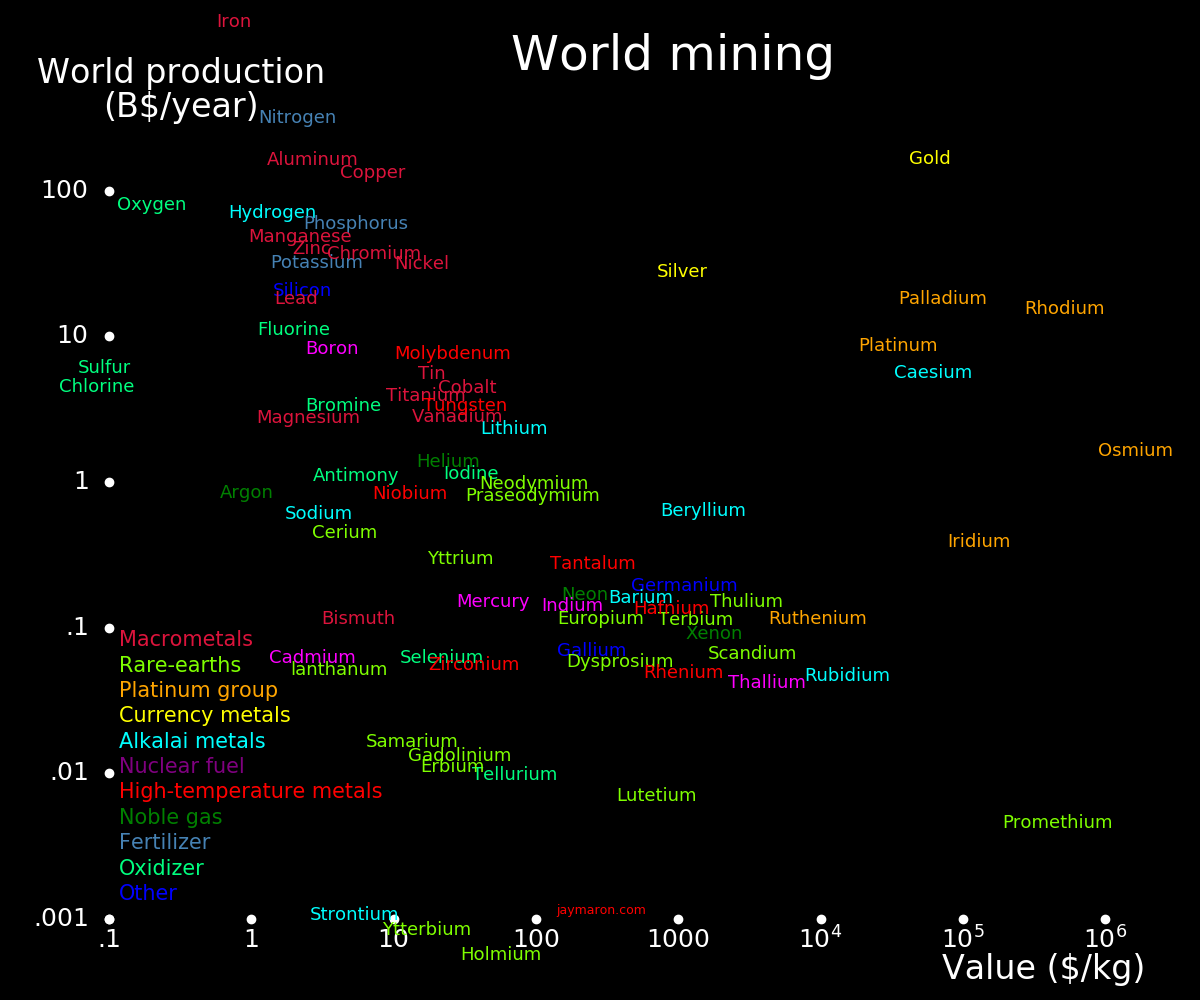
The following plot shows world production for each element. Endangered elements tend to be near the bottom.
 |
|---|
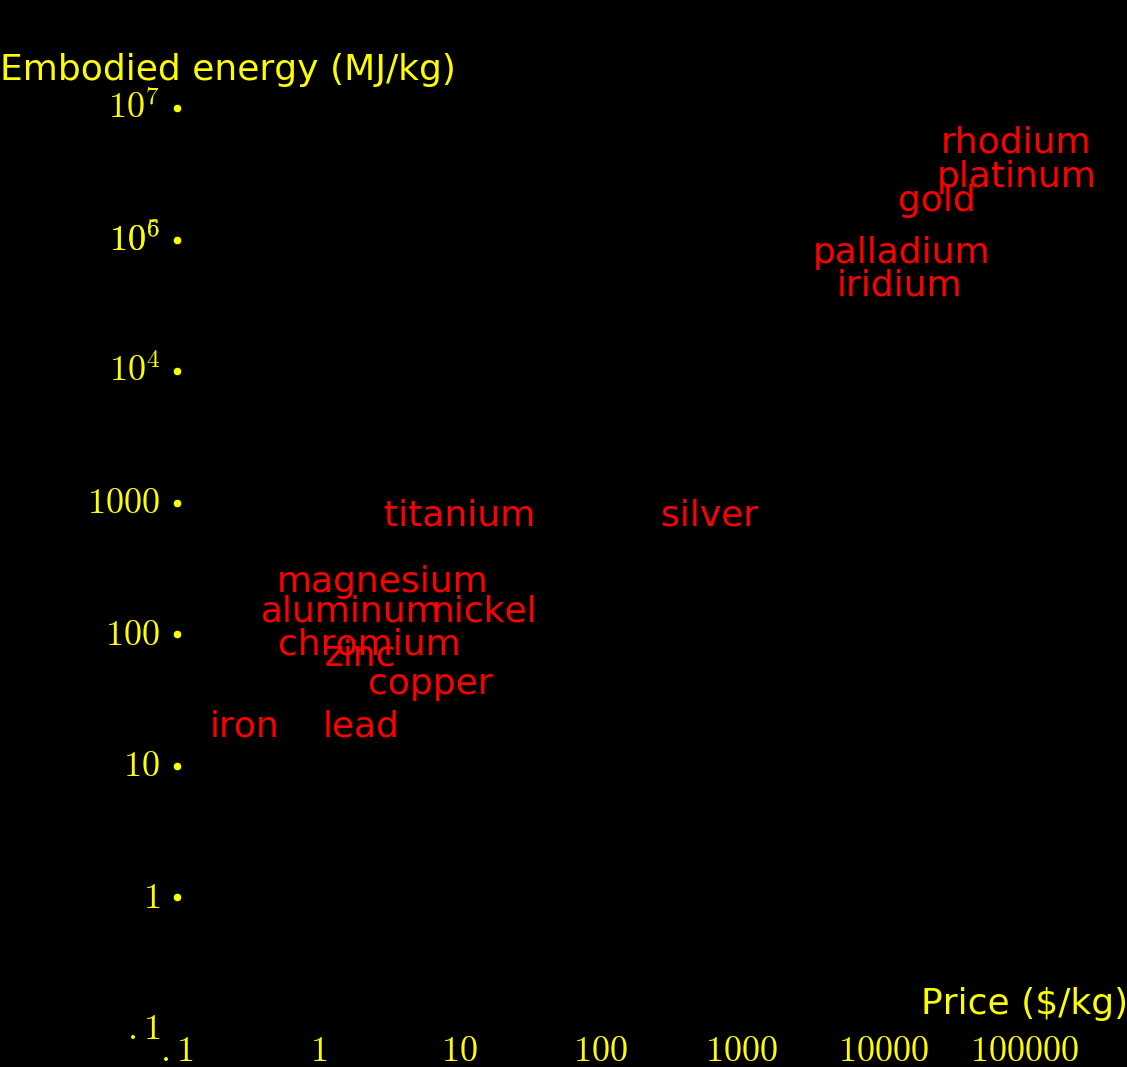
The embodied energy of an element is the energy required to extract the element from ore, in Joules/kg. Most of the price of elements is from energy. For steel, the energy comes from coal smelting and for most of the other elements the energy comes from electricity.
 |
|---|
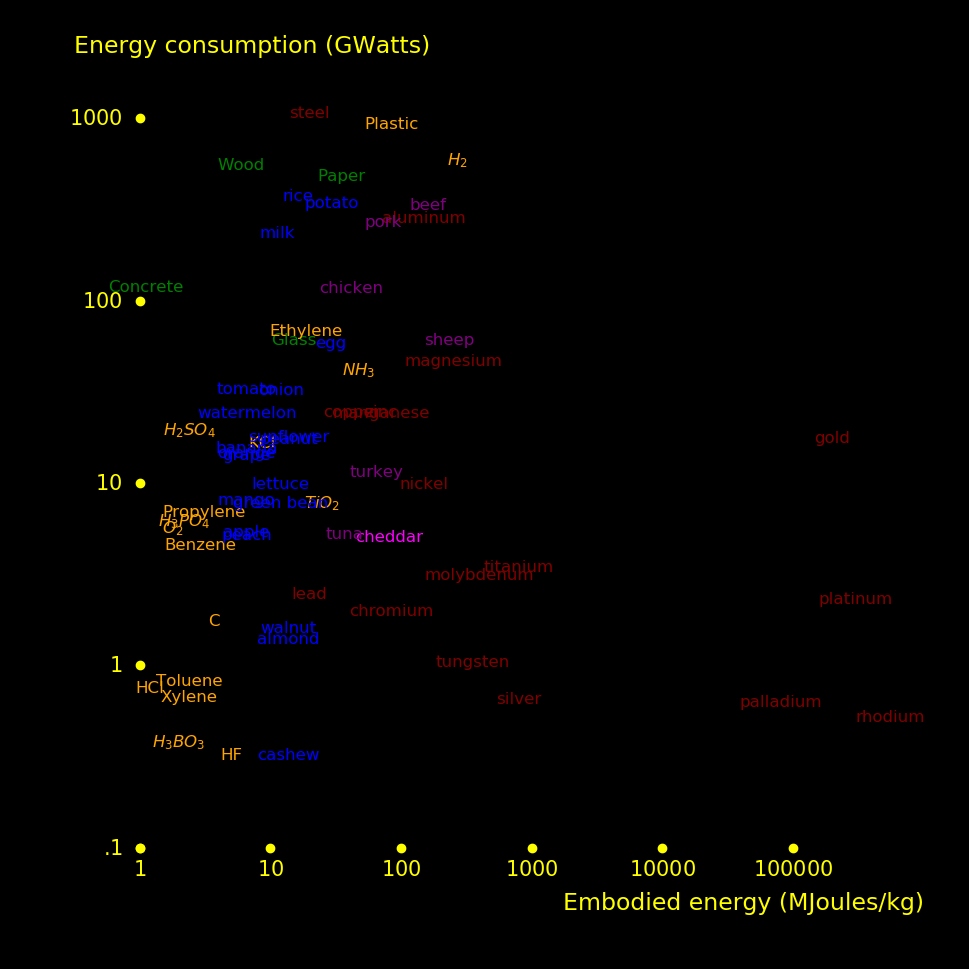
Energy is used in every stage of industry. It's used in the production of primary materials, such as elements, chemicals, plastics, and lumber. It's used again to manufacture things with the primary materials.
The plot shows how much energy the world expends per year for primary materials.
 |
|---|
 |
 |
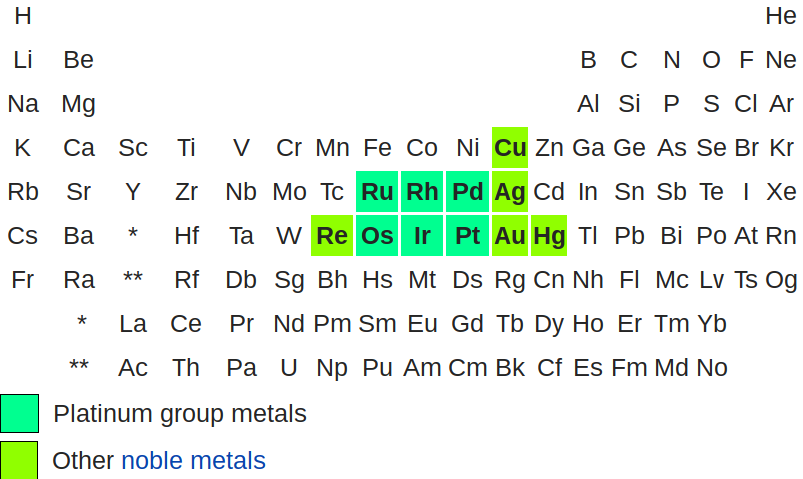
|---|---|
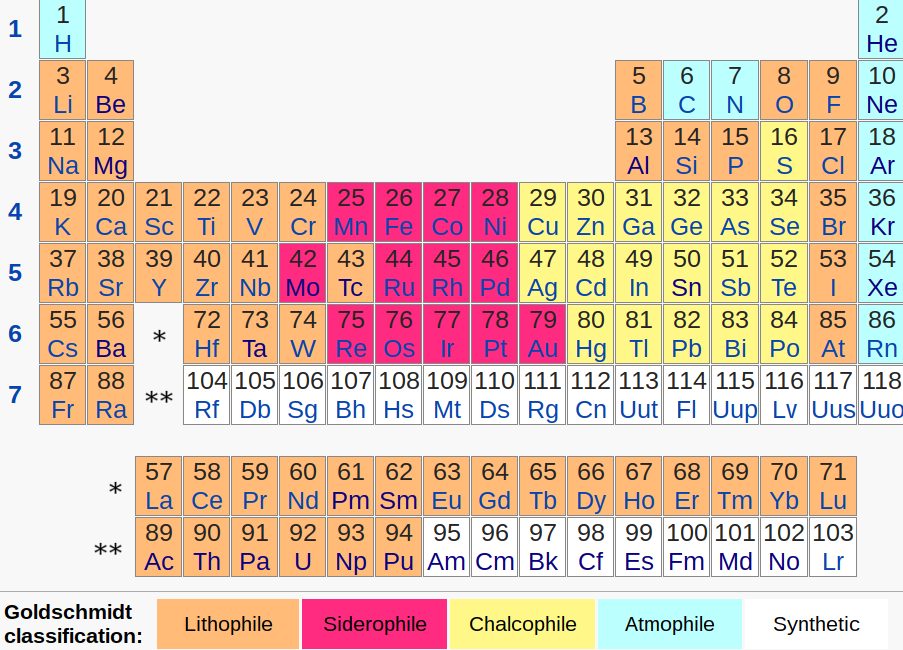
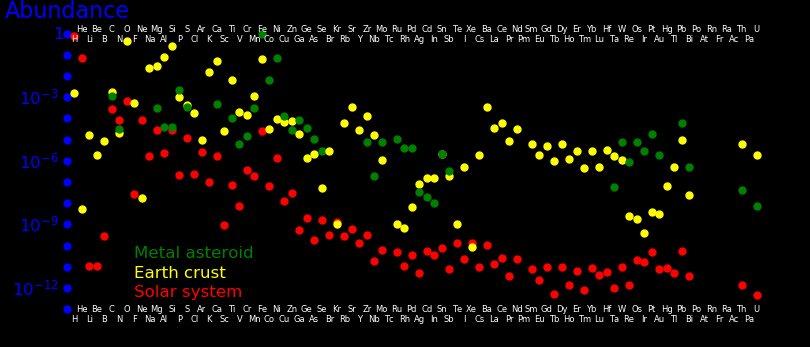
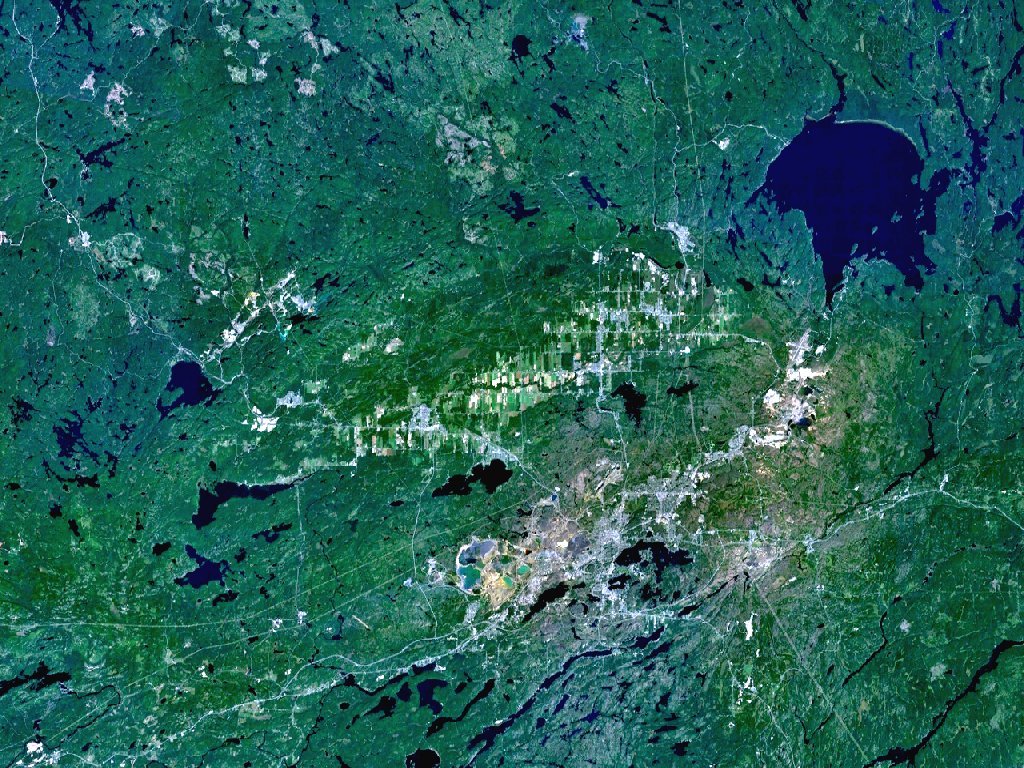
Platinum group metals are rare because they are dense and they tend to sink to the Earth's core. They are mostly mined from metal asteroid craters such as the Sudbury crater in Canada and the Vrodefort Crater in South Africa. Metallic asteroids are rich in platinum group elements because they used to be part of the core of a planet.
Siderophile:  Iron-living. Tends to sink to the core along with the iron.
Lithophile:   Rock-loving. Tends to become included in rock and escapes sinking
              to the core.
Chalcophile:  Ore-loving. Tends to combine with oxygen and sulfur and escapes sinking
              to the core.
Atmophile:    Is a gas at room temperature and tends to escape the crust into the
              atmosphere.
 |
|---|
 |
|---|
 |
 |
|---|---|
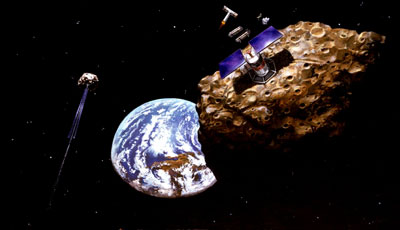
A 300 meter metallic asteroid has 30 billion dollars of platinum group elements, equal to world annual production.
-178918.jpg) |
 |
 |
 |
|---|---|---|---|
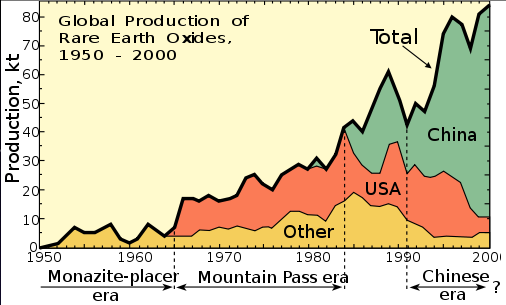
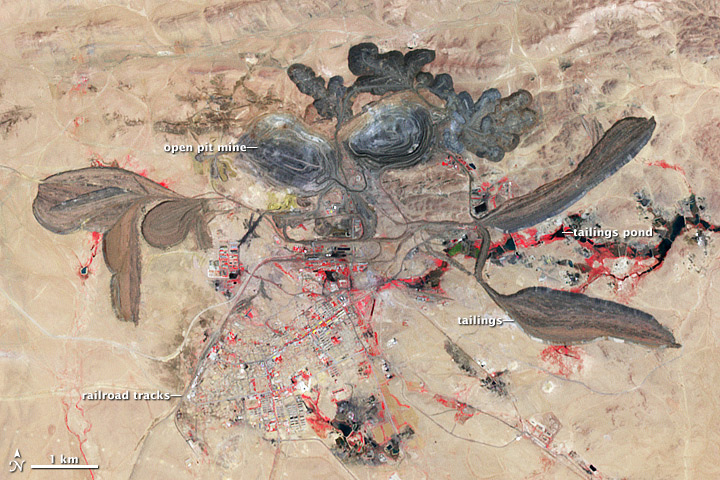
The rare Earth elements are the ones in the row from Lanthanum to Lutetium and they tend to occur together in minerals. They are vital to electronics and 95% of the world's supply comes from the Bayan Obo deposit in China. Uranium and thorium are often found in rare Earth ore.
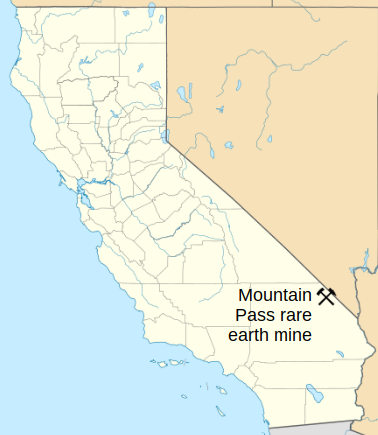
The Californa Mountain Pass mine closed in 2002. In 2010 China restricted rare Earth exports, prompting subsidies from the U.S. Government to reopen the mine. Mining resumed in 2015 and then ceased in 2016 when the mining corporation went bankrupt.
 |
|---|
GDP
Distribution of Wealth
Billionaires
Millionaires