
|
|
|
|
|
|
|---|---|---|---|---|---|
 |
 |
 |
 |
 |
 |
|---|---|---|---|---|---|
 |
 |
 |
 |
 |
 |
 |
|---|---|---|---|---|---|---|
 |
 |
|---|---|
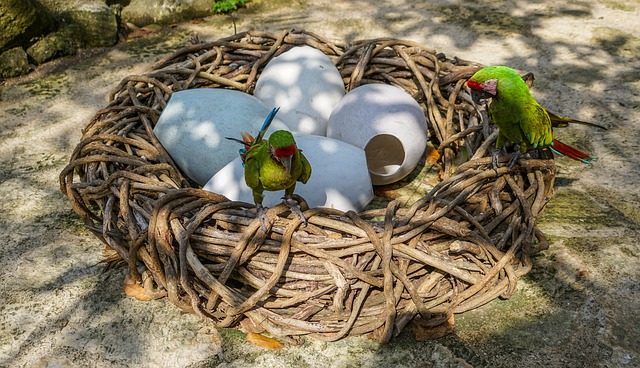
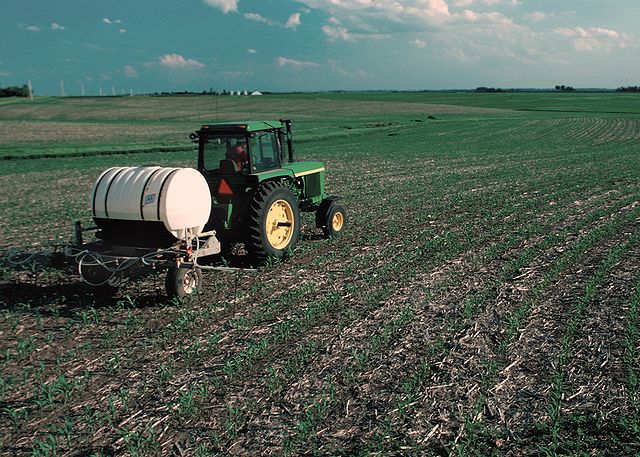
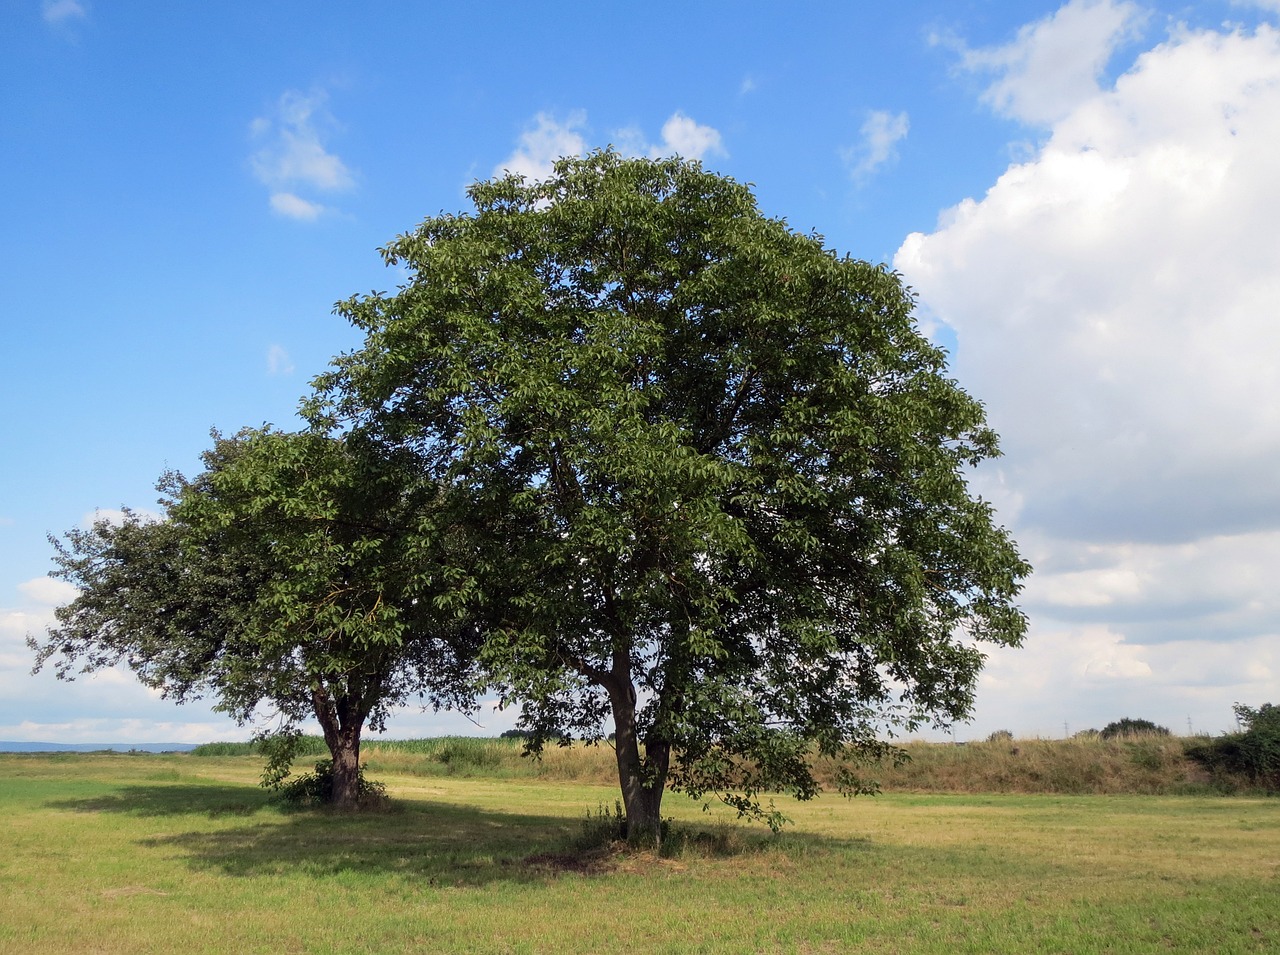
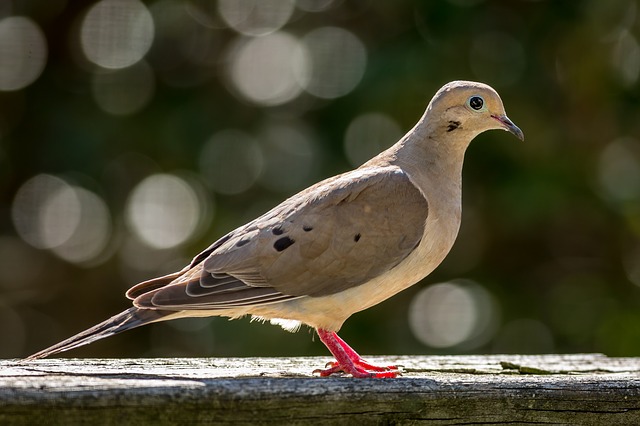
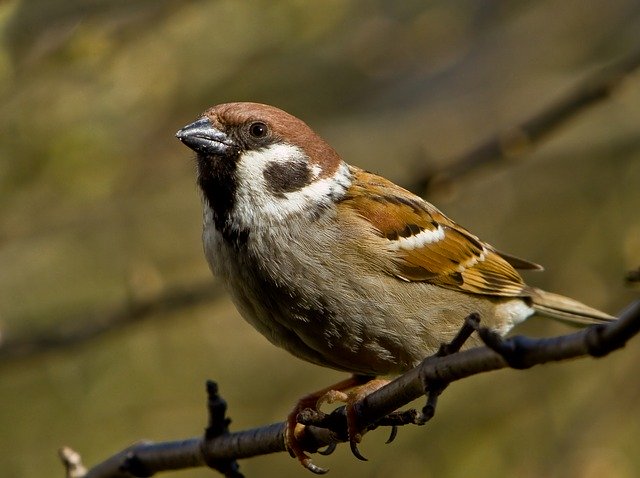
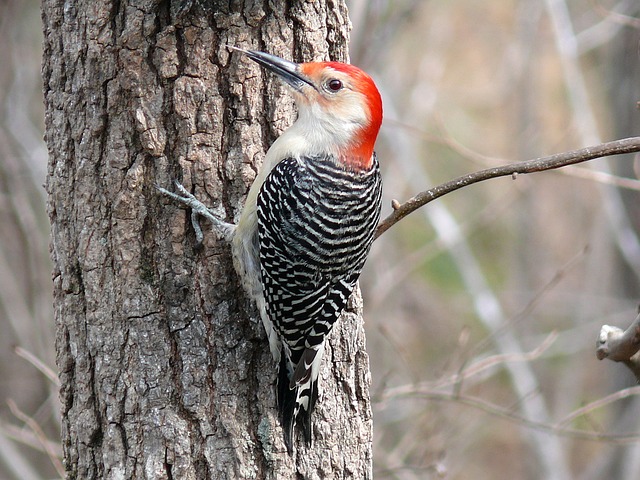
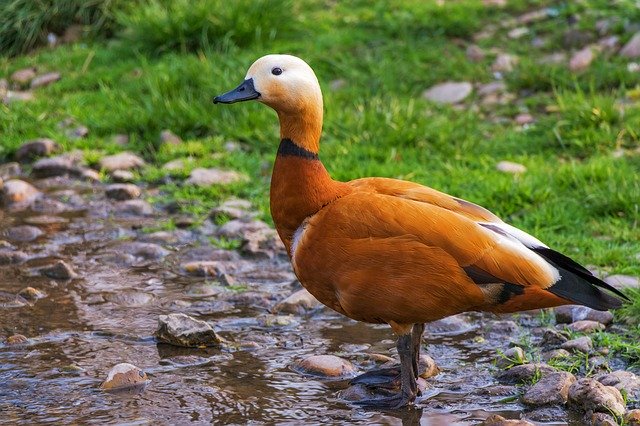
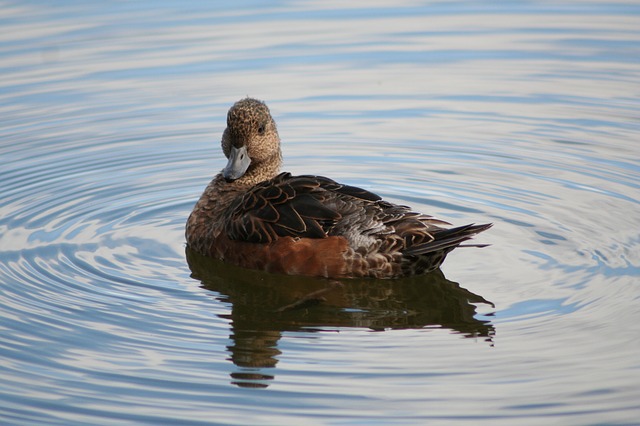
The goal is to increase the Earth's biomass. Anyone can take initiative by feeding birds, fertilizing, planting trees, and tagging animals. Science turbocharges these measures.
 |
|---|
Biomass is dominated by trees.
Plants are 10% of ocean biomass and 98% of land biomass.
On land, most plants are not eaten, and in oceans, most plants are eaten. Oceans have 5 times as much consumer biomass as producer biomass.
 |
|---|
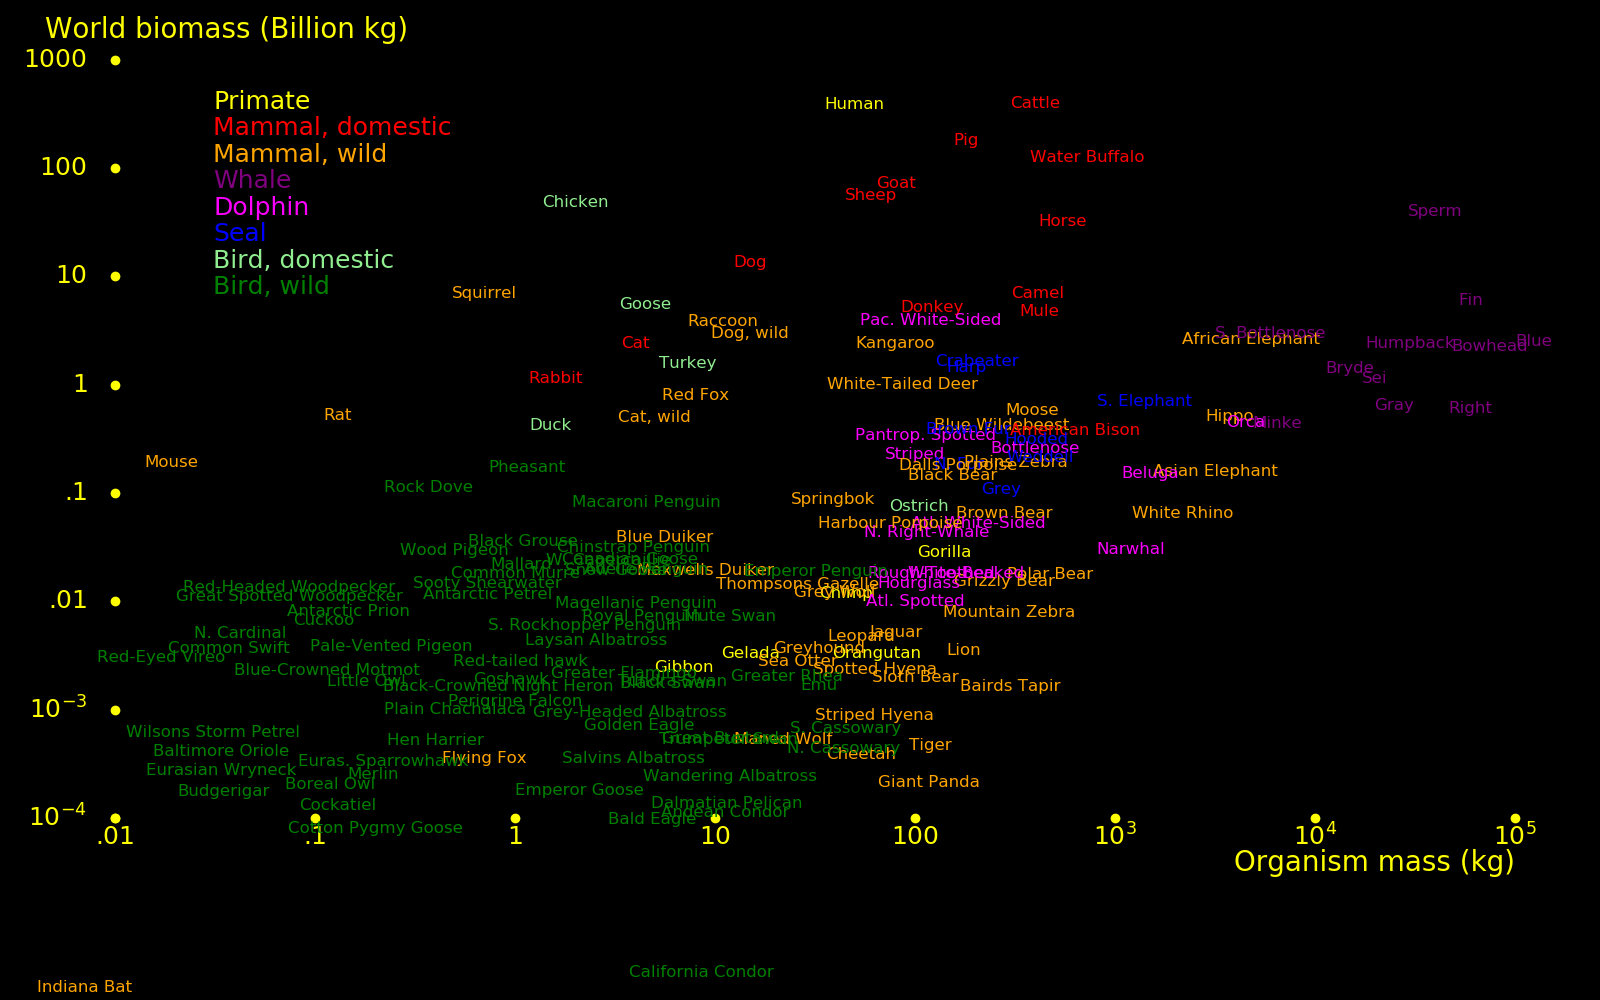
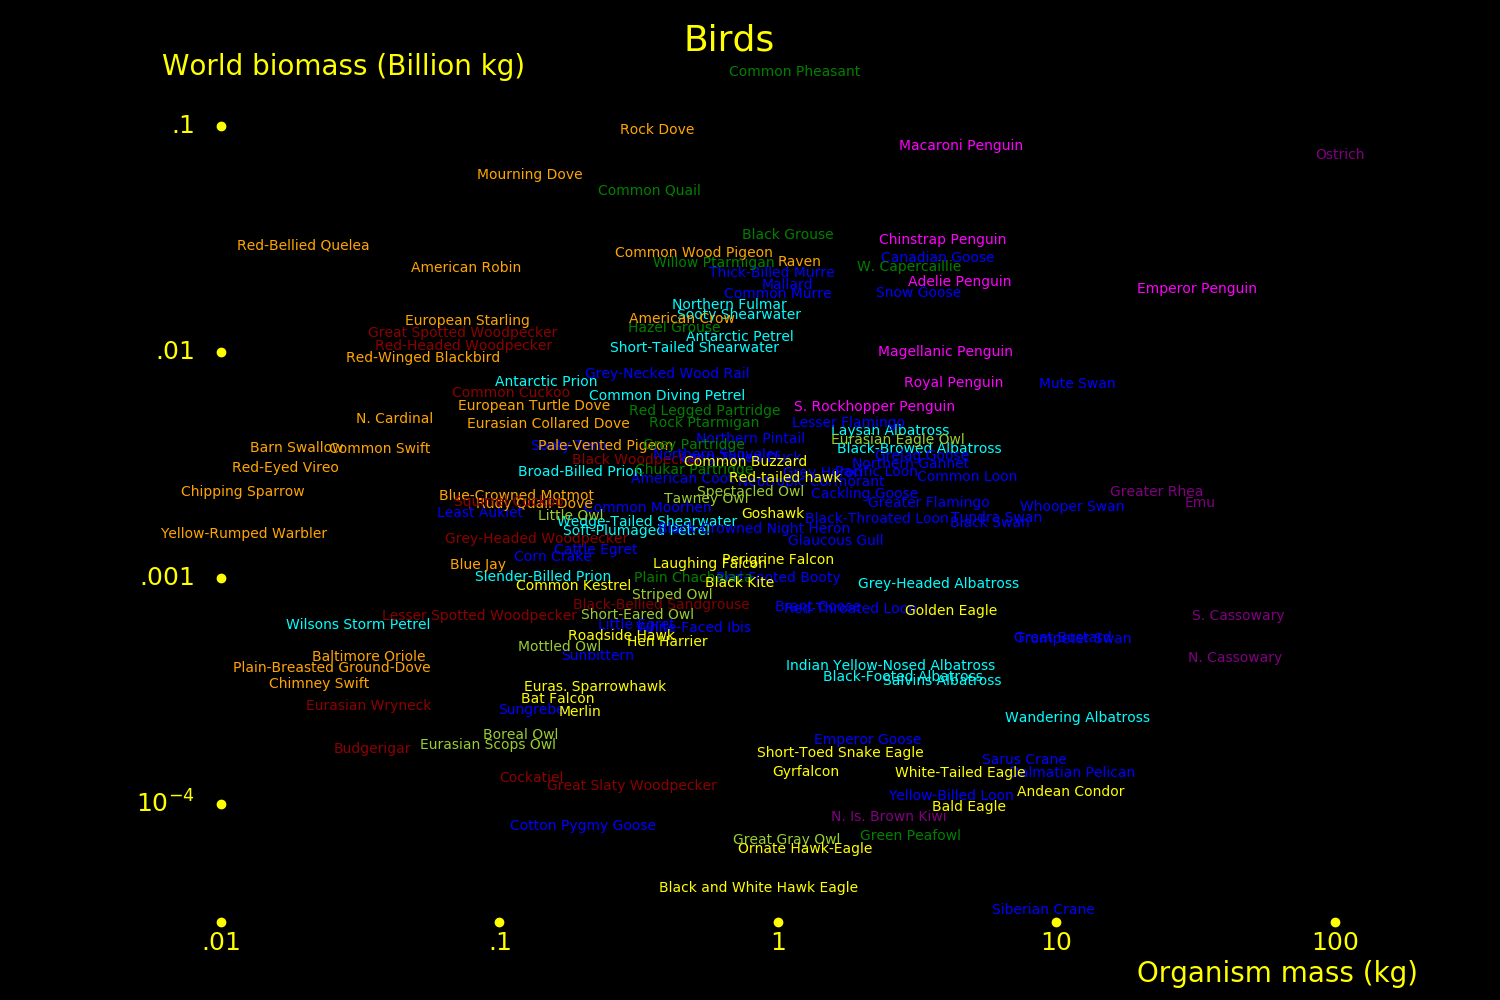
For mammals and birds, biomass is dominated by domestic animals.
Mammal biomass is dominated by humans and cattle.
The larger the organism, the more accurate the population data. Populations for many small species are unknown.
 |
|---|
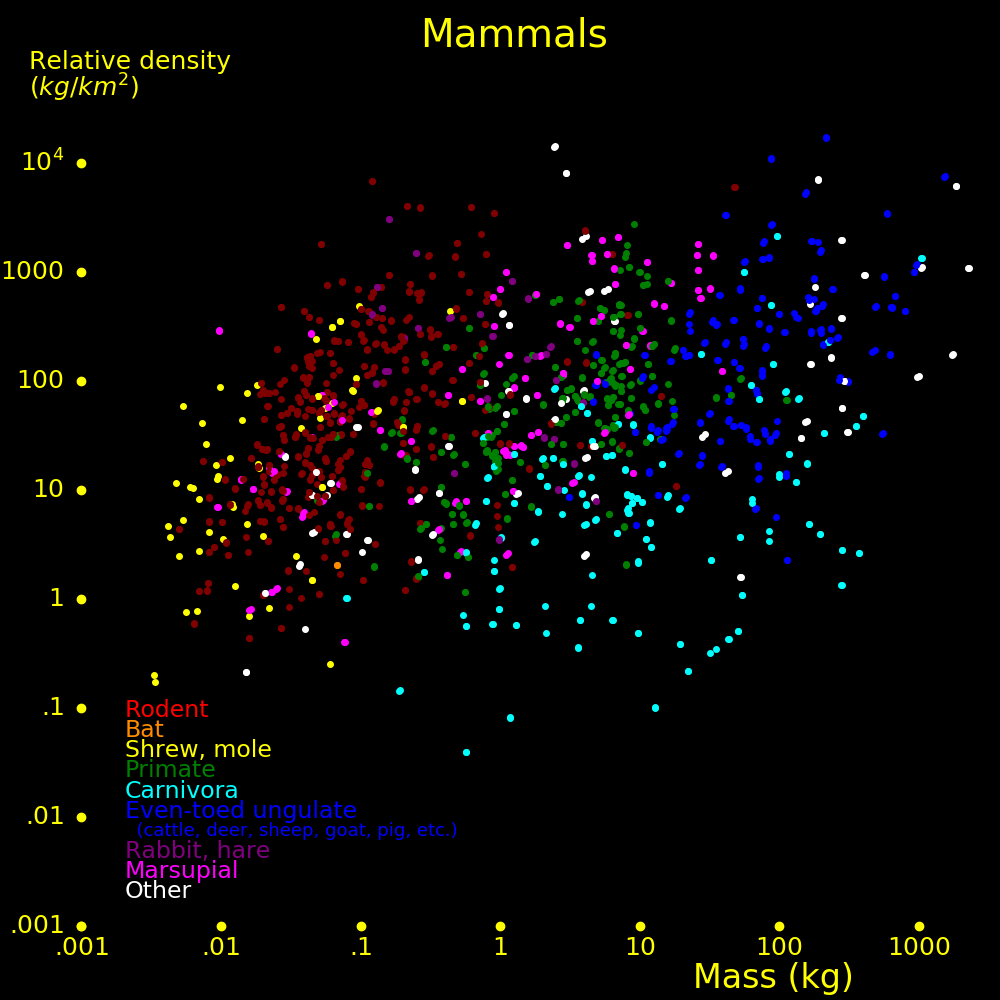
Mammal biomass is approximately constant over the range of animal sizes.
 |
|---|
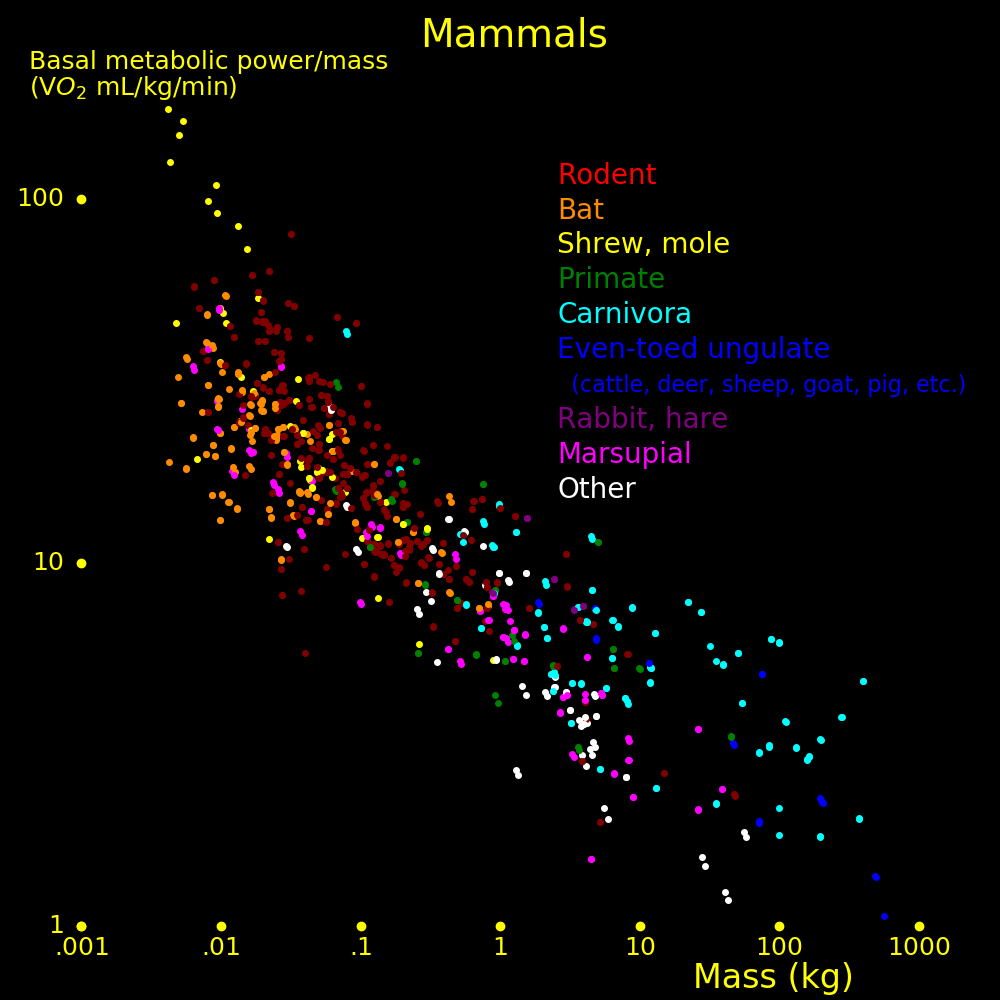
Data from pantheria.org.
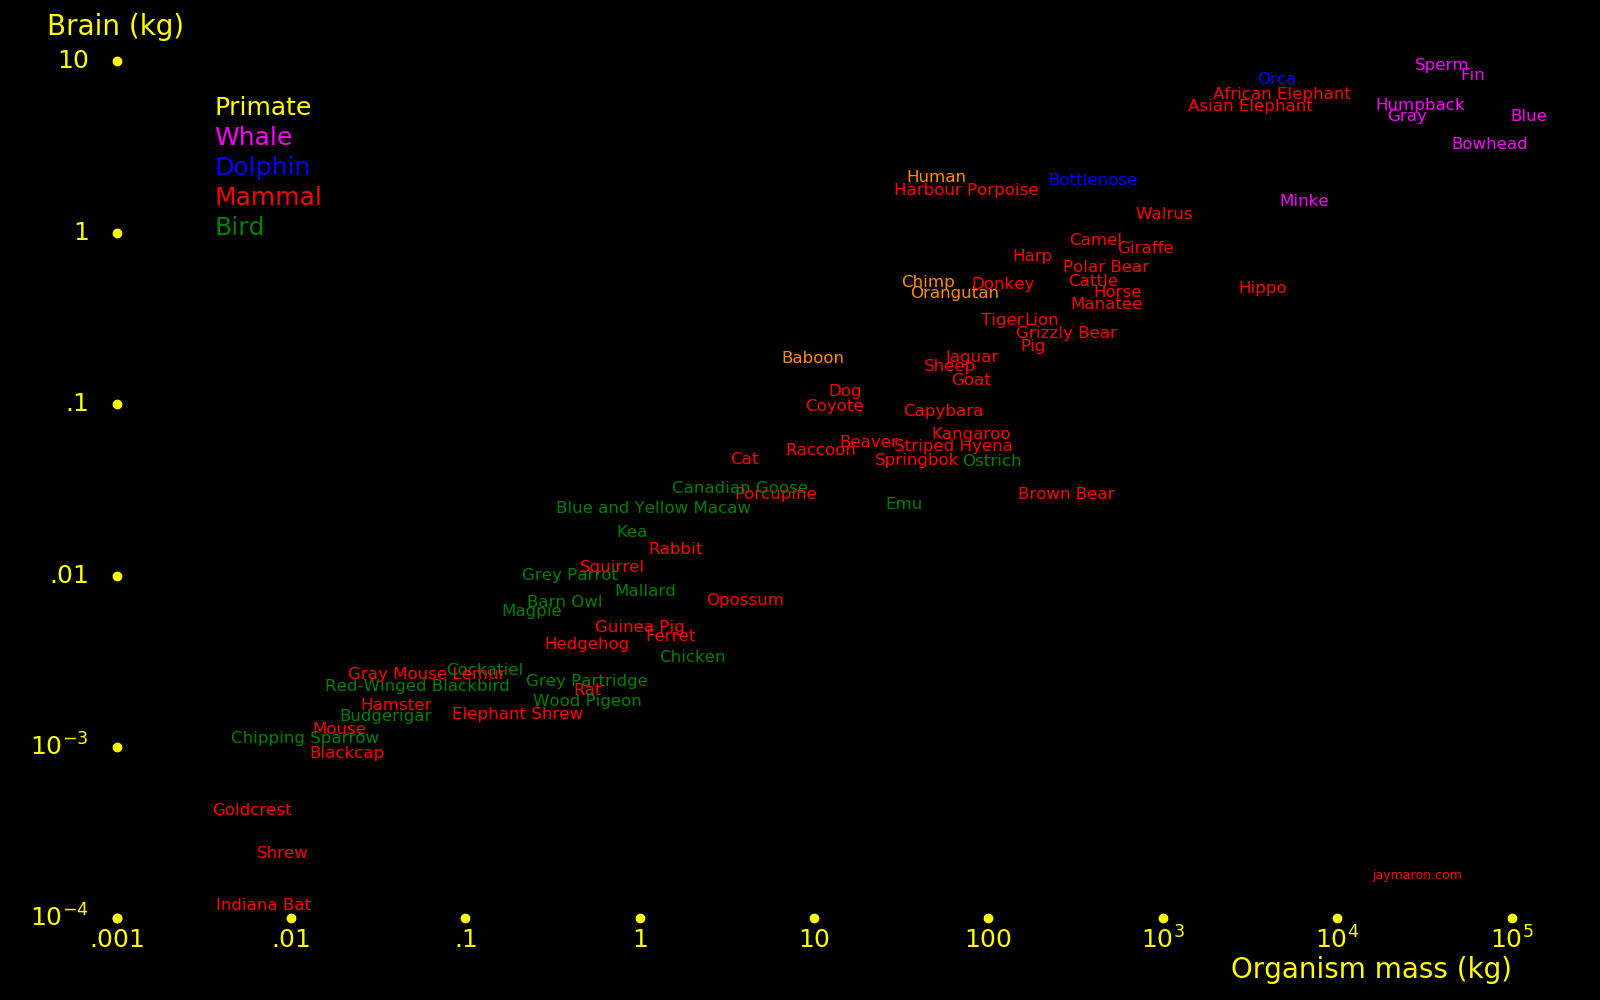
Metabolic power/mass scales as Mass-1/4.
The biomass distribution scales as Mass0, hence most mammal metabolic power is expended by small organisms, not large organisms.
 |
|---|
Data from pantheria.org.
A human brain is 1.6 kg and uses 20 Watts.
 |
|---|
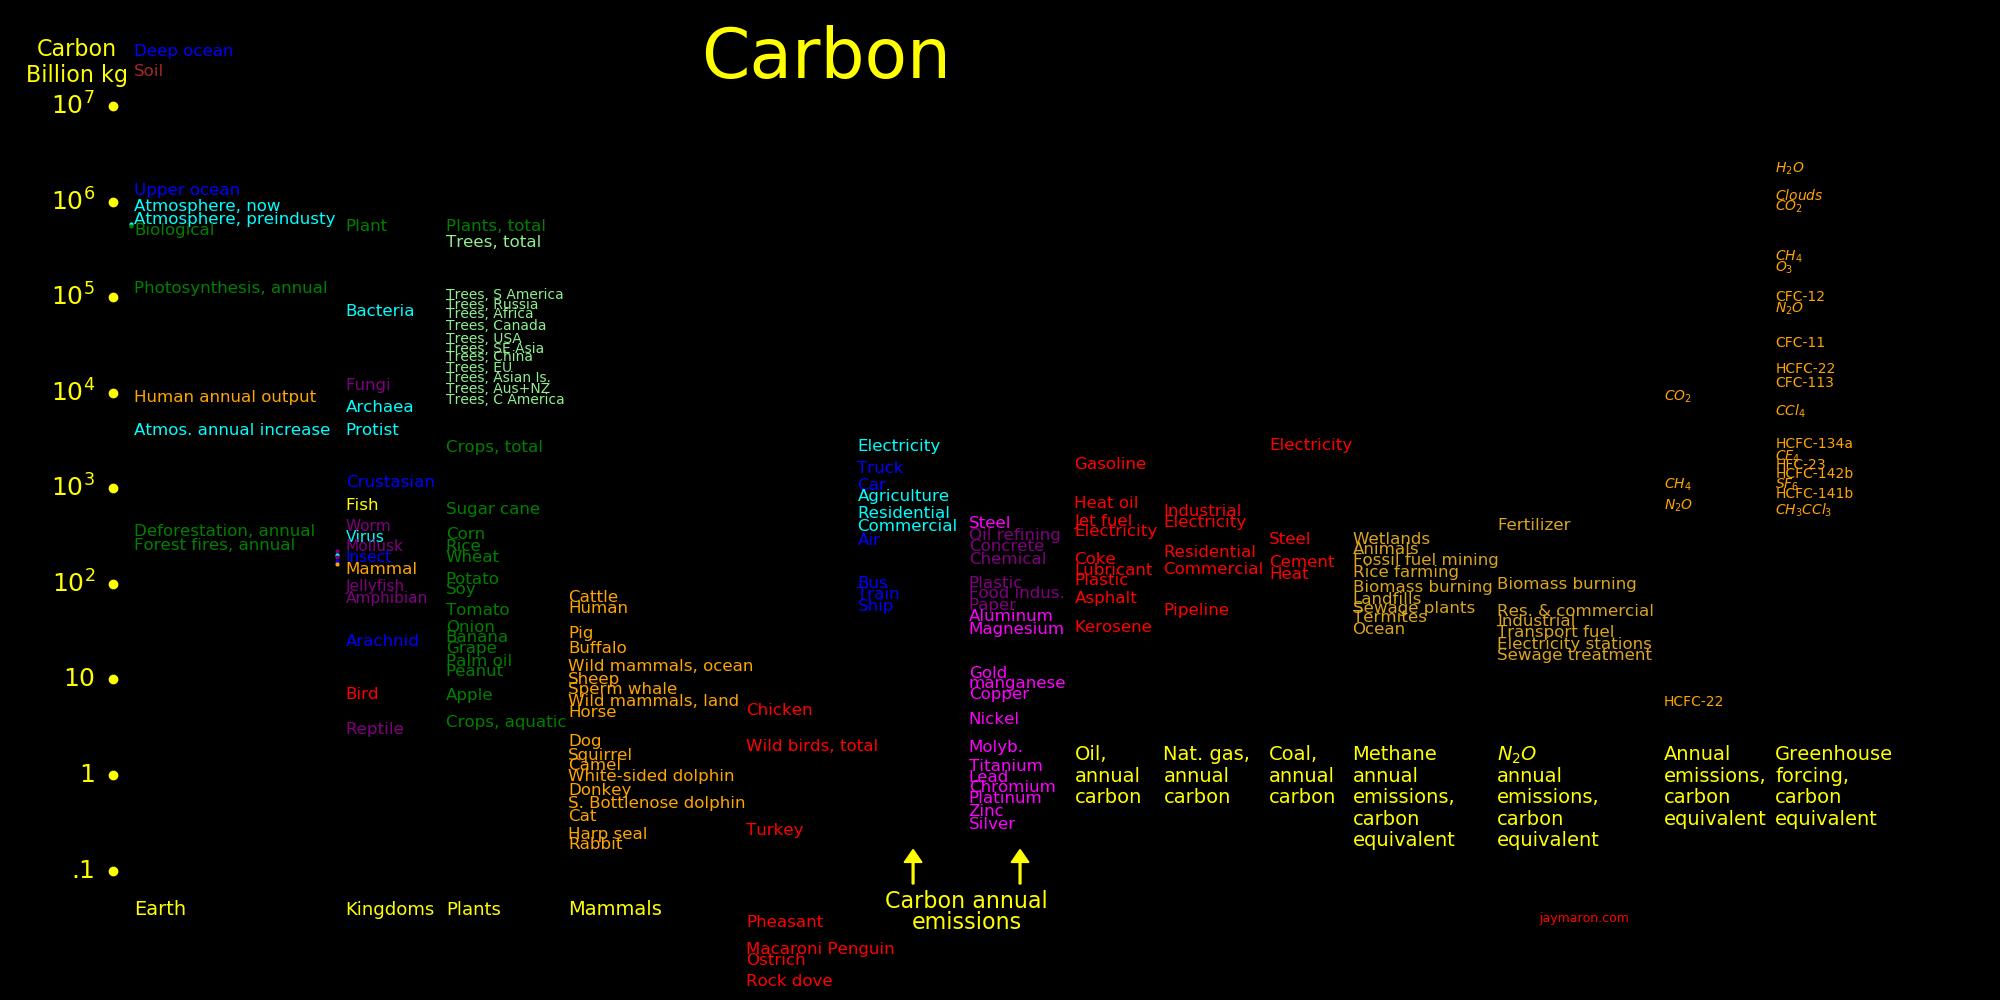
Land               Bkg             Ocean        Bkg

Plants         3300000             Crustasian  4800
Plants, trees  2600000             Fish        4200
Bacteria        420000             Mollusk     1140
Fungi            72000             Plant       1000
Archaea          42000             Jellyfish    620
Protist          24000             Mammal       120
Crops            14000             Virus        100
Worm              1320
Virus             1100
Insect            1050
Amphibian          600
Arachnid           150
Mammal, wild        30
Reptile             18
Bird, wild          12

Mammal, human      360
Mammal, domestic  1000
Bird, domestic      30
 |
|---|
              World biomass   Population   Mass
                   Bkg         millions     kg

Whale, total            40       1.5
Dolphin, total           7      50
Seal, total              6      25

Whale, sperm            16        .40    40000
Whale, fin               6        .10    60000
Whale, S Bottlenose      3        .5      6000
Whale, blue              2.5      .02   125000
Whale, humpback          2.4      .080   30000
Whale, bowhead           2.2      .030   75000
Whale, bryde             1.4      .095   15000
Whale, sei               1.1      .057   20000
Whale, right              .6      .01    60000
Whale, gray               .6      .026   25000
Whale, orca               .4      .1      4500

Dolphin, white-sided     4.9    41         120
Dolphin, orca             .45     .1      4500
Dolphin, spotted          .3     3         113
Dolphin, bottlenose       .24     .6       400
Dolphin, striped          .2     2         100

Seal, crabeater          1.6     8         204
Seal, harp               1.4     8         180
Seal, elephant            .7      .5      1400
Seal, brown fur           .4     2.1       185
           World biomass   Mass   Population
               Bkg          kg

Dog, wild       3
Fox, red        1.2          8
Cat, wild        .5
Bear, black      .15       154
Bear, brown      .06       278
Bear, polar      .018      475
Jaguar           .005       81
Leopard          .004       54
Wolf, grey       .002       40
World biomass (Bkg)
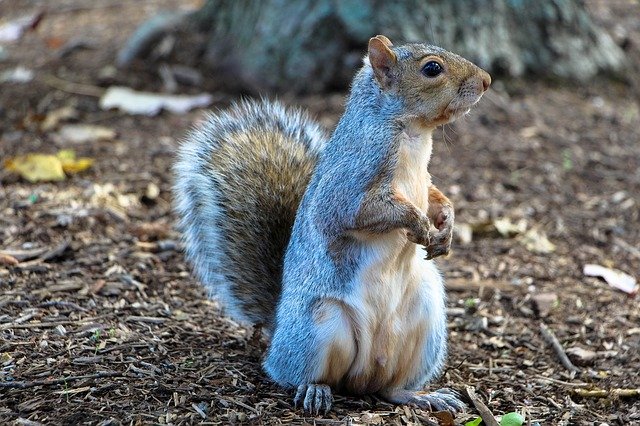
Squirrel 7
Raccoon 3.8
Elephant 2.4
Rat 1.9
Kangaroo 1.2
Rabbit 1.1
Deer 1.0
Fox .8
Moose .58
Hippo .45
World biomass Population Mass
Bkg millions kg
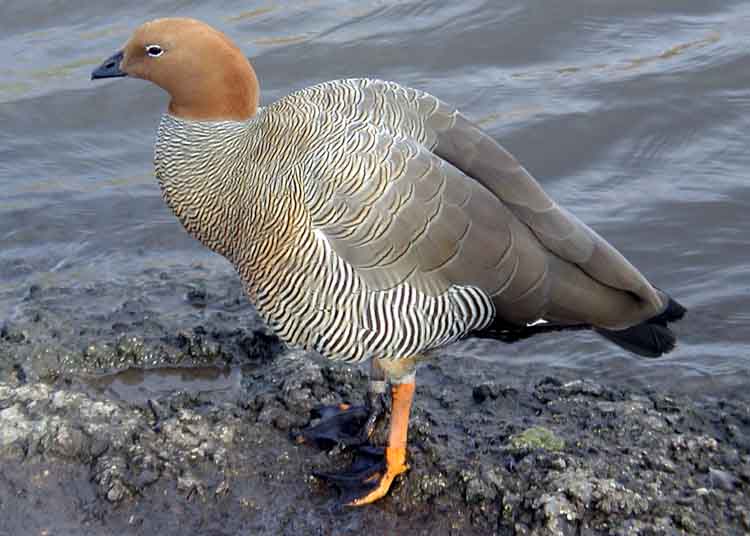
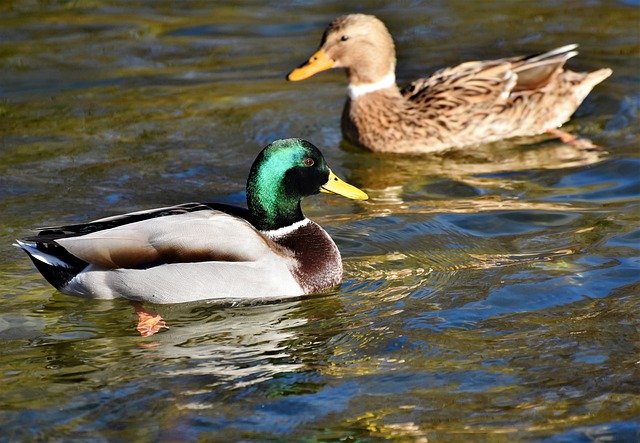
Duck total .10 100 1.0
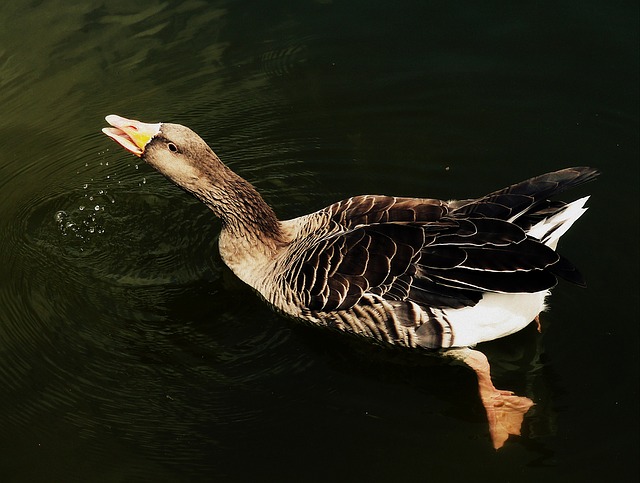
Goose total .07 20 3.75
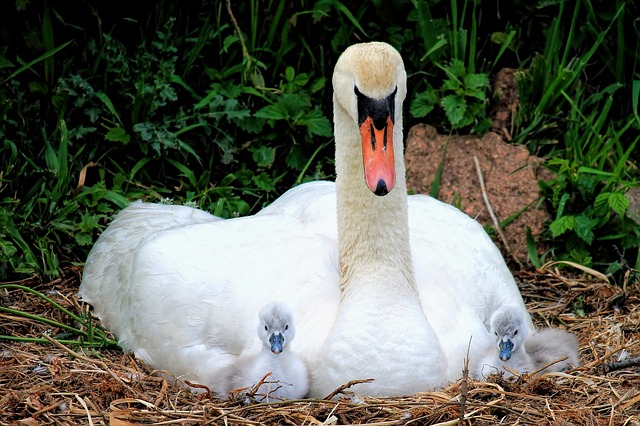
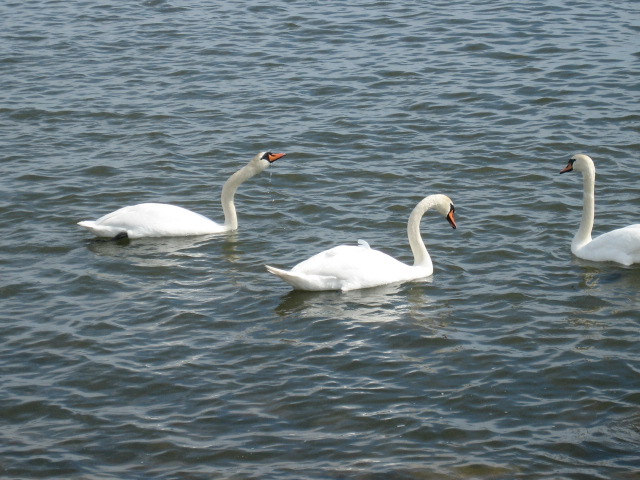
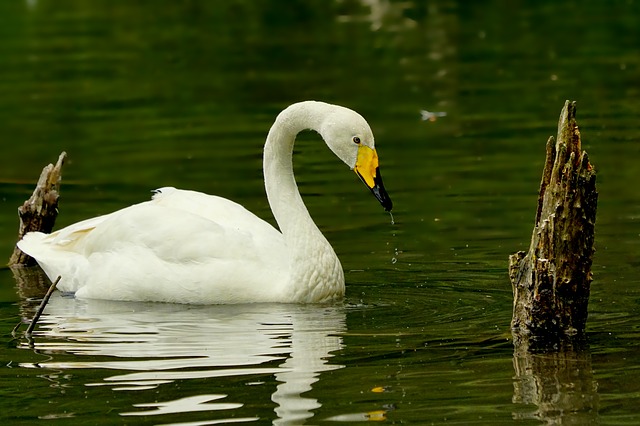
Swan total .02 2 10
Duck, mallard .021 19 1.08
Duck, pintail .004 5.35 .8
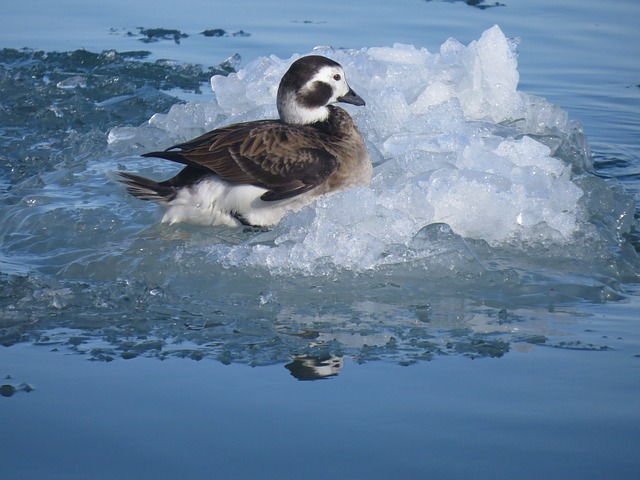
Duck, long-tail .004 5 .74
Goose, Canadian .022 6 3.75
Goose, snow .019 6 3.2
Swan, mute .0072 .605 11.9
Swan, whooper .0021 .18 11.4
Swan, tundra .0018 .3 6.1
Swan, black .0017 .3 5.8
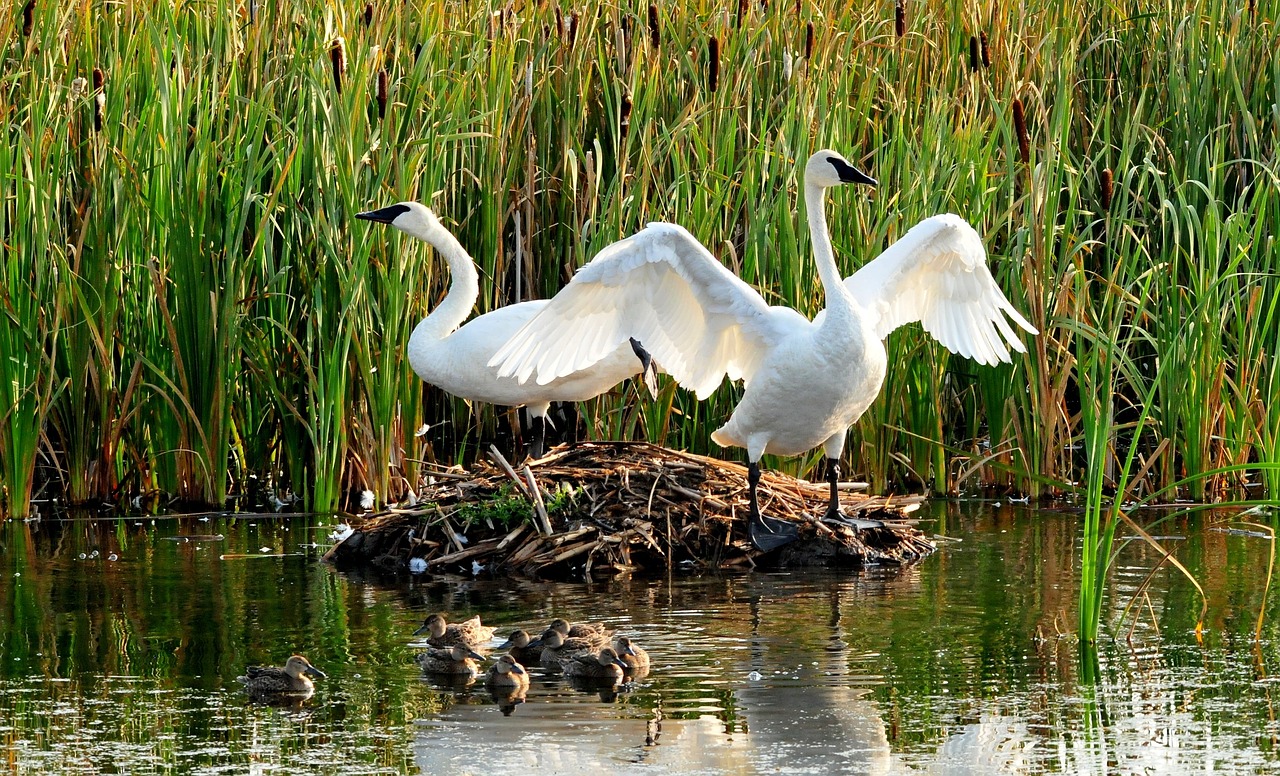
Swan, trumpeter .0005 .046 11.6
World biomass Population Mass
Bkg millions kg
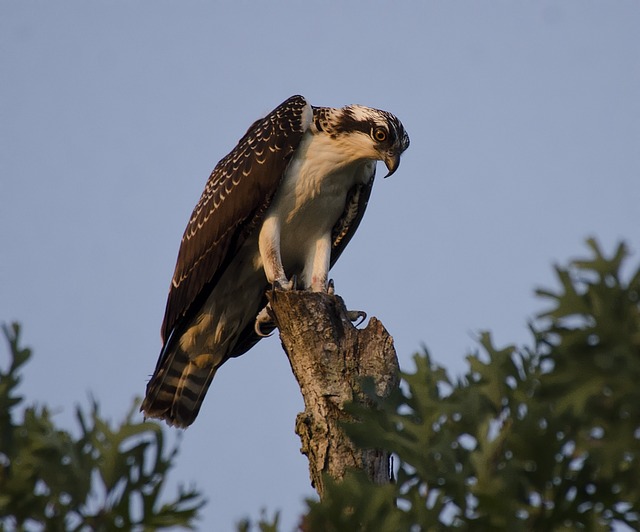
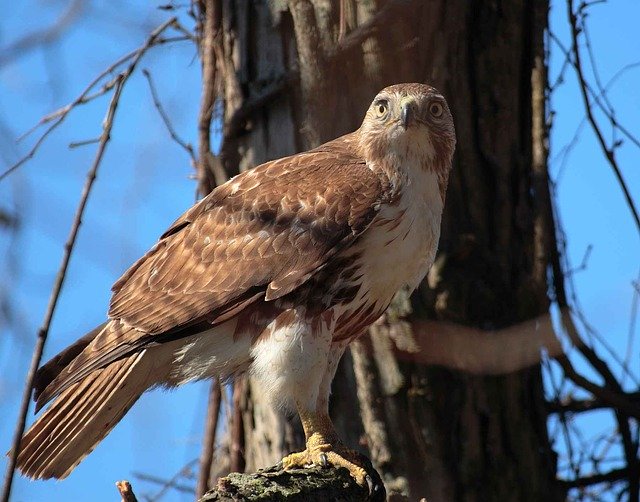
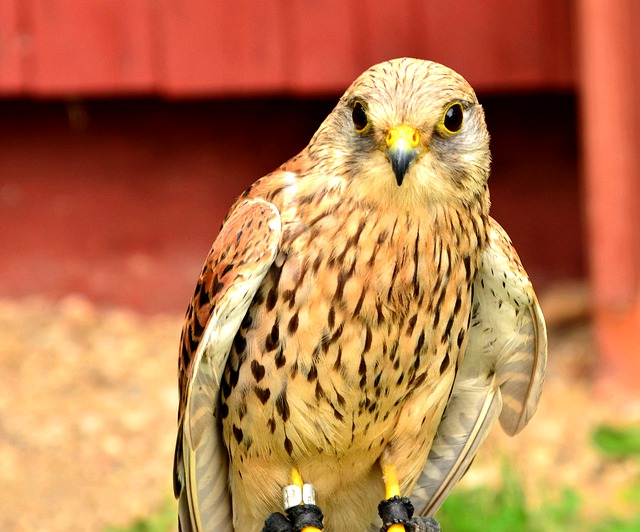
Hawk, red-tailed .0028 2.6 1.06
Goshawk .0019 2 .956
Buzzard .0017 4 .43
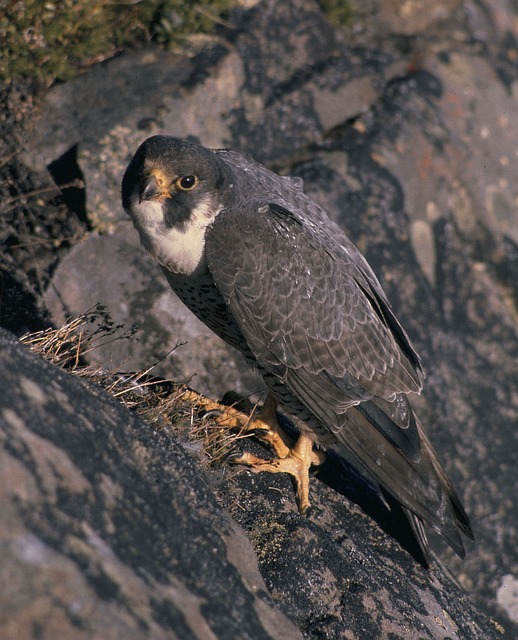
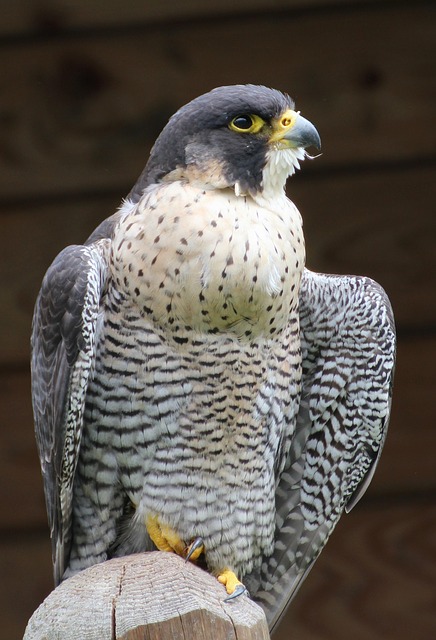
Peregrine falcon .0012 1.2 1.0
Kestrel .0009 5 .184
Falcon, laughing .0009 1.6 .57
Hen Harrier .0005 1.3 .40
Hawk, roadside .0004 1.6 .275
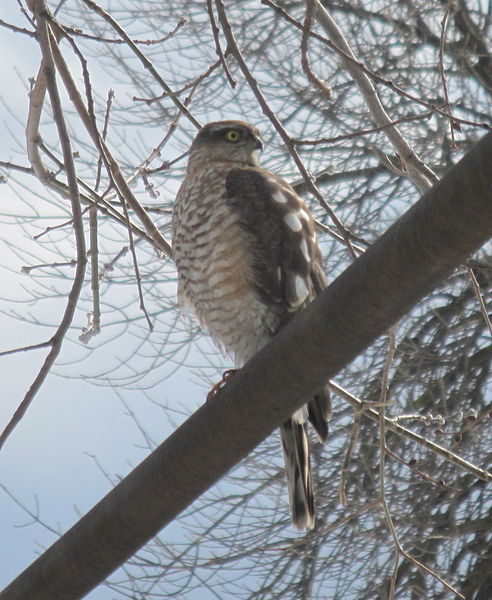
Hawk, Eurasian .0003 1.5 .22
Merlin .0003 1.3 .195
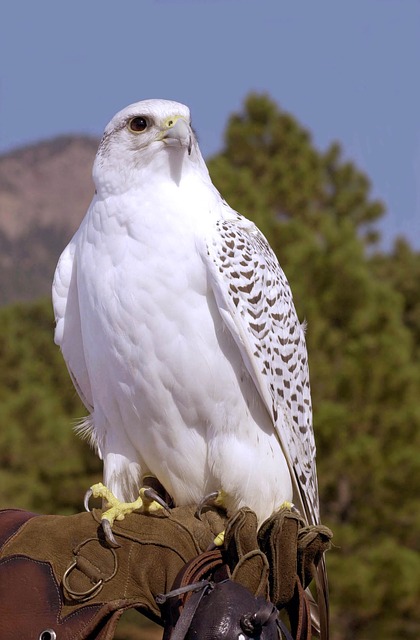
Gyrfalcon .0002 .11 2.1
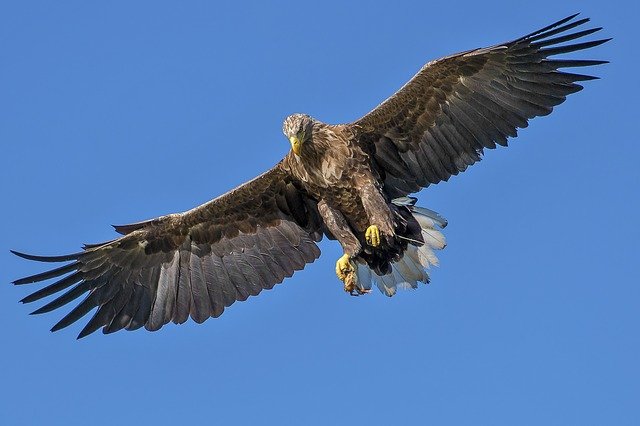
Eagle, golden .0007 .17 4.18
Eagle, snake .0002 .1 1.68
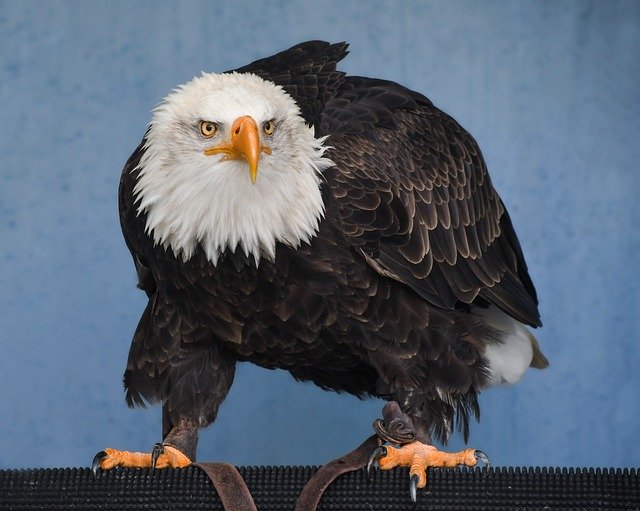
Eagle, bald .0001 .02 4.85
Eagle, hawk .0001 .1 .85
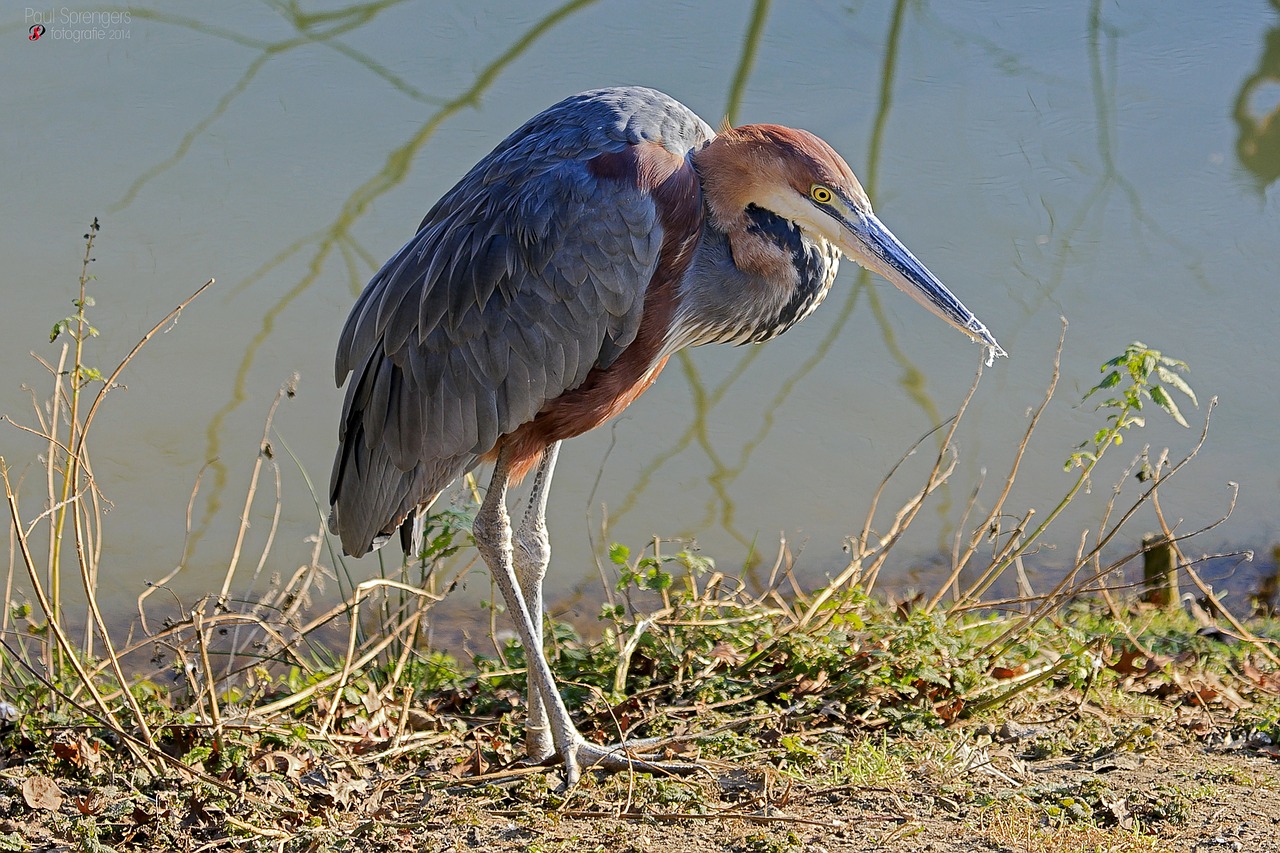
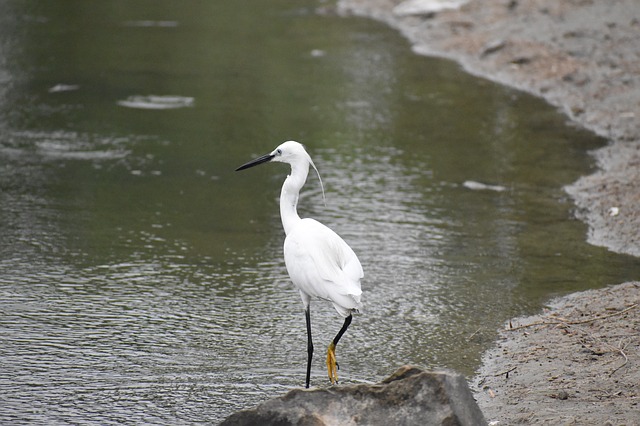
Heron, grey .0014 1.0 1.4
Egret, cattle .0012 5.4 .22
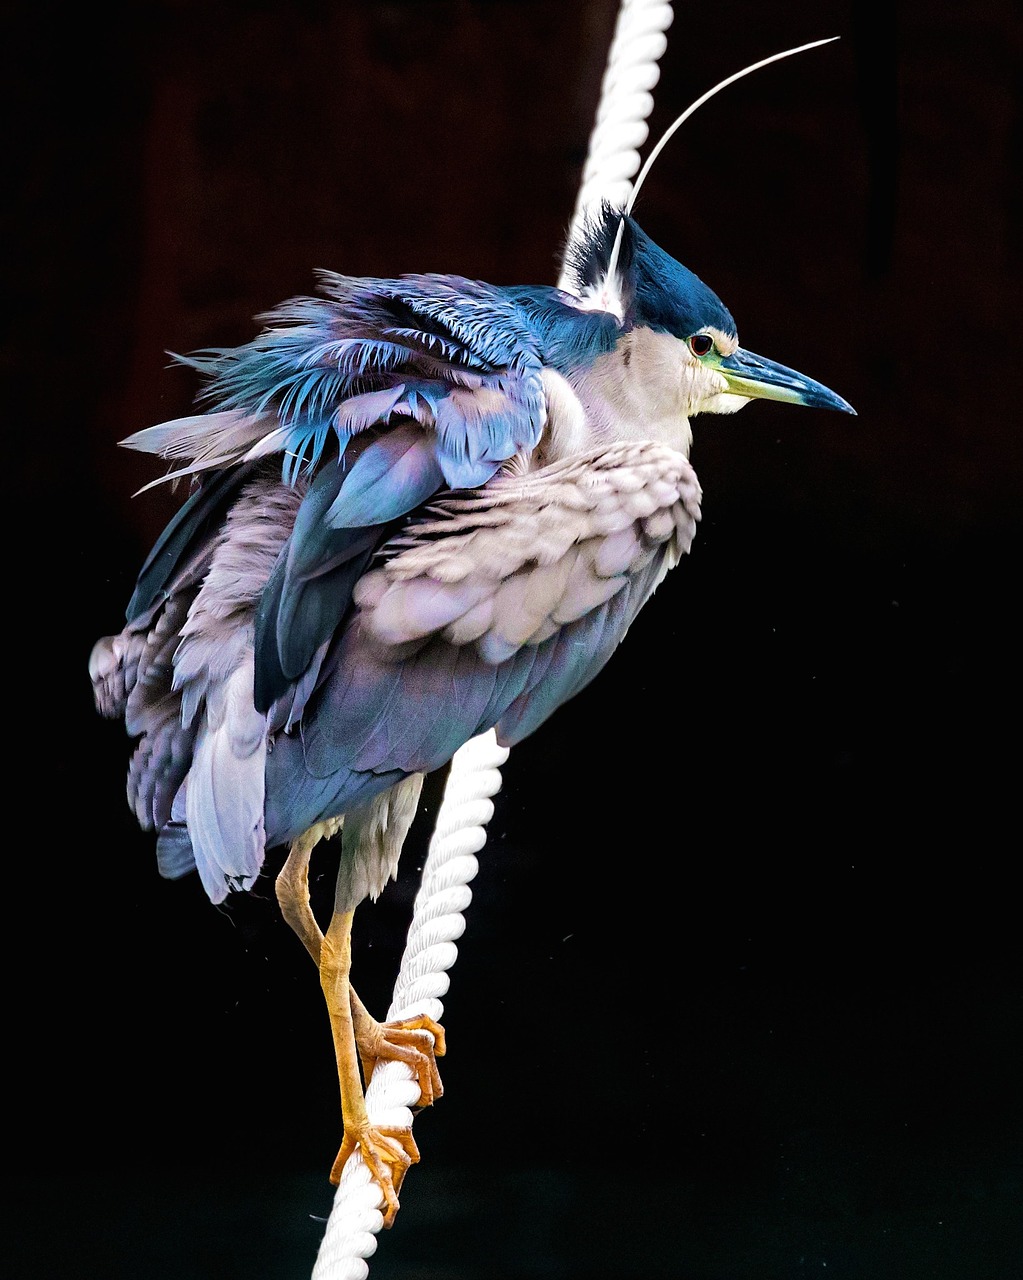
Heron, boat-billed .0003 1.6 .2
For Manhattan,
           Mass  Number per  Number per   Mass/area
                   person     hectare
            kg                            (Humans=1)

Human       65      1          300        1
Cat, wild    3.9     .143       43         .0086
Pigeon        .27   1.5        450         .0062
Rat           .32   1.0        300         .0049
Squirrel      .5     .03         7.5       .00023
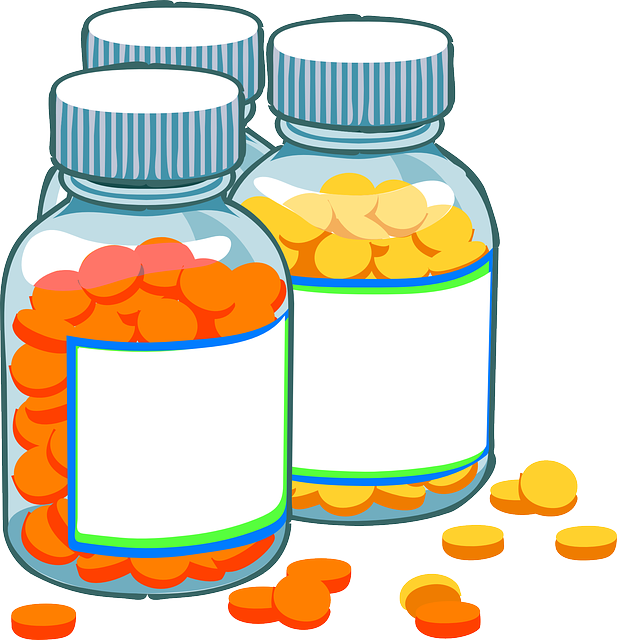
Almost all vitamins fit into one pill, with the exception of calcium, potassium, phosphorus, and magnesium, which can be supplemented separately. The nutrient requirement for animals and plants is:
            Human       Bird         Crop         Supplement
           gram/day   gram/day      gram/kg

Calories     2200      165           0
Protein        50        9           0
Potassium       3.5       .4        14            Potassium phosphate
Phosphorus      1.0       .4         1.5          Potassium phosphate
Calcium         1.0       .8         2            Calcium chloride or calcium acetate
Magnesium        .35      .4         1.5          Magnesium chloride
Iron             .27      .2          .14
Zinc             .075     .05         .038
Manganese        .075     .05         .038
Copper           .022     .02         .011
Nitrogen        0        0          15            Ammonium nitrate
Sulfur          0        0           1.5          Ammonium sulfate
We assume a 75 kg human and a 1 kg bird. For other masses, scale accordingly. For crops, the nutrient requirement is in grams of nutrient required to produce 1 kg of biomass. Crop biomass is typically 1/2 edible food.
For young birds, calcium and phosphorus are especially important, for bones. For egg-laying birds, calcium is important for egg shells.
Bones are made of calcium and phosphorus, in a 2:1 ratio. For a 1 kg bird,
Calcium    = 14.0  grams
Phosphorus =  6.5  grams
Potassium  =  4    grams
Magnesium  =  1    grams
For bones,
Calcium fraction         = .279
Phosphorus fraction      = .130
Calcium/phosphorus ratio =  2.1
The best bone supplements are calcium chloride (CaCl2) and monopotassium phosphate (KH2PO4).
 |
 |
 |
 |
|---|---|---|---|
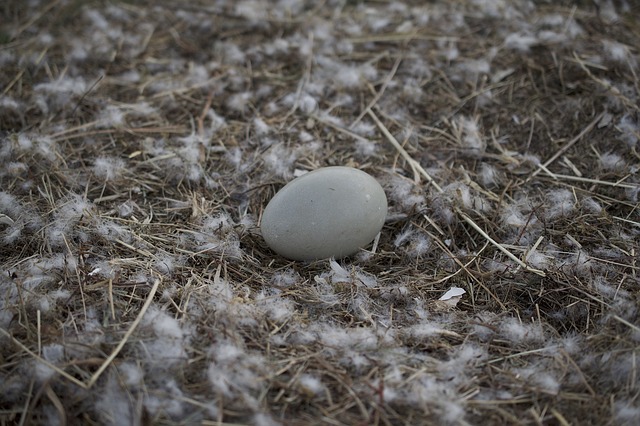
For a chicken egg,
            Mass     Calcium
            grams     grams

Egg total    60       1.95
White        36.6      .0023
Yolk         18.3      .028
Shell         5.1     1.92
Almost all the calcium is in the shell. Eggs are 3.2% calcium. Shells are 94% calcium carbonate (CaCO3) and calcium carbonate is 40% calcium.
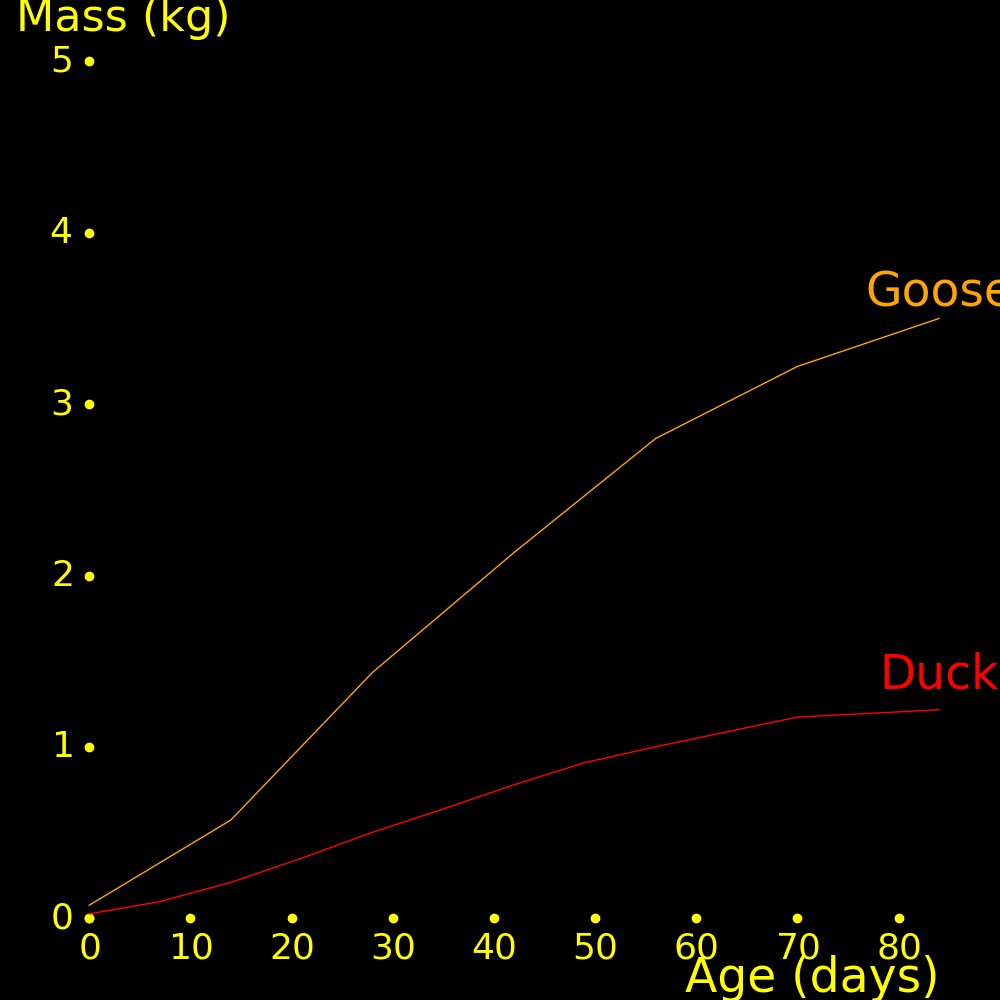
An egg is typically 3% of the mass of the adult bird.
It takes 50 days for a bird to grow to adult size.
 |
|---|
 |
 |
 |
 |
 |
|---|---|---|---|---|
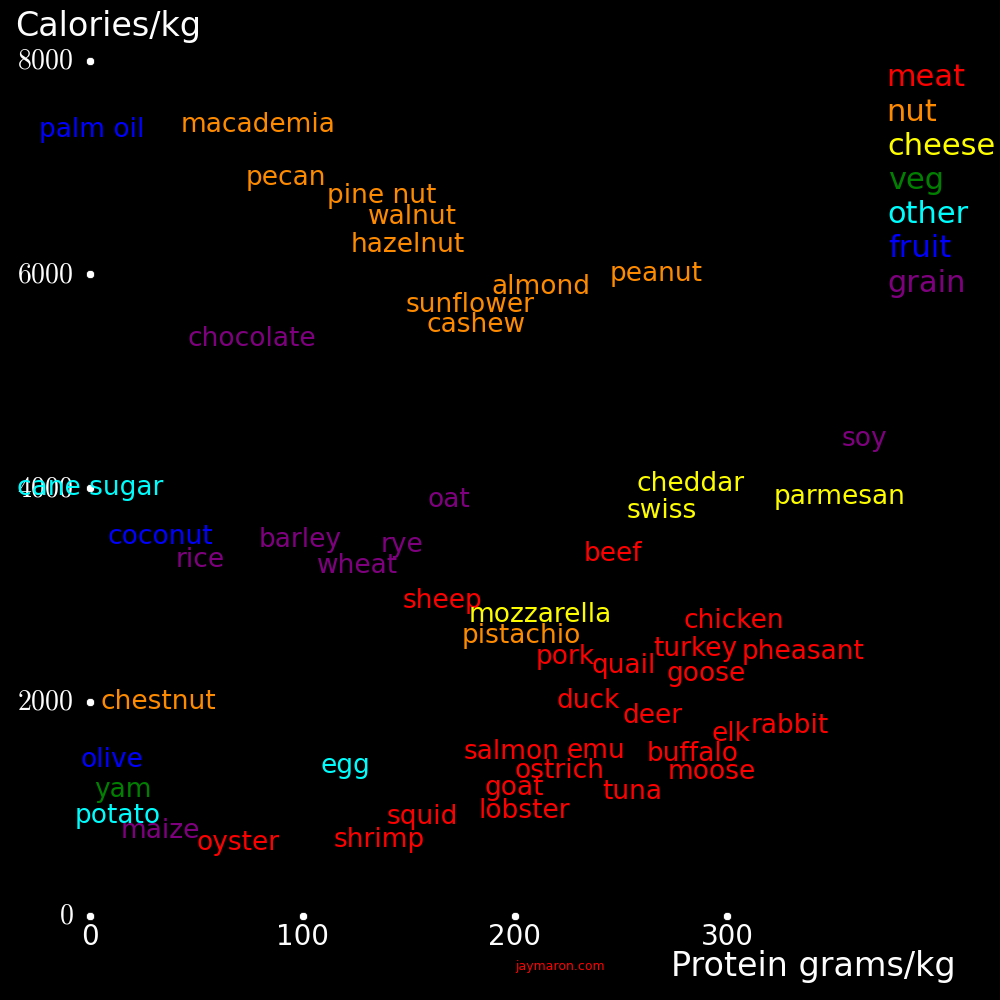
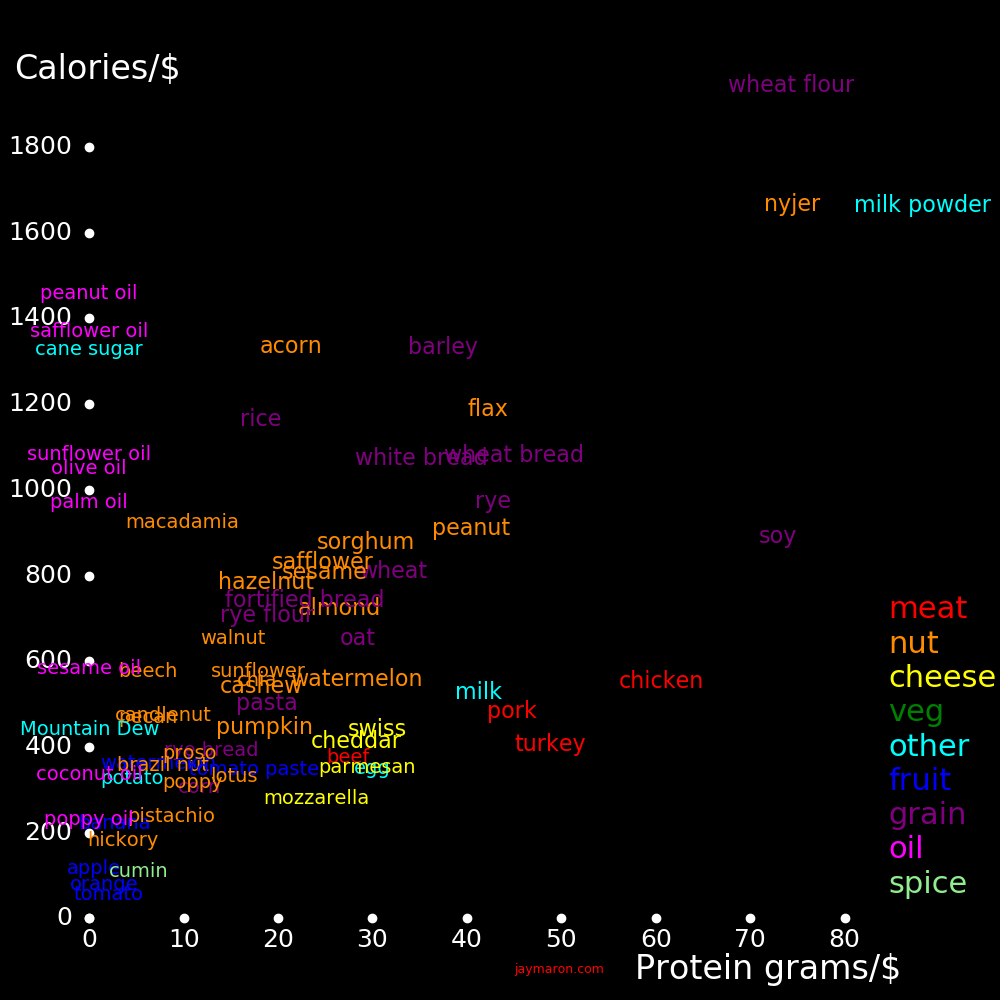
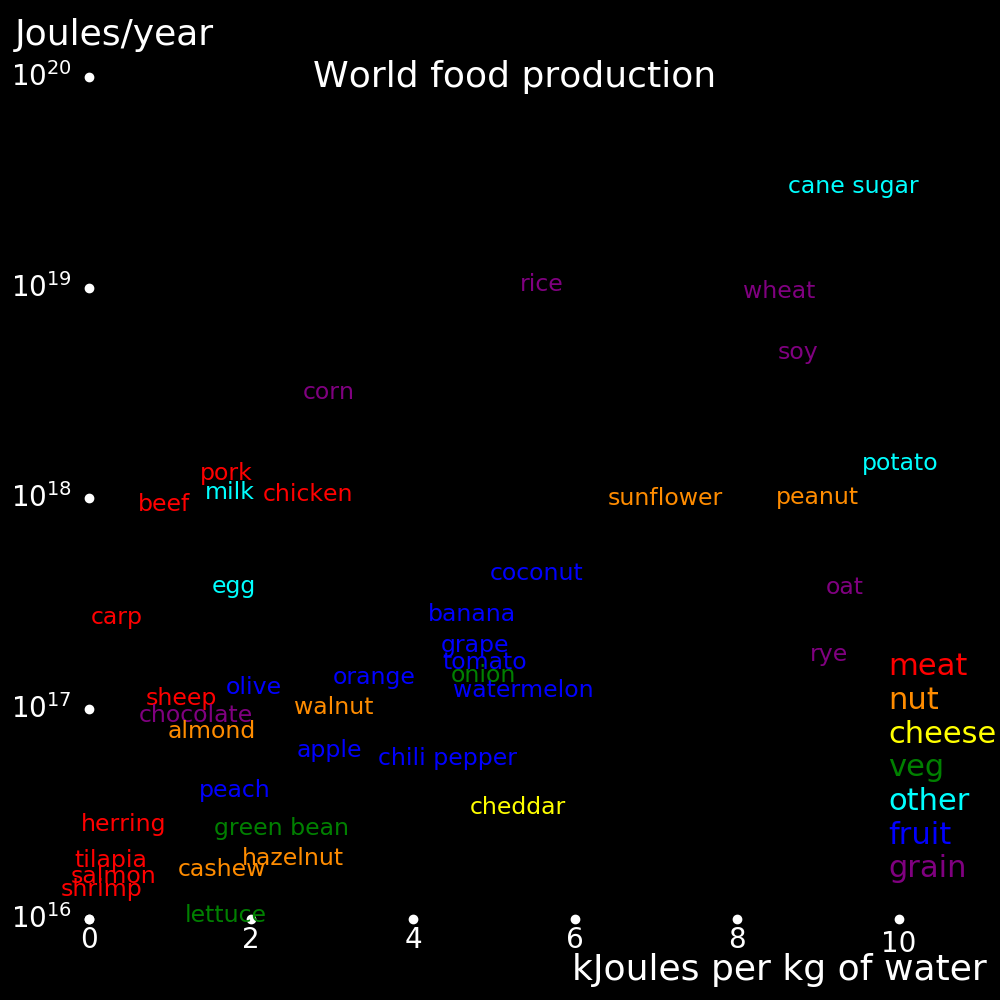
The left plot shows the protein and calorie content of food. Foods with high protein and low fat are in the lower right. Nuts are heavy in protein, especially peanuts.
The right plot shows how much calories and protein you get per dollar. The cheapest meats are pork, chicken, and turkey.
 |
 |
|---|---|
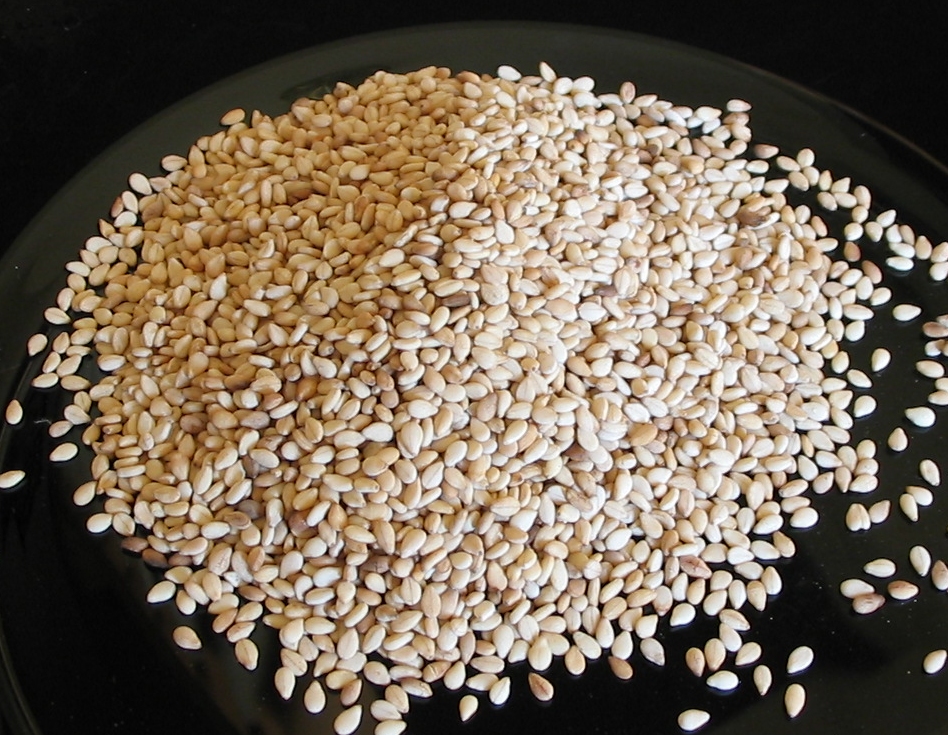
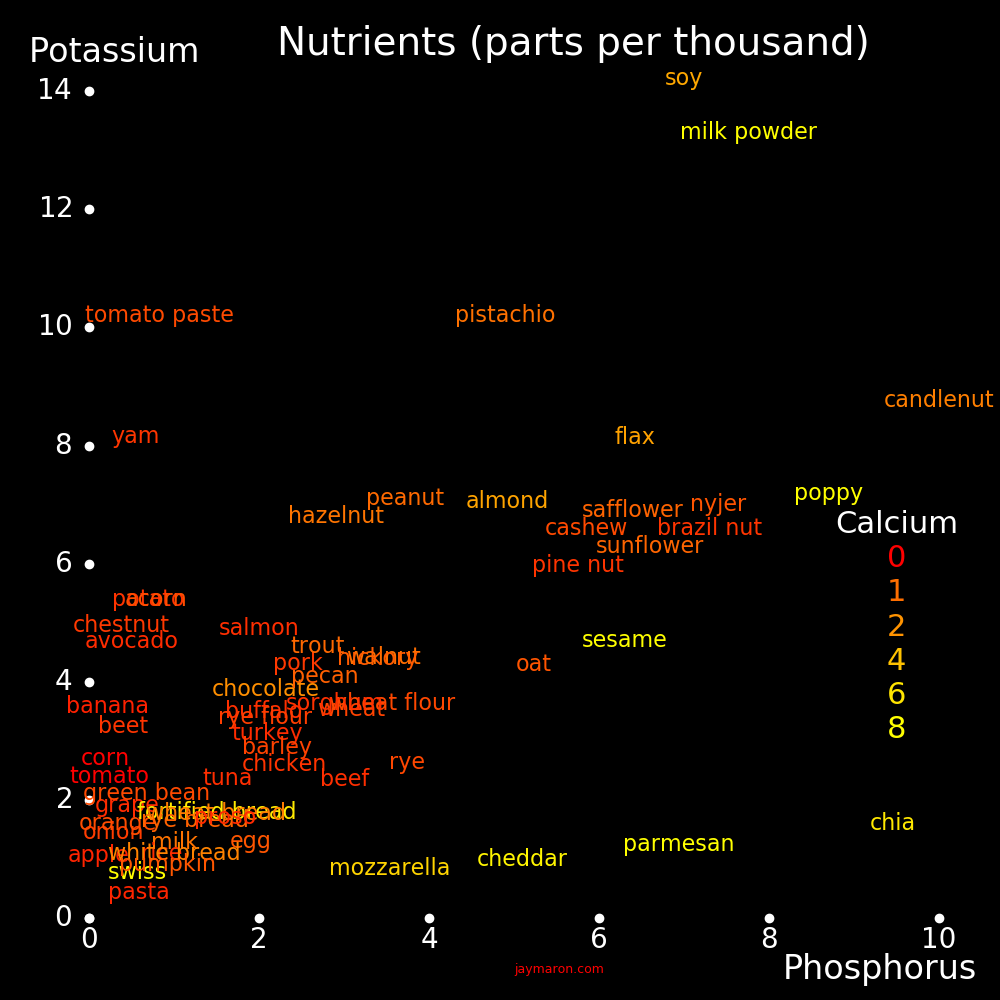
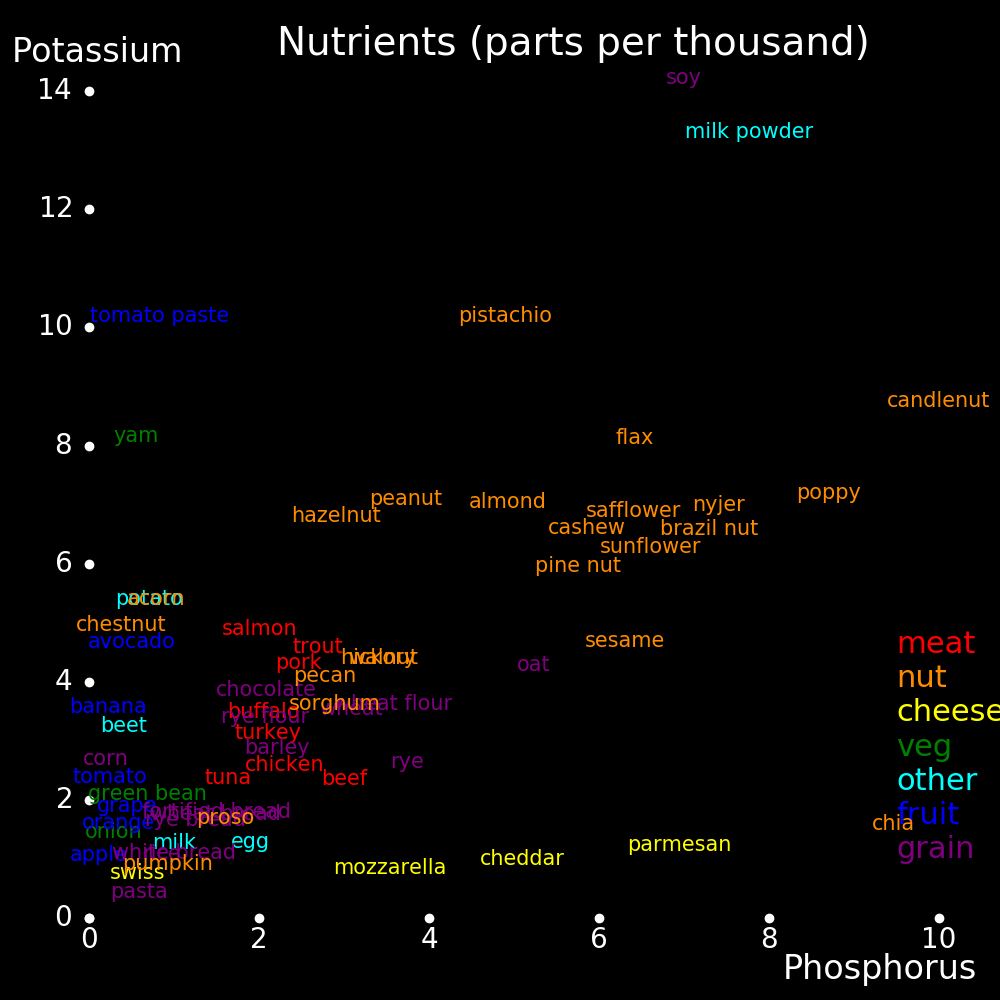
The plot shows the potassium, phosphorus, and calcium content of food. Calcium is abundant in cheese and milk and rare in other foods. Sesame is rich in calcium.
 |
|---|
 |
 |
|---|---|
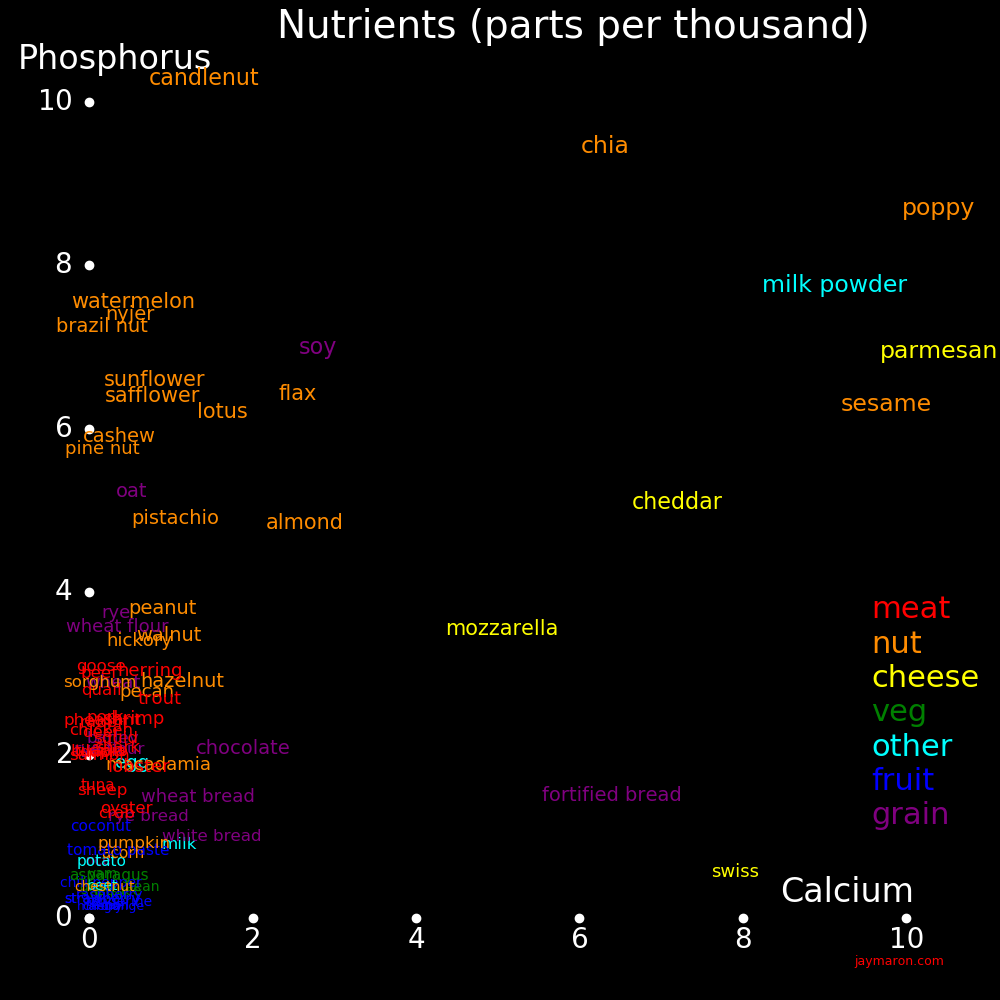
The plot shows the phosphorus and potassium content of food. Most nuts are rich in these elements.
 |
|---|
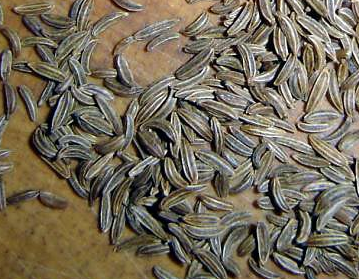
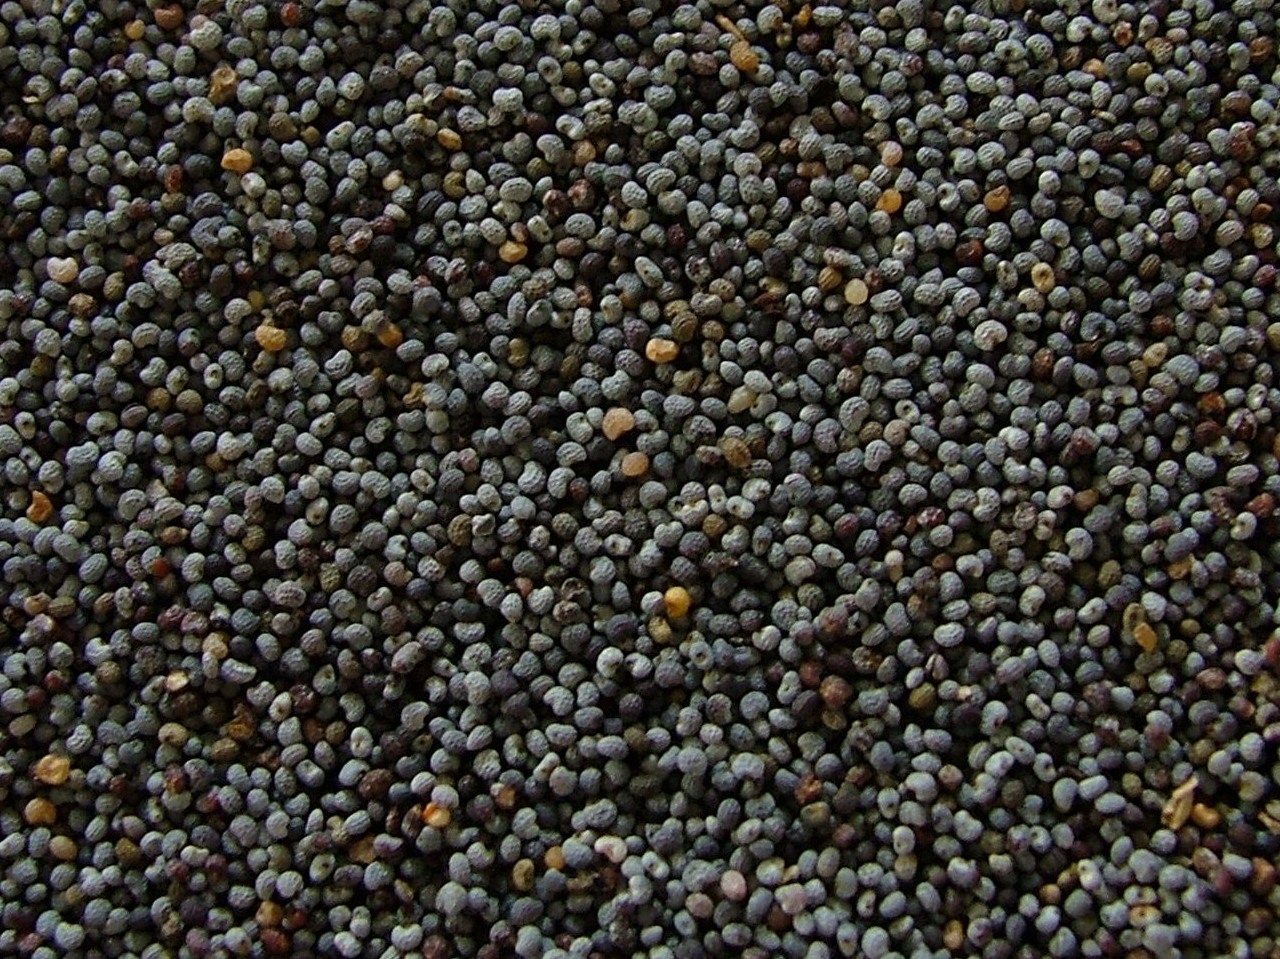
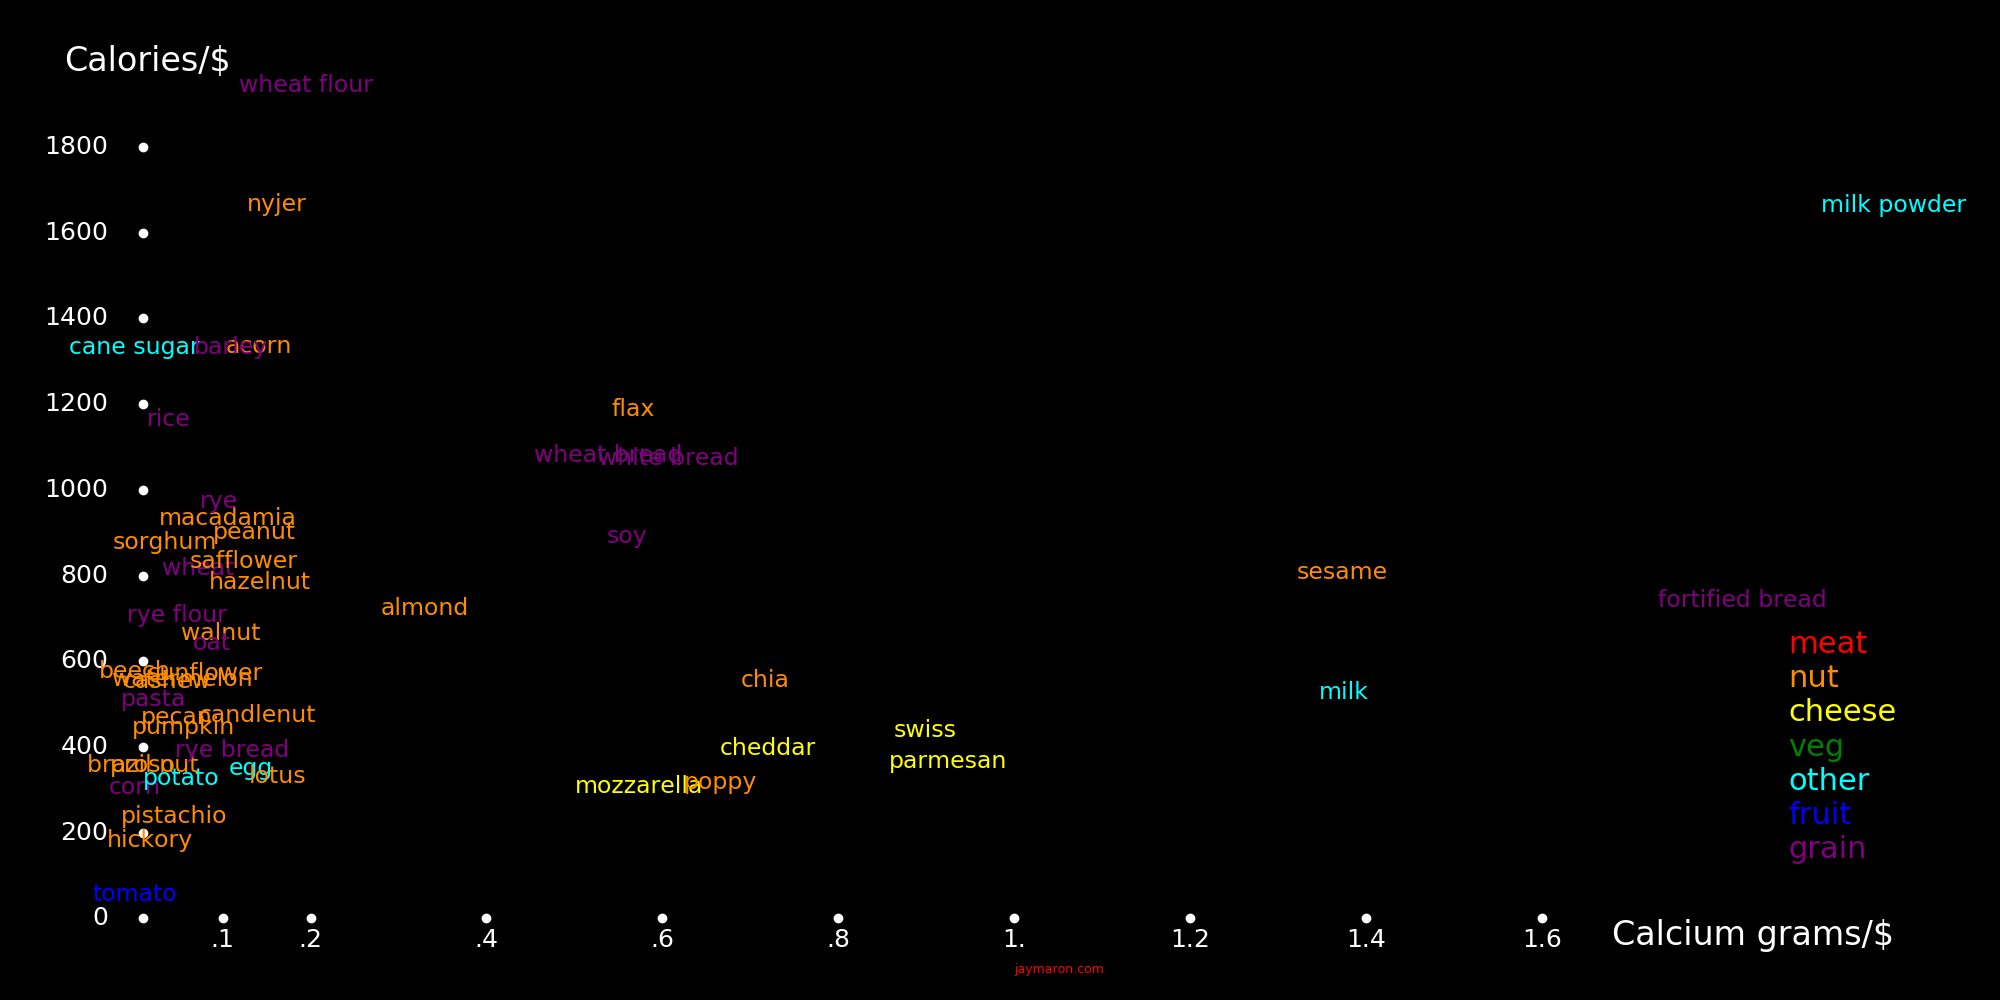
For bird seed, what matters is calories and calcium, and the best seeds are sesame and nyger.
 |
|---|
 |
|---|
A simple and cheap fertilizer recipe is:
                   Relative mass

Urea                    4
Potassium chloride      4
Monoammonium phosphate  1
Calcium chloride        1
Magnesium chloride      1
Ammonium sulfate        1
Growing 1 kg of biomass requires the following elements:
        Element  Cheapest form          Molecule    Cost   Fertilizer   Element frac   Element cost
         gram                                        $        gram      in fertilizer     gram/$

Nitrogen    15   Urea                   CO(NH2)2    .025      26            .467          482
Potassium   15   Potassium chloride     KCl         .044      29            .524          340
Phosphorus   2   Monoammonium phosphate (NH4)2HPO4  .011       7            .269          185
Calcium      2   Calcium chloride       CaCl2       .011       6            .361          182
Magnesium    2   Magnesium chloride     MgCl2       .036       8            .255           55
Sulfur       2   Ammonium sulfate       (NH4)2SO4   .025       8            .243           79

Total                                               .152      84
Well-irrigated crops produce 1 kg of biomass per meter2 per year. Typical crops are 1/2 edible matter and 1/2 inedible matter. Trees can produce wood at a rate of 2 kg/meter2/year.
As an example, for nitrogen fertilizer,
Nitrogen requirement    = n =       =   15  grams           to produce 1 kg of biomass
Urea nitrogen fraction  = u =       = .456
Urea requirement        = U = n / u =   33  grams
Nitrogen cost per kg    = c =       =  482  gram/$
Nitrogen cost           = C = n/c   = .029  $
The appendix has a table with all possible fertilizer molecules.
 |
 |
 |
 |
 |
 |
|
|---|---|---|---|---|---|---|
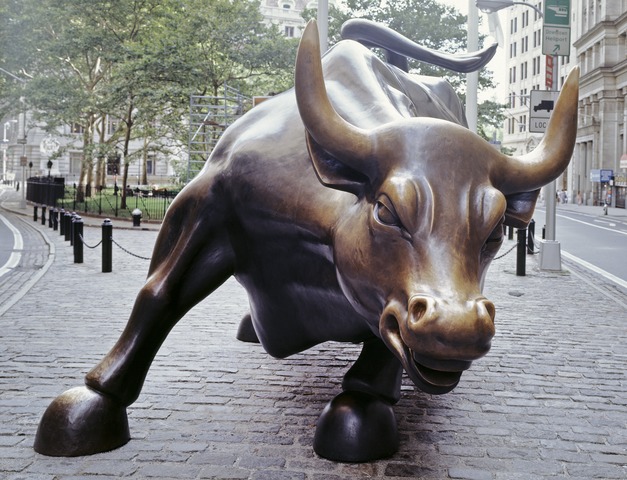
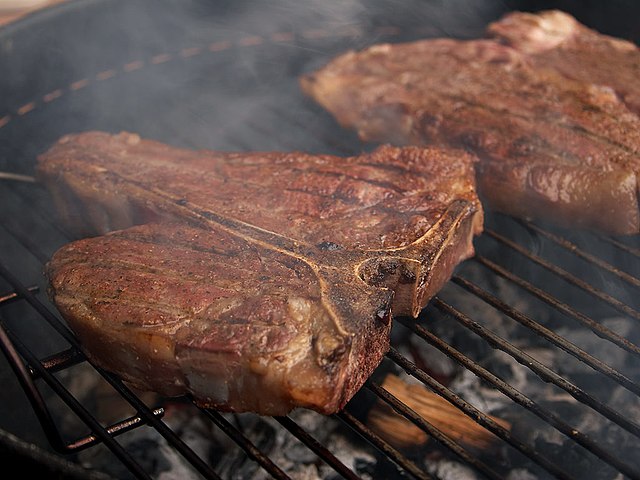
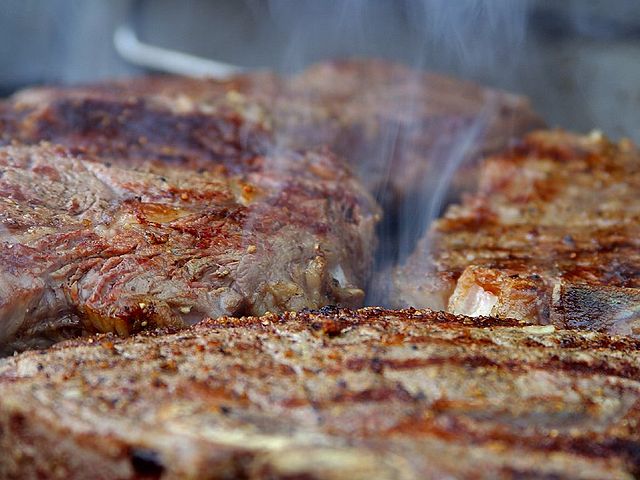
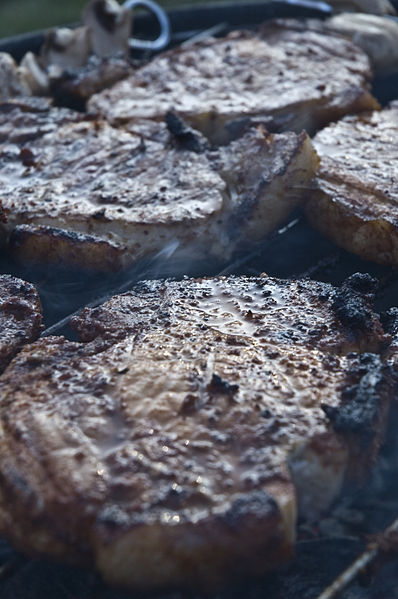
Cows have been a pillar of the economy since prehistoric times. They turn cheap grass into valuable beef and dairy products, they're easy to herd, and they can harness land that isn't good enough for agriculture.
Where there is abundant water, farmers produce fruit and rice. Where there is little water, they produce cows.
 |
|---|
Cattle have as much biomass as humans, and far more biomass than any other mammal.
|
|---|
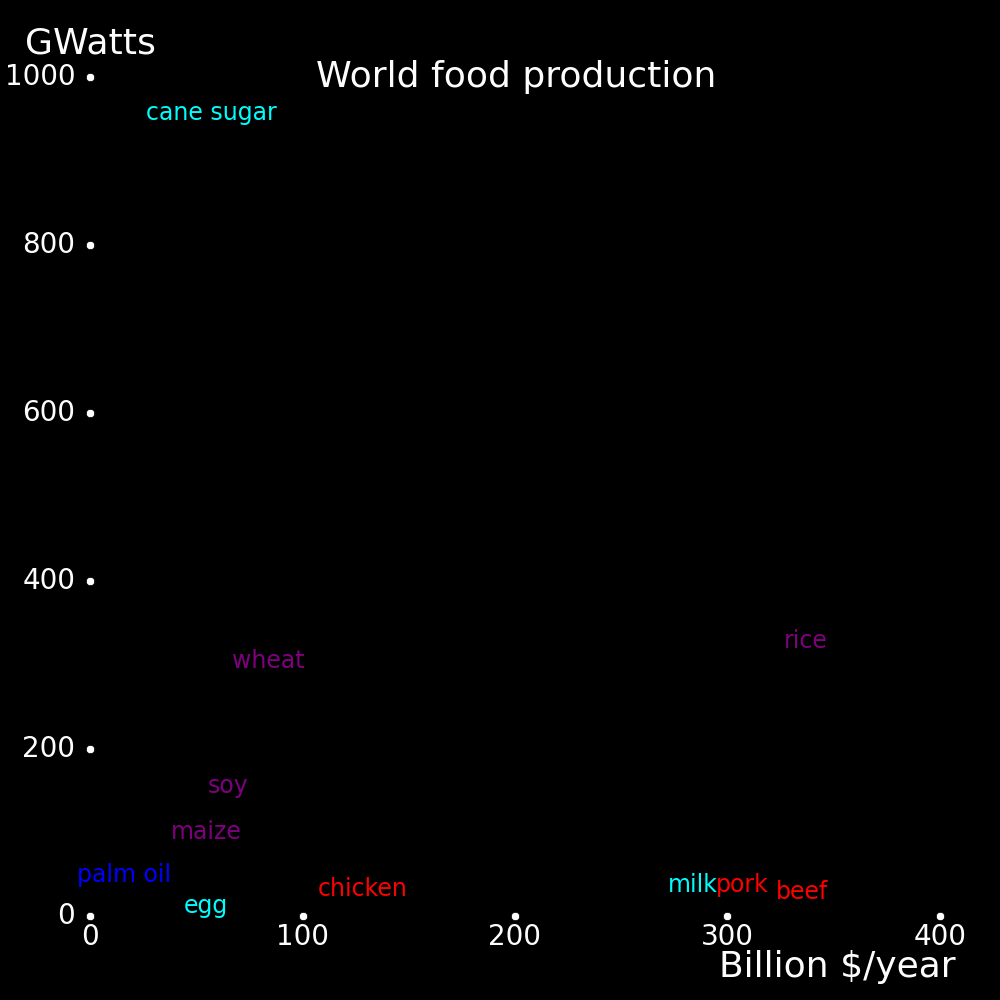
Cattle are a major factor in world food production.
 |
|---|
Cattle are profitable and they are a major factor in the food economy.
 |
 |
|---|---|
The feedstock with the highest protein content is soy. It takes less soy to grow a cow than with other feedstocks. If you can import soy then you can raise cattle with minimal land and minimal maintenance. This is especially important for nations with limited land.
Beef consumption:
          Beef     Cattle/person  Cattle
       kg/day/prsn                million

USA       .062         .11          35
World     .009         .19        1400
Dairy production:
Cow milk production    =10245  kg/cow/year
Cattle feed requirement=   14  kg/day
Average bull mass      = 1090  kg
Average cow mass       =  725  kg
Average cattle mass    =  753  kg
Beef fraction of cattle=  .44
Bovine methane emissions can be neutralized with feedstock additives. The sources of methane are:
                   Fraction   Anthropomorphic

Wetlands              .22
Animals               .21          *
Fossil fuel mining    .19          *
Rice farming          .12          *
Biomass burning       .08          *
Landfills             .06          *
Sewage treatment      .05          *
Termites              .04
Oceans                .03
 |
 |
 |
|---|---|---|
 |
 |
|
|---|---|---|
 |
 |
|---|---|
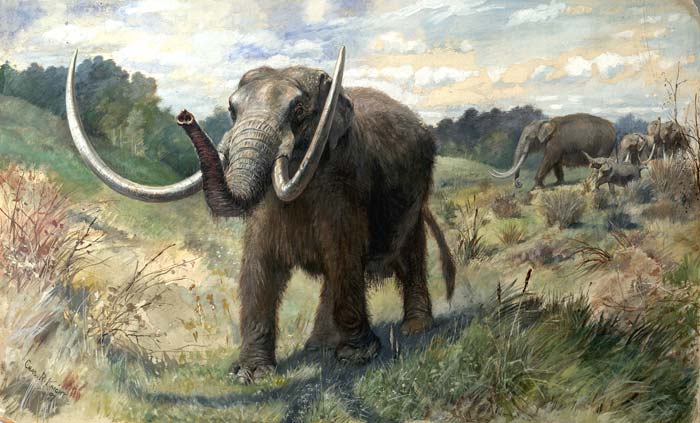
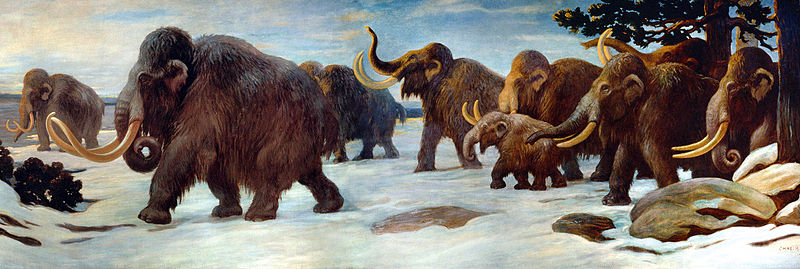
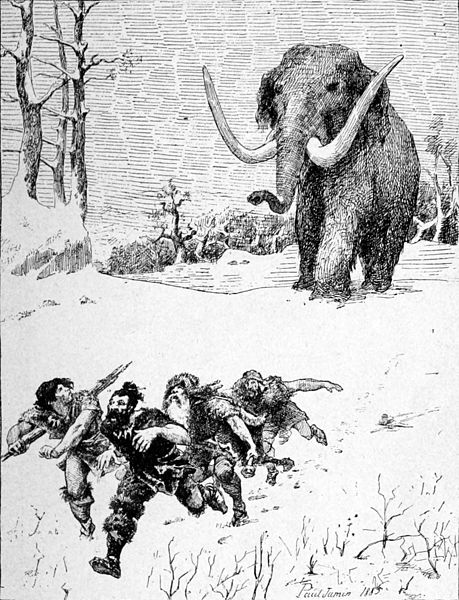
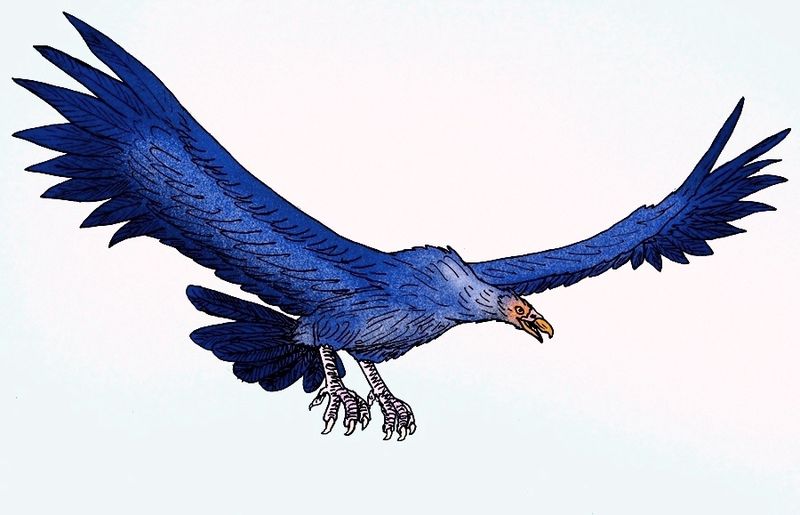
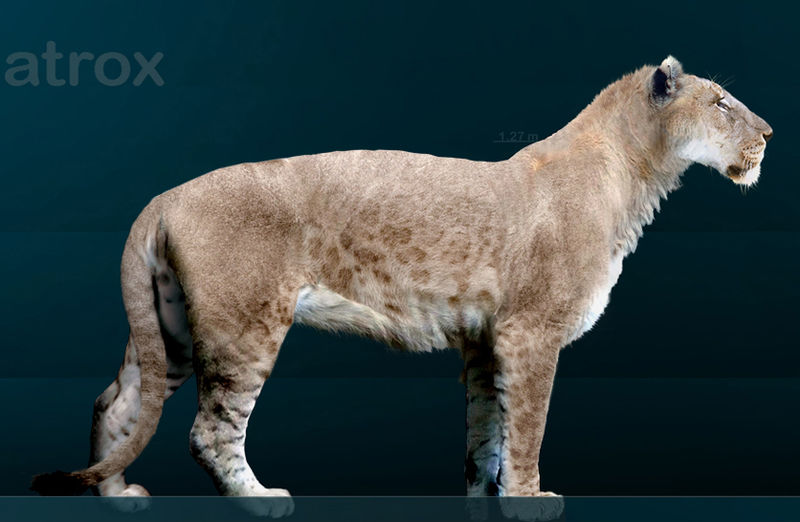
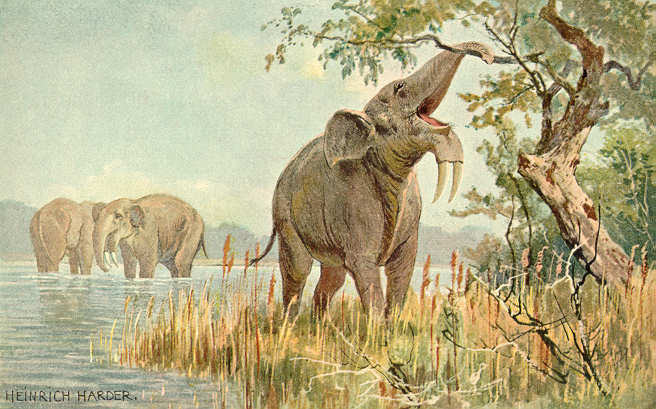
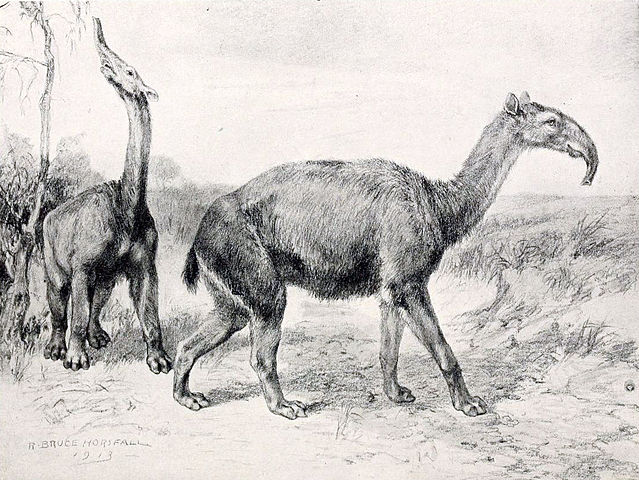
Extinction        Myears ago

Haast's Eagle       .0006     Year 1400 CE
Woolly Mammoth      .0040
Mastodon            .010
Macrauchenia        .010
American Lion       .011
Glyptodon           .011
Diprotodon          .046      Marsupial
Titanis            1.8
Deinotherium       7
Argentavis       ~10
 |
|---|
   Year

 -11000     Livestock
  -9500     Crops
  -6000     Crop rotation. 2-field system
  -4000     Ox power
  -3500     Horse
      0     Trade network
    900     3-field system
   1492     Columbian exchange. Guano fertilizer introduced
   1700     4-field system. Nitrogen-fixing plants
   1800     Fertilizer becomes widespread
   1850     Mechanization
   1895     Refrigeration
   1950     Pesticides
   1980     Genetic engineering
English wheat yield:
Year    Wheat yield (kg/hectare/year)

1500       .018
1550       .022
1600       .029
1650       .031
1700       .038
1750       .047
1800       .063
1850       .073
2020       .8
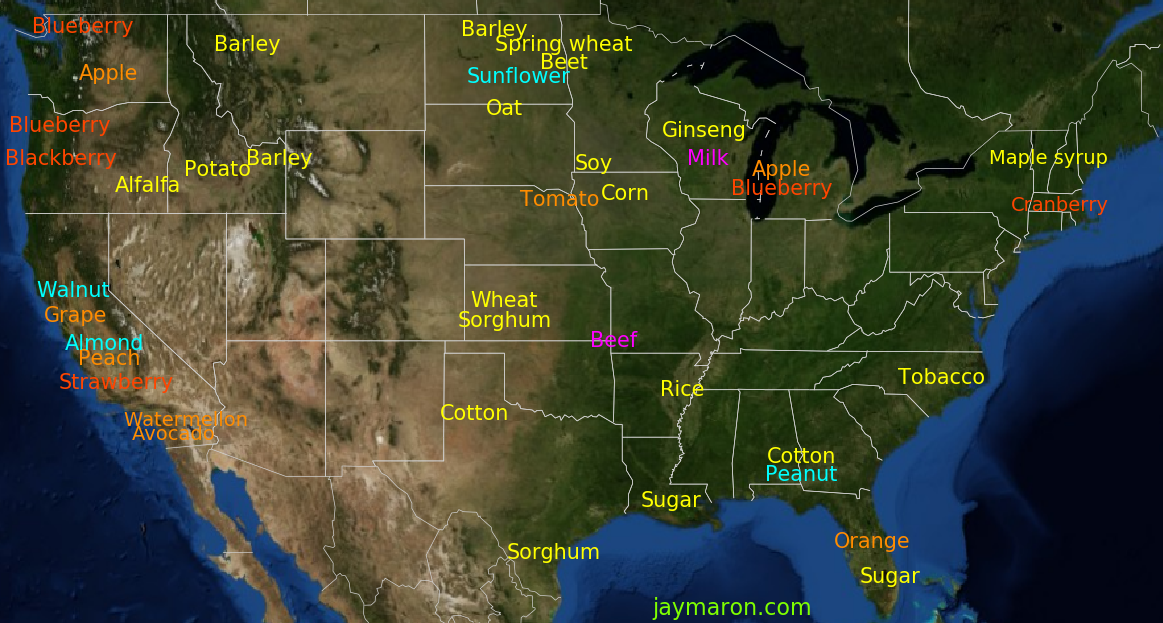
Crop locations are decided by rain, rivers, lakes, reservoirs, aquifers, and aqueducts. Prime farmland is for crops and subprime land is for grazing. There is 2.2 times as much grazing land as cropland, and agriculture is 38% of world land.
The plot shows the center of mass for crops.
|
|---|
 |
 |
 |
 |
|---|---|---|---|
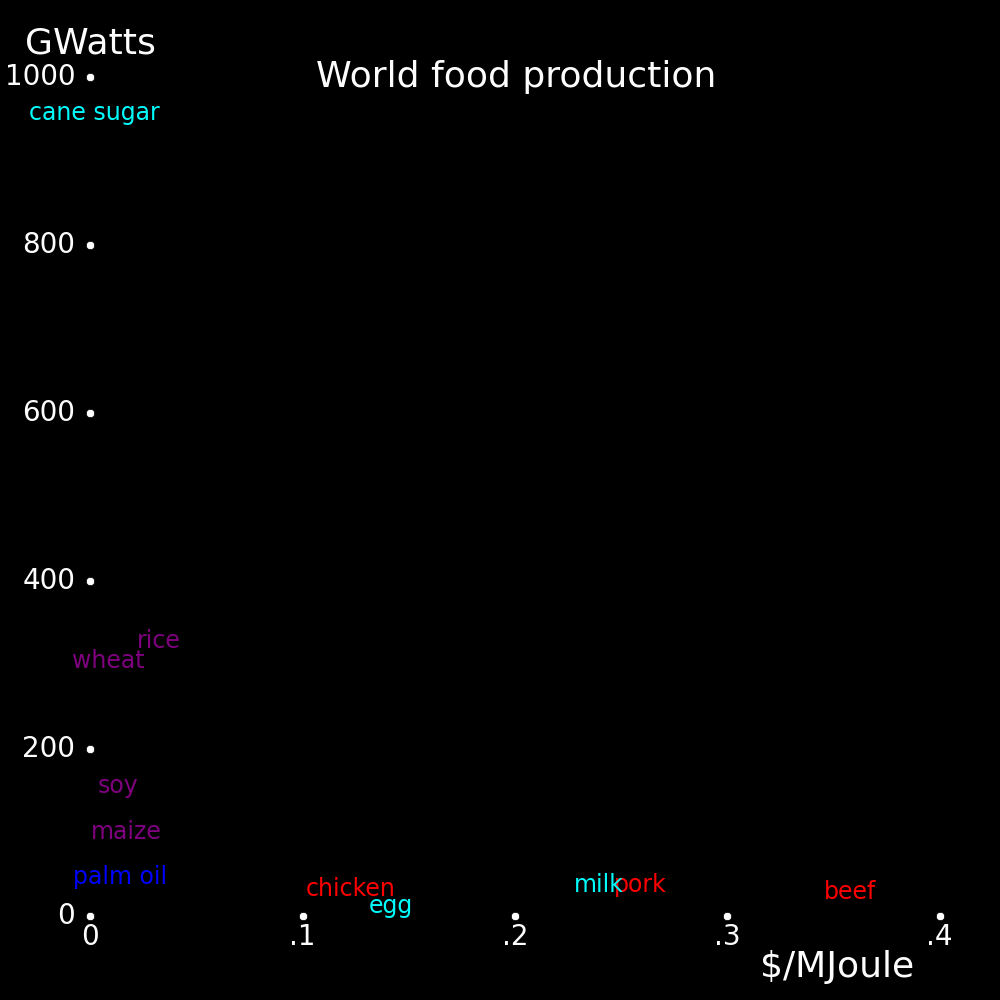
Land can support more people with wheat than with beef, by a factor of 16. Sugar cane is more efficient than wheat by a factor of 16.
Farm productivity is expressed as kg/meter2/year of food. If we factor in the calorie content of the food, we can express this as food production power in Watts/meter2. The value for wheat is 16 times larger than for beef.
The table shows the production power for various foods, with a comparison to solar cells and wind turbines.
Production Energy/Mass Power Type of energy
kg/meter2/yr MJoule/kg Watt/meter2
Solar cell - - 40 Electricity
Wind turbine - - 15 Electricity
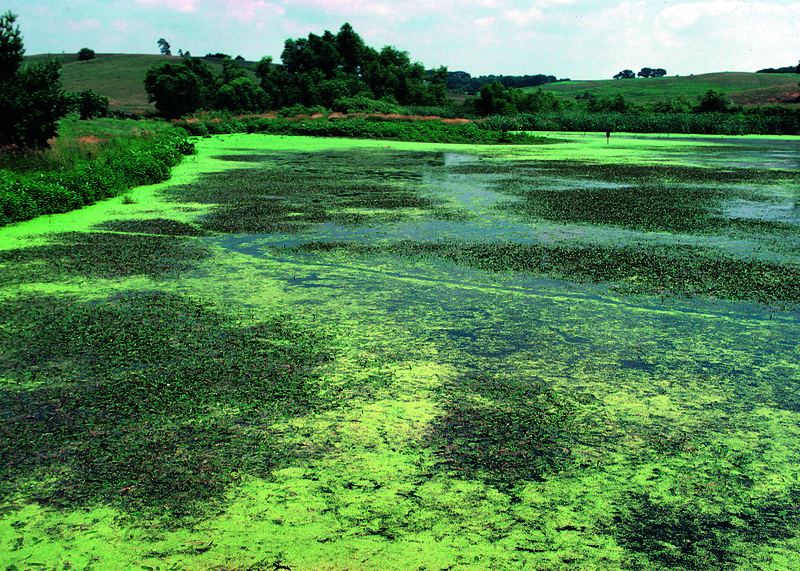
Algae 10 16 5.1 Biomass
Bamboo 2 16 1.0 Biomass
Grass 1 16 .50 Biomass
Typical tree .5 16 .25 Biomass
Sugar cane 8 16 4.1 Food
Wheat .5 14 .22 Food
Milk .6 2.1 .040 Food
Fish .1 9 .028 Food
Goose (grazing) .1 9 .028 Food
Beef (grazing) .05 9 .014 Food
Tomato 8 .8 .20 Food
Tomato, hydroponic 150 .8 3.8 Food
For most crops, 50% of the plant biomass is edible produce.
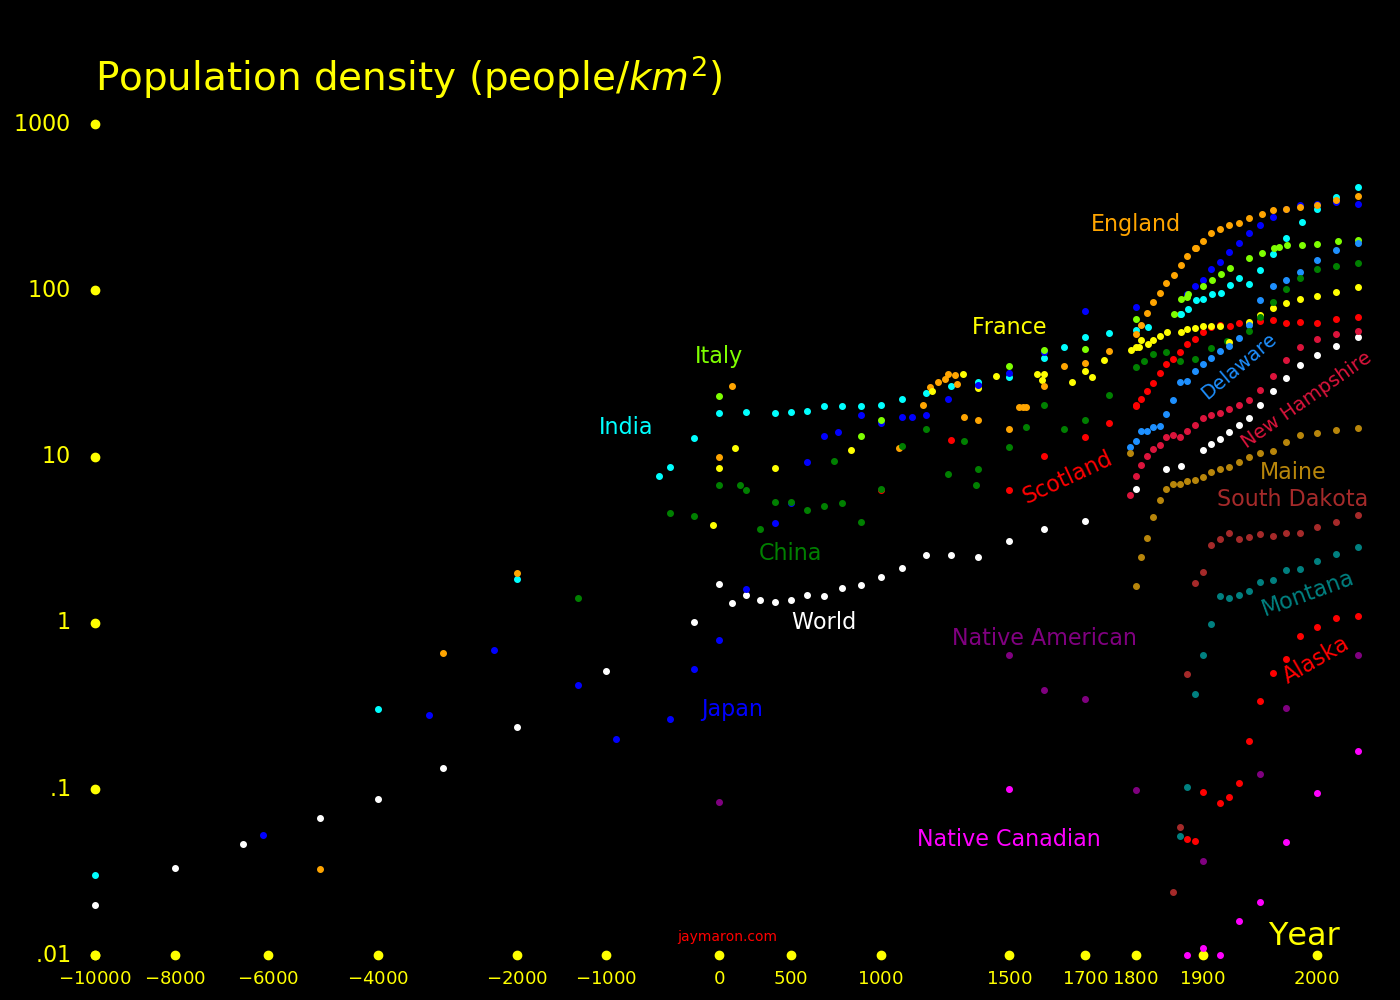
In 1850, a family of 4 could be supported by 40 acres, and this is the origin of the phrase "40 acres and a mule". This corresponds to 25 people/km2. At the time, world population was 8 people/km2 and today it's 50 people/km2.
It takes 120 Watts of food energy to support a human. If the calories come from cane sugar, then land can support 30000 people/km2.
Wild mammal biomass is 30 Bkg and human biomass is 360 Bkg.
Land is cheaper in Brazil than Iowa. In Iowa, land is 1/2 the overall cost and in Brazil it's 1/4.
Iowa pays less for fertilizer than Brazil, but they pay more for seeds.
Labor is only 1/15 the cost, for both Iowa and Brazil.
Costs are in $/acre/year.
               Iowa    Iowa    Iowa   Brazil  Iowa
               cows    corn    soy     soy    grass

Land            56     256    256      60      55
Labor           22.9    42.7   33.6    20      33
Seed             -     114.4   49.2    25       -
Machinery        5.2    70.2   64.5    40      20
Other            5.2    31.9   26.9    16       -

Nitrogen        27.2    71.7    -       -      58
Phosphorus      11.7    29.6   19.5    25      19
Potassium       12.0    18.3   27.9    35       -
Lime             -      15.7   15.7    15       -

Herbicide        4.6    39.6   48.7    40       5
Insecticide      -      18.4    -      10       -
Fungicide        -       -      -      25       -
Other pesticide  -       -      -       4       -

Total          137.9   770.8  542.0   315      181
 |
 |
|---|---|
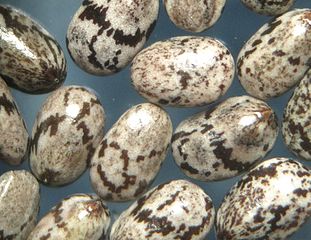
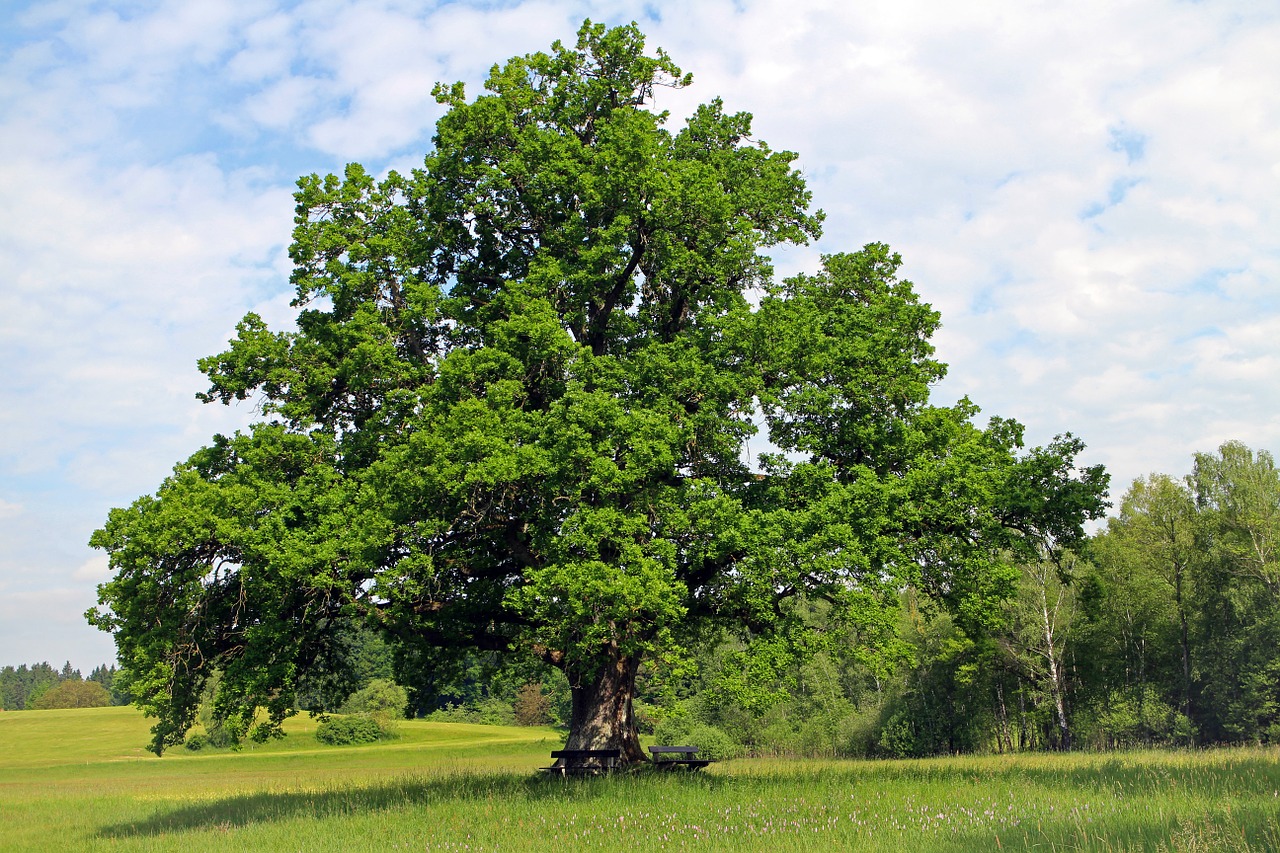
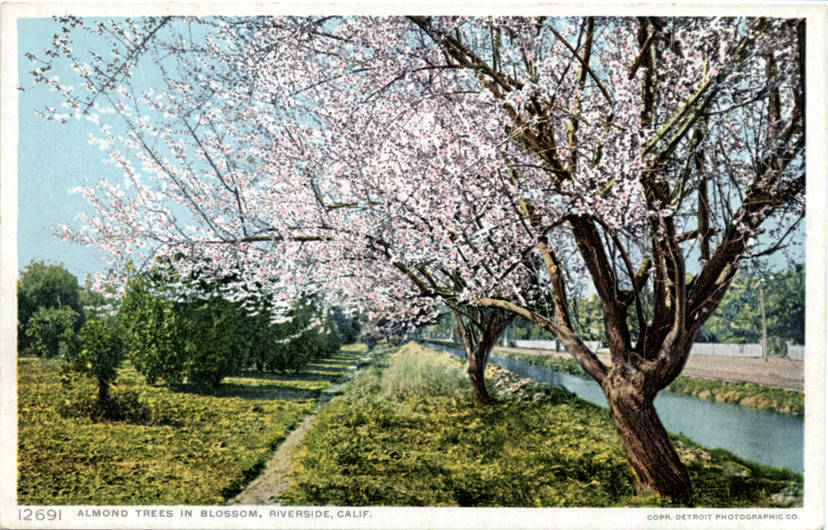
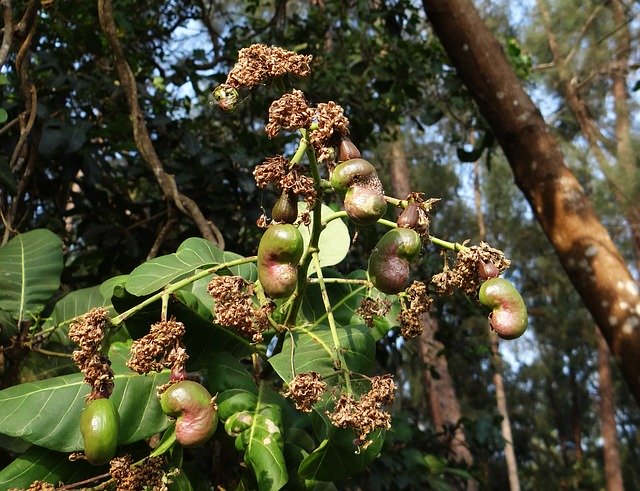
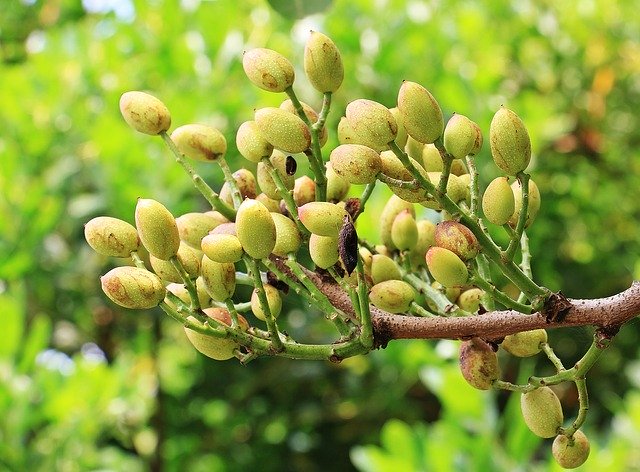
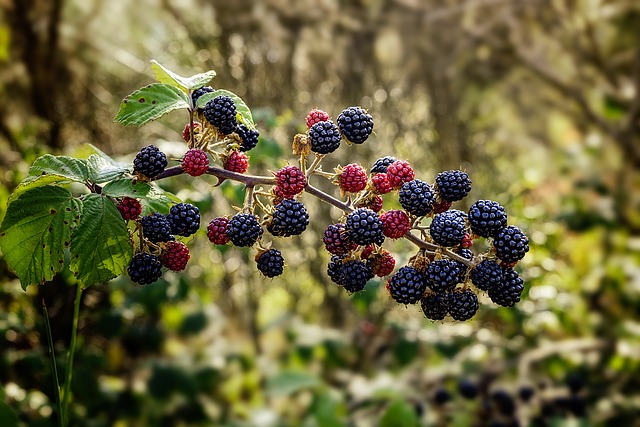
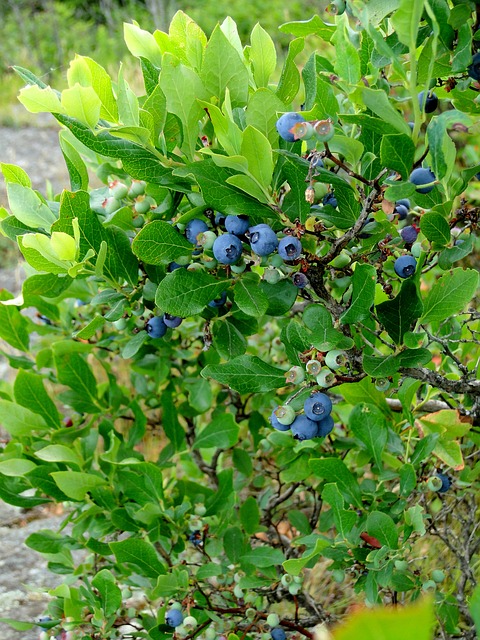
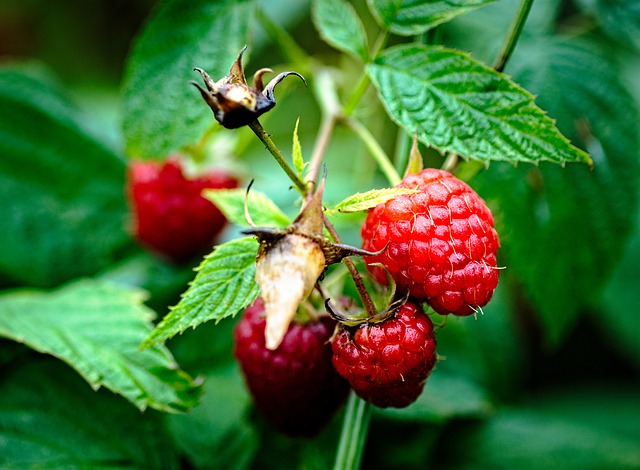
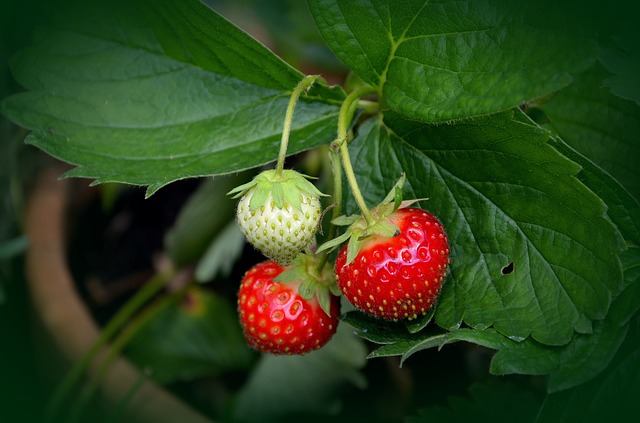
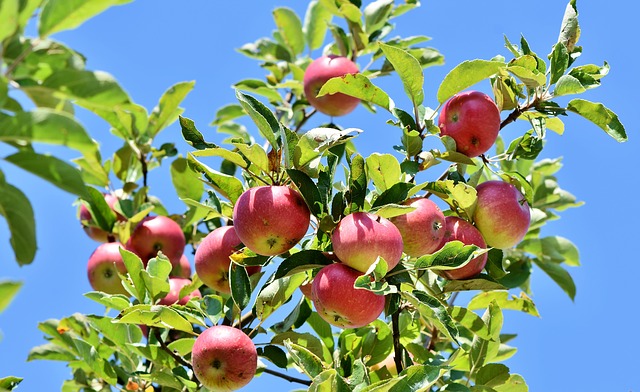
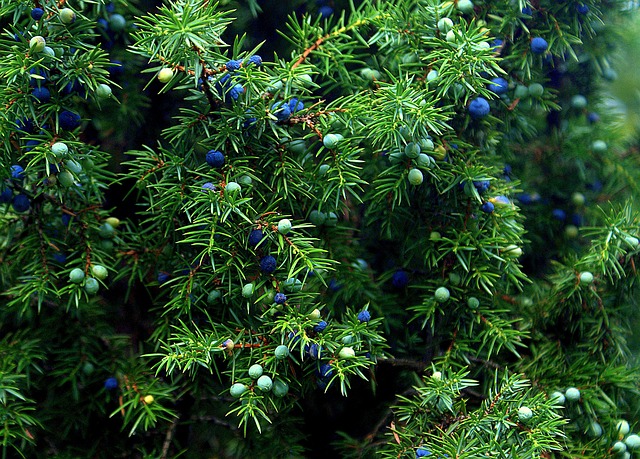
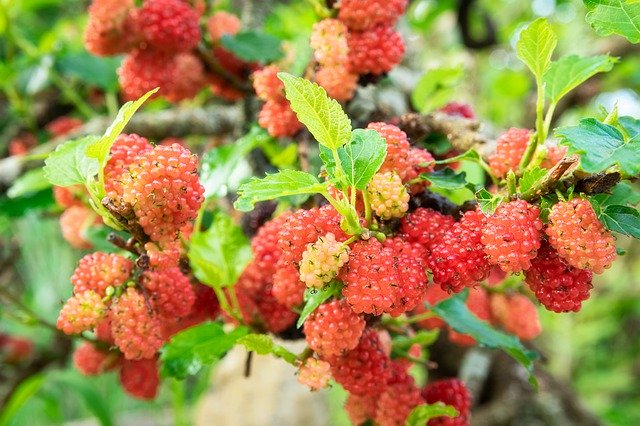
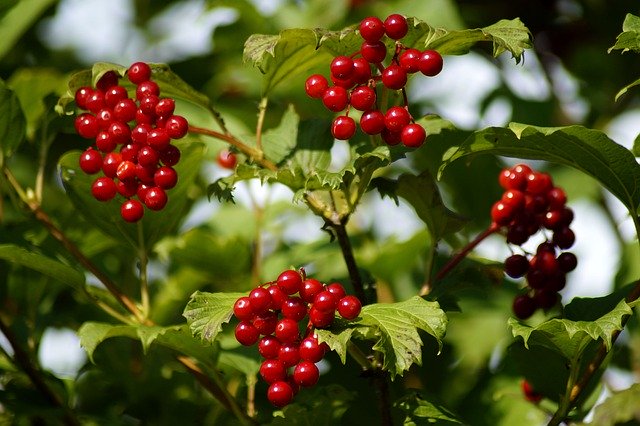
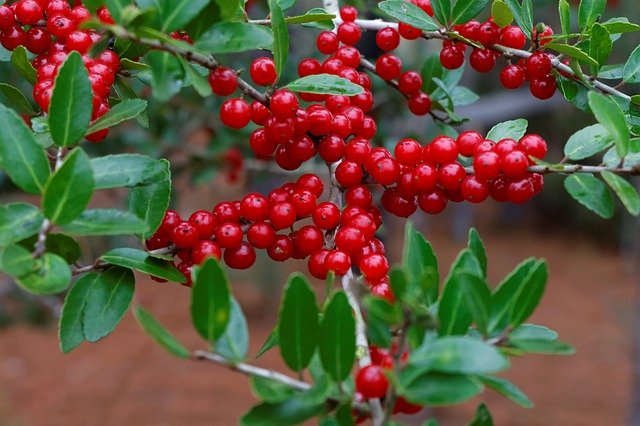
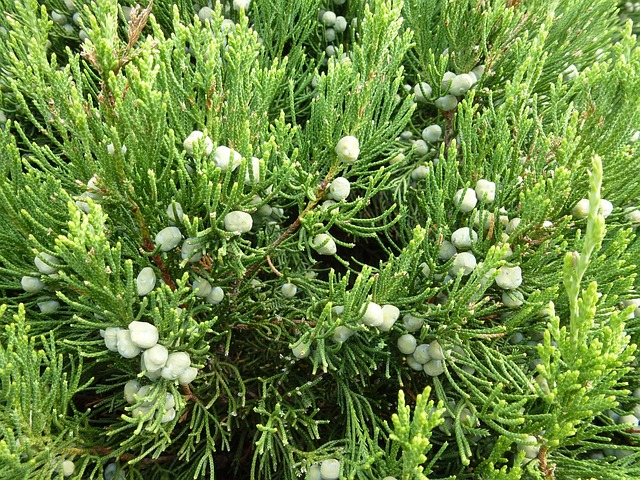
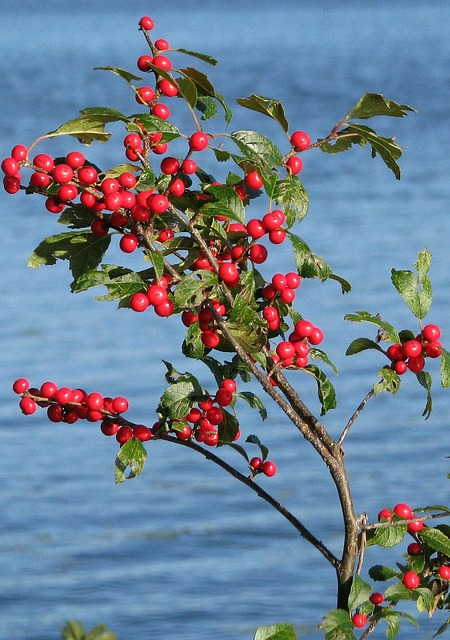
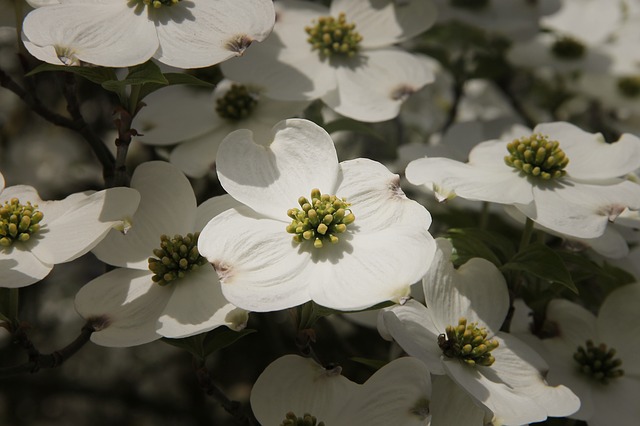
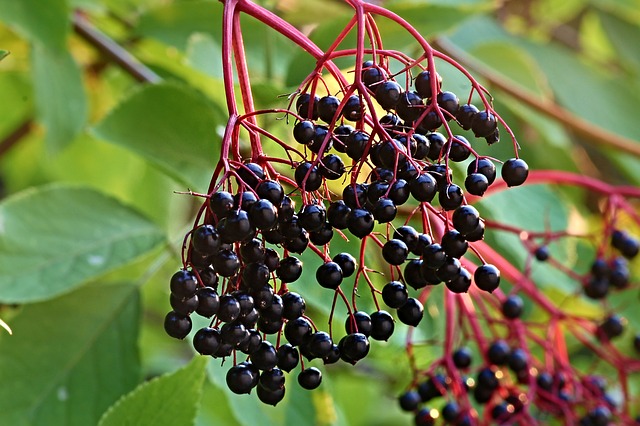
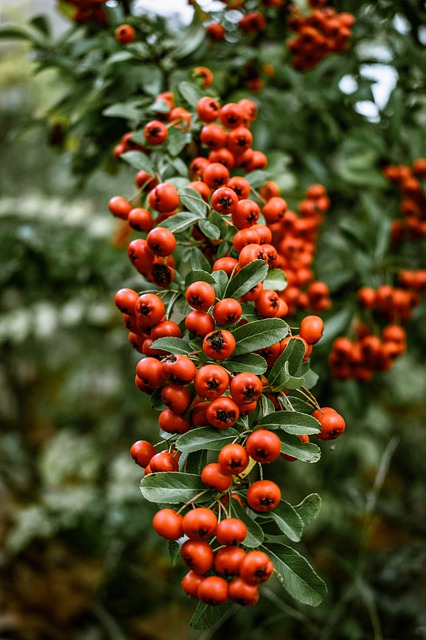
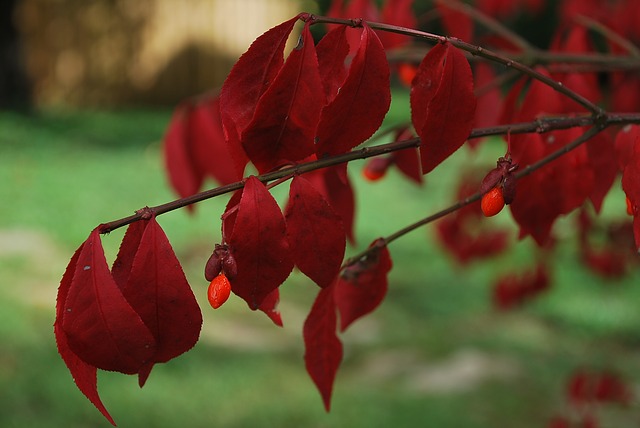
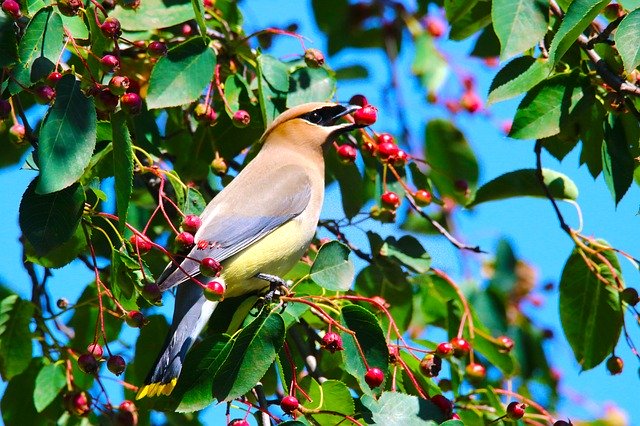
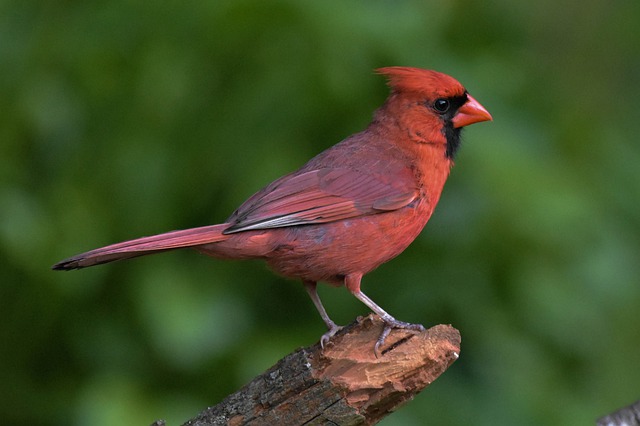
To minimize insects, use plants with nuts instead of berries. Most insects can't get the nuts whereas birds and mammals can.
The nuts with high calcium content are sesame, poppy, and chia. The tree nut with high calcium content is almond.
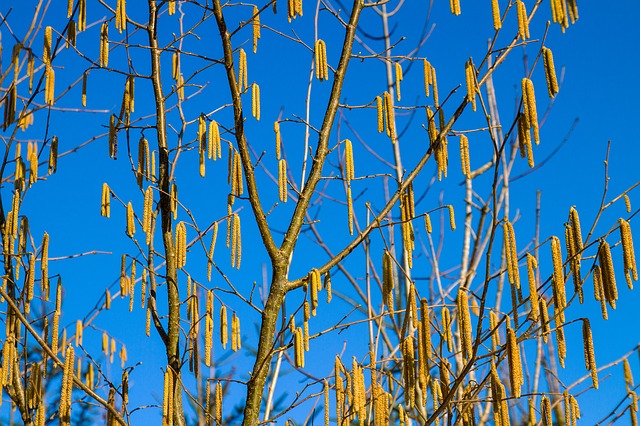
The ideal location for planting trees is near water, and it helps to fertilize the trees.
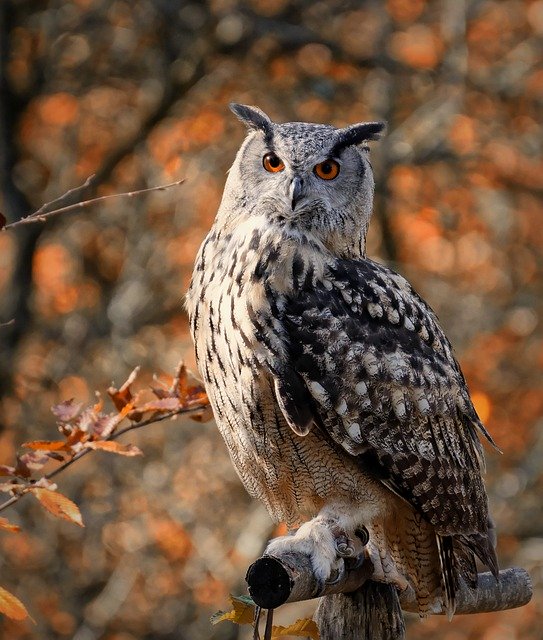
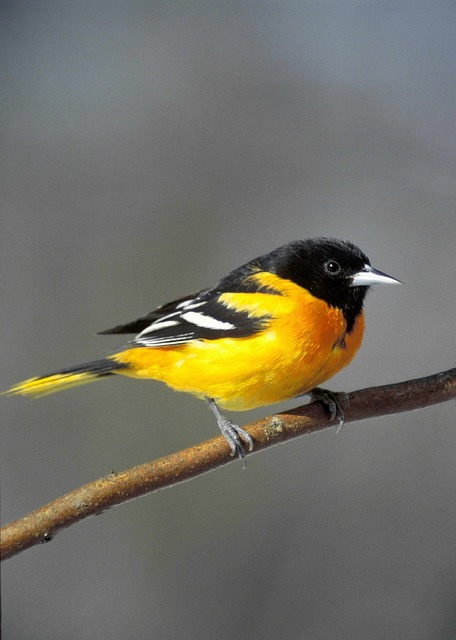
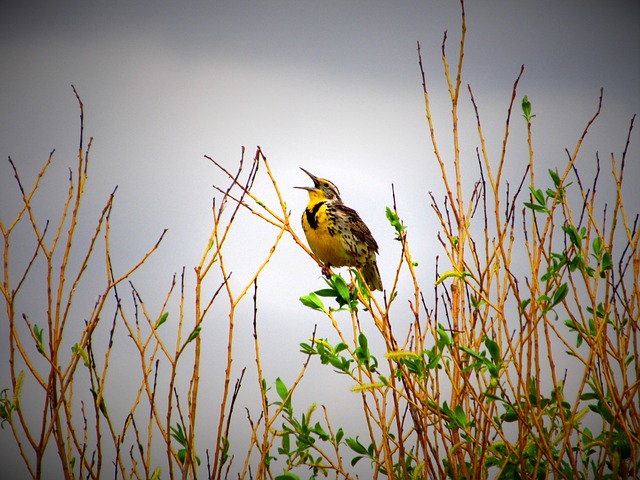
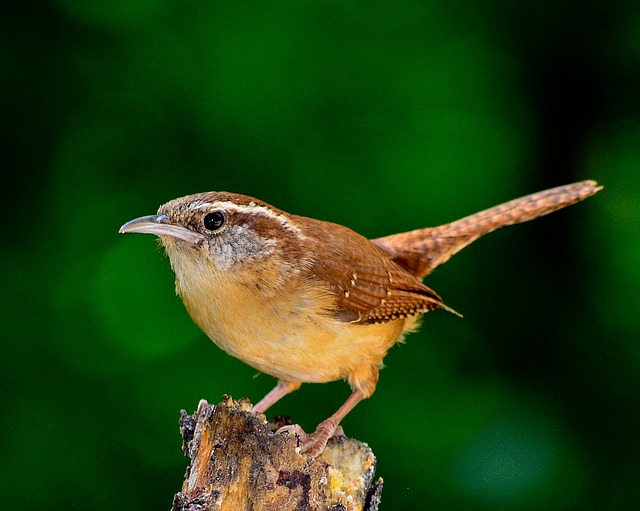
You need dense trees for birds in the winter.
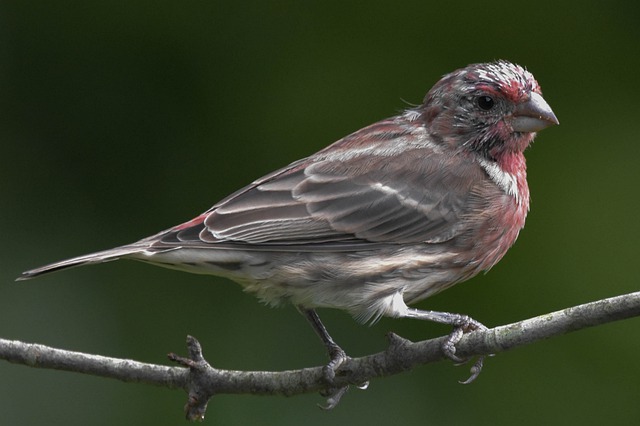
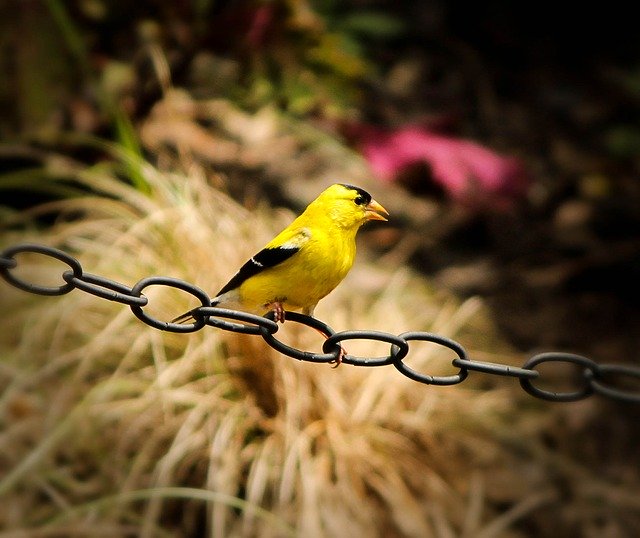
Bird populations can be increased with plants that produce nuts or berries.
 |
 |
 |
 |
|---|---|---|---|
 |
 |
 |
|---|---|---|
 |
 |
 |
 |
|---|---|---|---|
 |
 |
 |
|---|---|---|
 |
 |
 |
 |
 |
|---|---|---|---|---|
 |
 |
 |
 |
 |
|---|---|---|---|---|
 |
 |
 |
 |
 |
|---|---|---|---|---|
 |
 |
 |
 |
|---|---|---|---|
 |
 |
 |
|
|---|---|---|---|
The atmospheric carbon increase of 4000 billion kg/year can be offset by planting 4 million km2 of trees. The fertilizer requirement is 340 billion $/year, and the value of the wood produced is substantially greater.
The amount of forest needed is:
Atmospheric carbon increase     = C        = 4000  billion kg/year
Forest carbon capture rate      = R        =  1.0  carbon kg/meter2/year
Forest needed to offset carbon  = A = C/R  =    4  million km2
The value of wood produced is:
Wood commodity price            = w        =   .3  $/kg
Wood carbon mass fraction       = c        =   .5
Value of wood produced          = W = Cw/c = 2400  billion $/year
The cost for nitrogen fertilizer is:
Wood nitrogen mass fraction     = n        =   .01
Nitrogen requiremnet            = N = Cn/c =    80  billion kg/year
Price of nitrogen in fertilizer = p        =   2.1  $/kg
Total nitrogen price            = P = p N  =   170  billion $/year
Trees also need potassium, phosphorus, calcium, magnesium, and sulfur, and their total cost is similar to that of the nitrogen. The total fertilizer cost is double the nitrogen cost, or 340 billion $/year.
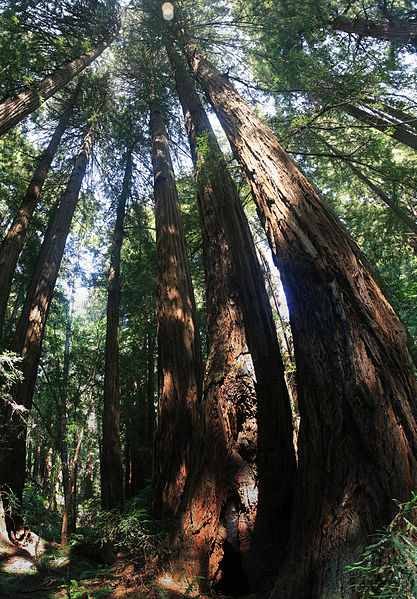
Trees should be planted close to water. For existing trees, fertilizer should go to large trees that are close to water.
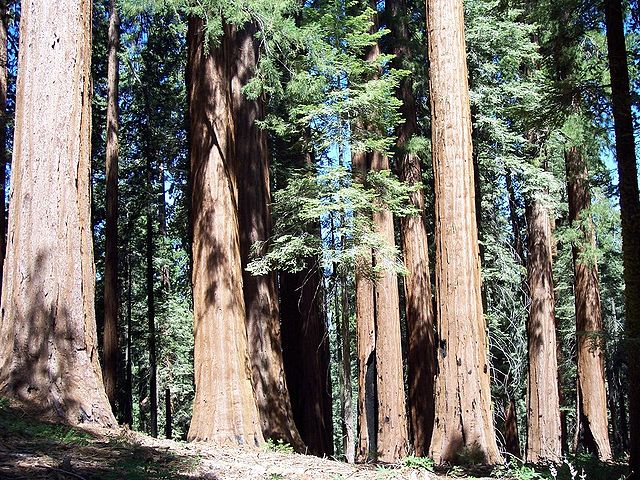
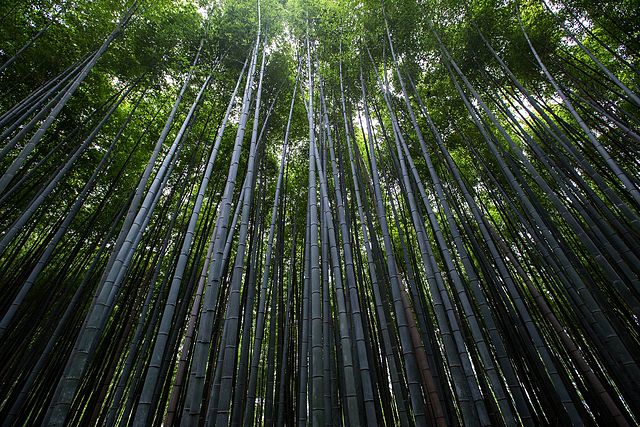
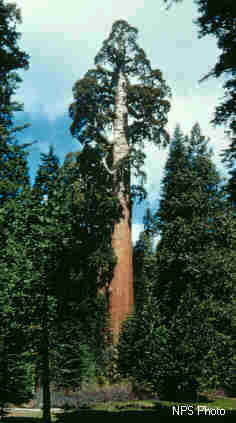
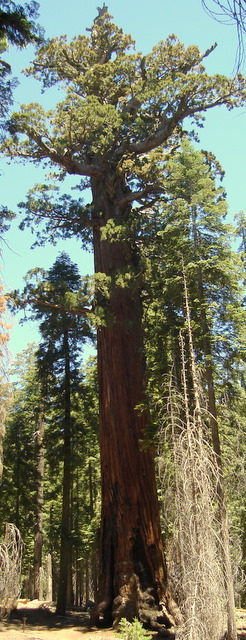
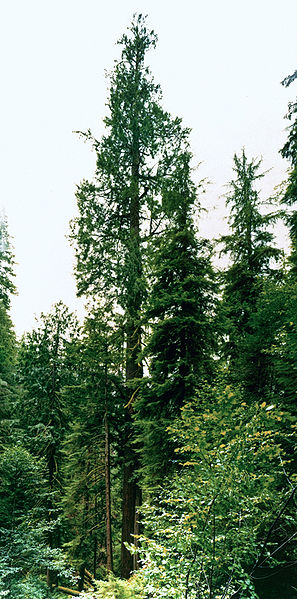
For new trees, chose trees that will become tall and wide. The largest trees are sequoias, redwoods, douglas firs, and eucalyptus. The fastest growing tree is bamboo, which produces 1 carbon kg/meter2/year.
World forest carbon:
Carbon in atmosphere         = 880  trillion kg
Carbon in plants             = 550  trillion kg
Carbon in trees              = 500  trillion kg
Total human-generated carbon = 300  trillion kg
Carbon from deforestation    =  36  trillion kg

Atmosphere carbon increase   =   4  trillion kg/year
Forest carbon capture rate   =  45  trillion kg/year
World forests
Deforestation rate           = .35  trillion kg/year
Carbon from forest fires     = .25  trillion kg/year
World forest area            =  39  million km2
Forest wood density          =  11  kg/meter2

Total wood carbon harvested  =4.56  trillion kg/year     Wood for power + wood for industry
Wood carbon for biomass power=1.59  trillion kg/year
Wood carbon for industry     =2.97  trillion kg/year
|
 |
 |
 |
 |
 |
|---|---|---|---|---|---|
 |
 |
 |
 |
|---|---|---|---|
 |
 |
 |
 |
 |
 |
|---|---|---|---|---|---|
 |
 |
 |
|---|---|---|
 |
 |
 |
 |
 |
|---|---|---|---|---|
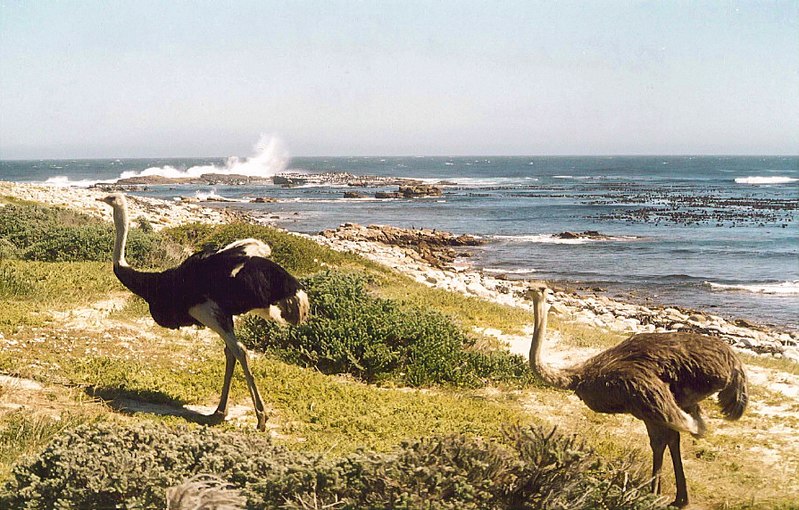
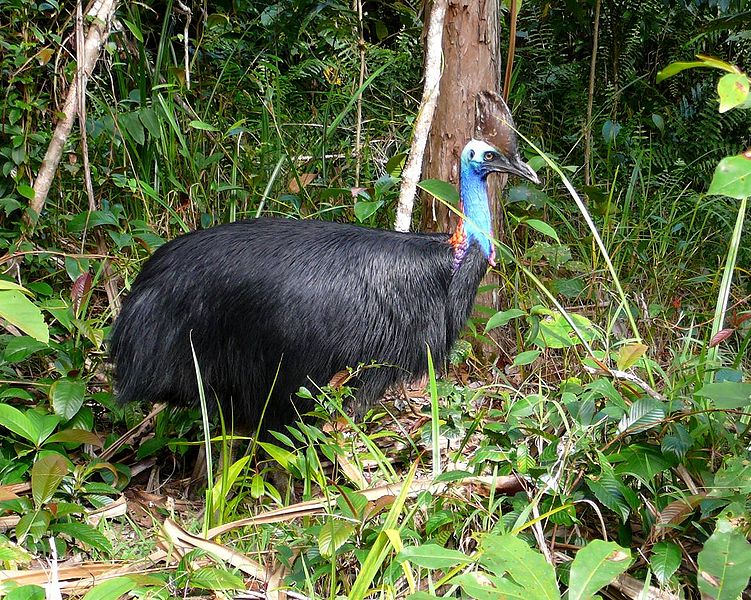
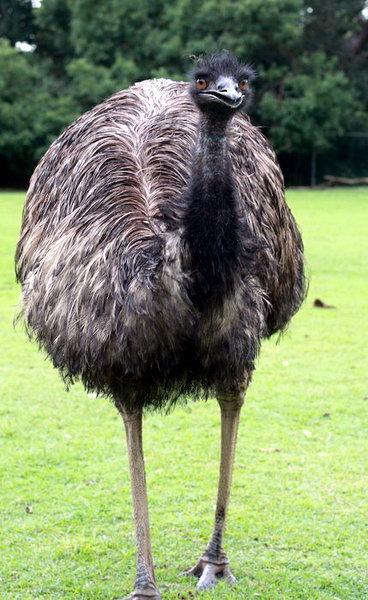
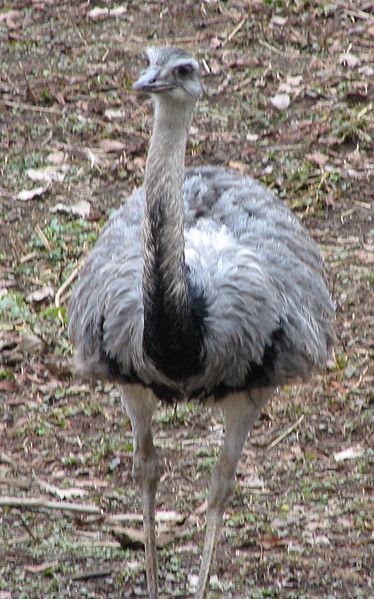
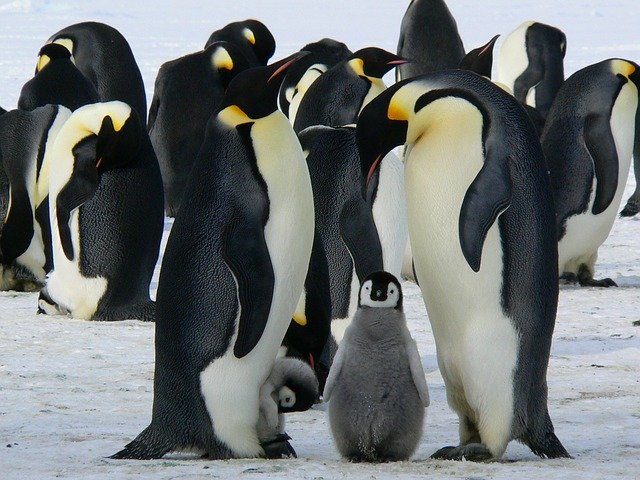
Mass (kg) Flighted
Ostrich 104
Somali ostrich 90
Southern cassowary 45
Northern cassowary 44
Emu 33
Emperor penguin 32
Greater rhea 23
Dwarf cassowary 19.7
Lesser rhea 19.6
King penguin 13.6
Turkey 13.5 *
Mute swan 11.9 *
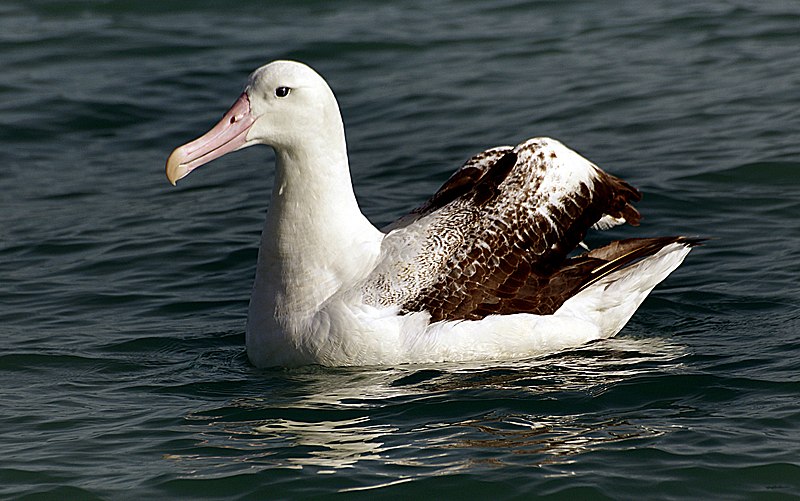
Wandering albatross 11.9 *
Trumpeter swan 11.6 *
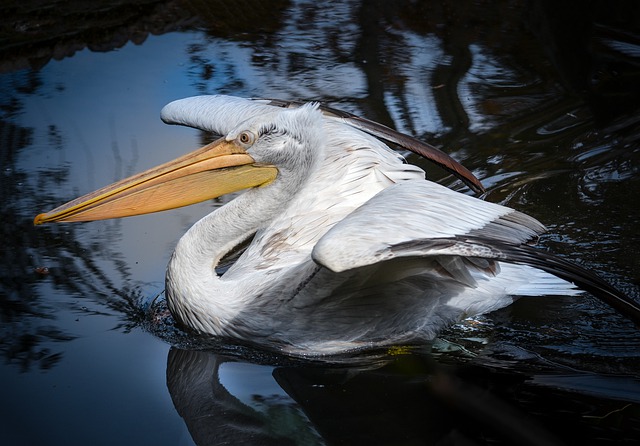
Dalmatian pelican 11.5 *
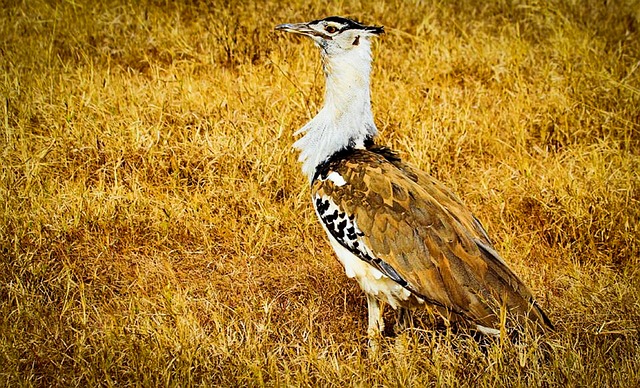
Kori bustard 11.4 *
Whooper swan 11.4 *
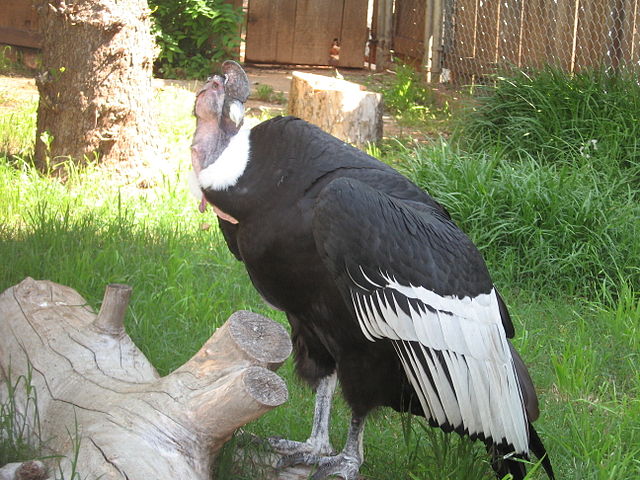
Andean condor 11.3 *
Great bustard 10.6 *
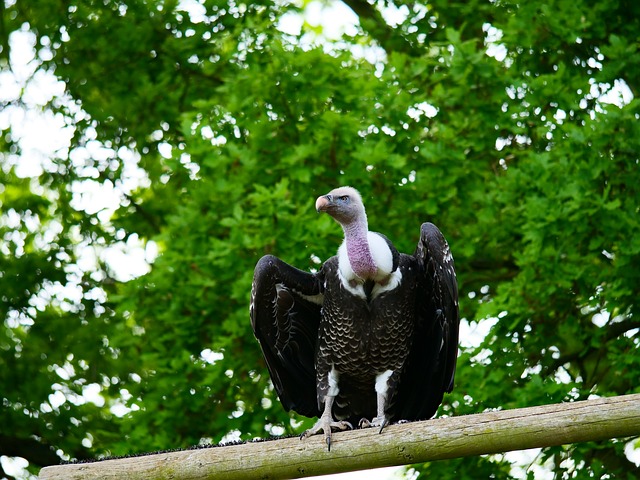
Cinereous vulture 9.5 * Black vulture. Monk vulture
Cape vulture 8.8 *
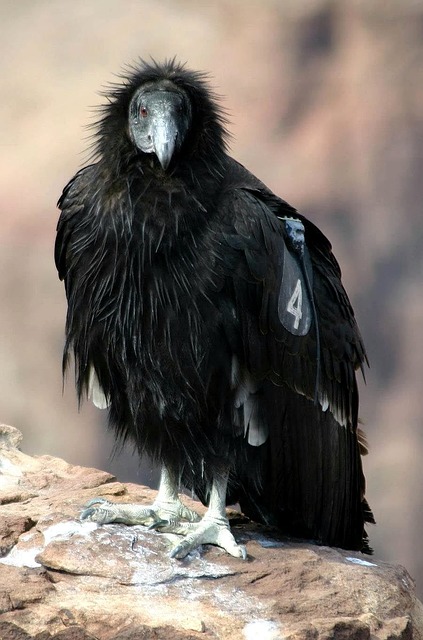
California condor 8.5 *
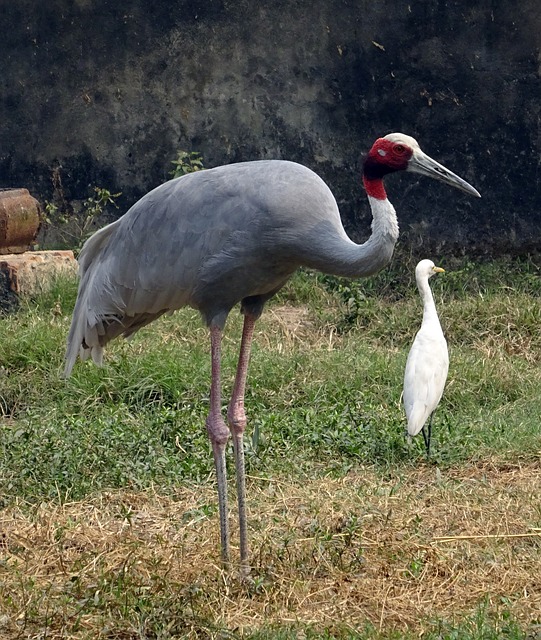
Siberian crane 8 *
Red-billed crane 8 *
Ruppell's vulture 7.6 *
Sarus crane 7 *
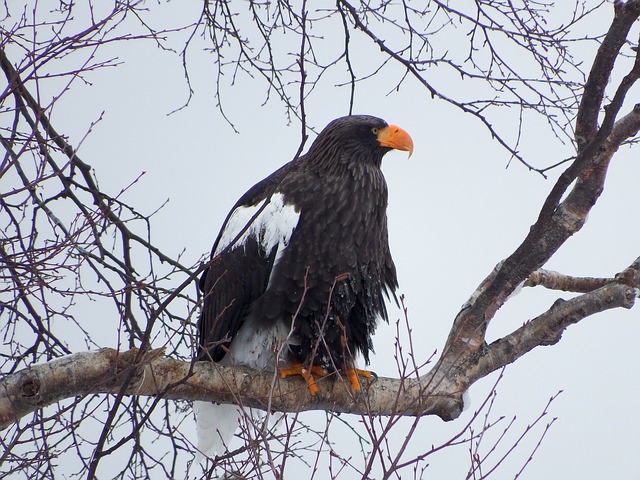
Steller's sea eagle 6.7 *
Black swan 6 *
Bald eagle 4.85 *
Canadian goose 3.8 *
Mallard 1.2 *
Extinct birds:
                Mass (kg)   Flighted

Dromornis stirtoni   500
Elephant bird        400
Brontornis           375
Kelenken             300
Giant moa            240
Titanis waleri       150
Argentavis            72      *
New Zealand penguin   90
Pelagornis sandersi   30      *
Sylviornis            30
Haast's eagle         12      *    1400 CE
Cuban giant owl        9      *
|
|---|
 |
 |
 |
 |
 |
|
|---|---|---|---|---|---|
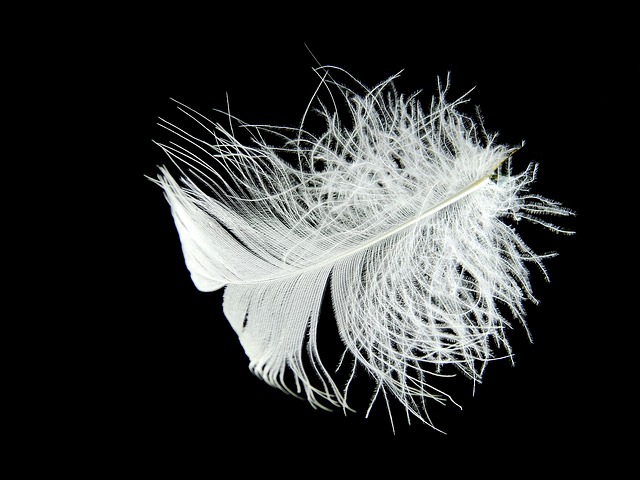
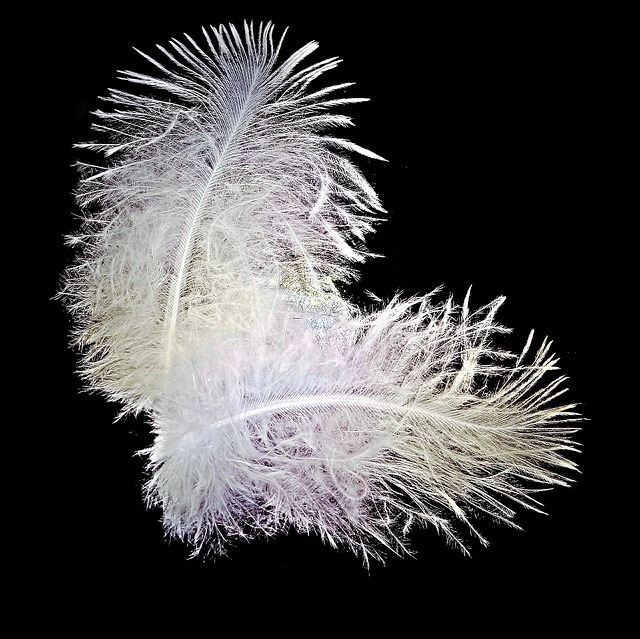
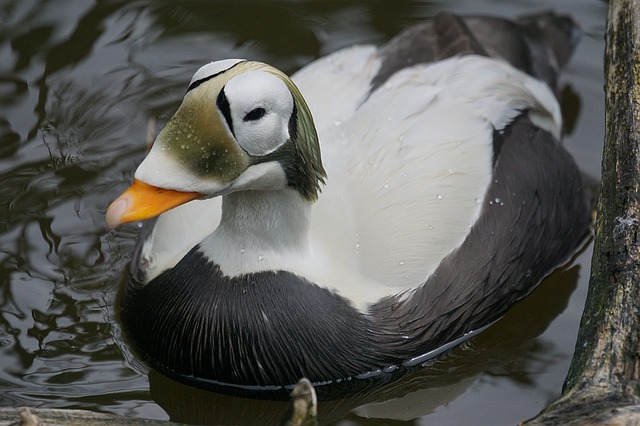
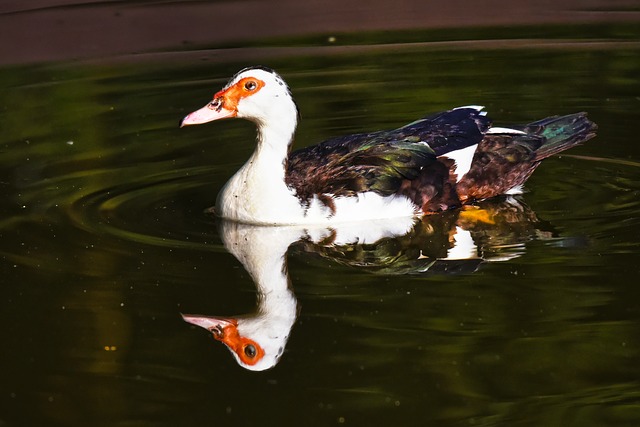
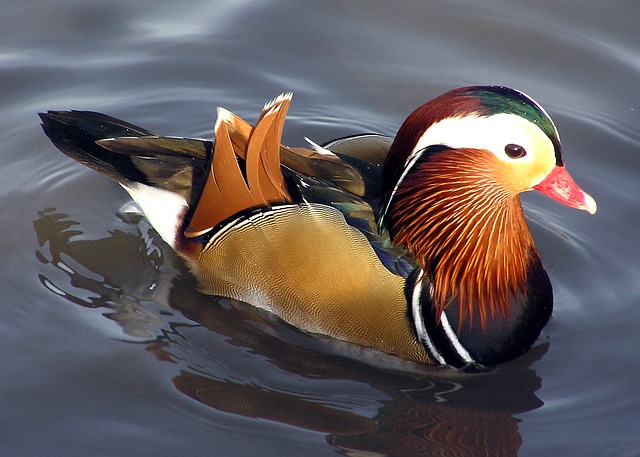
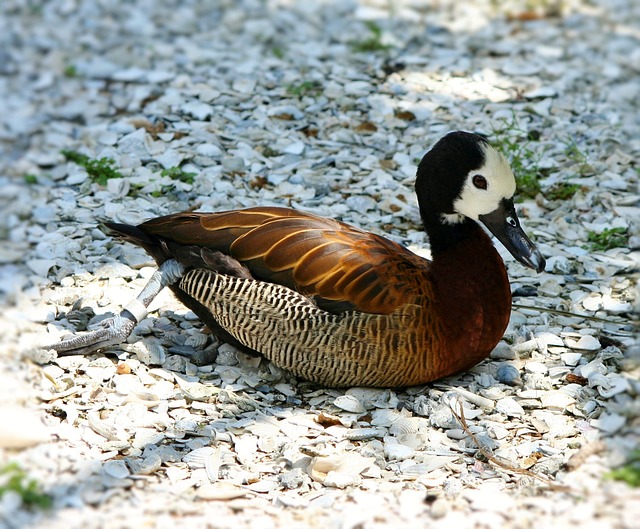
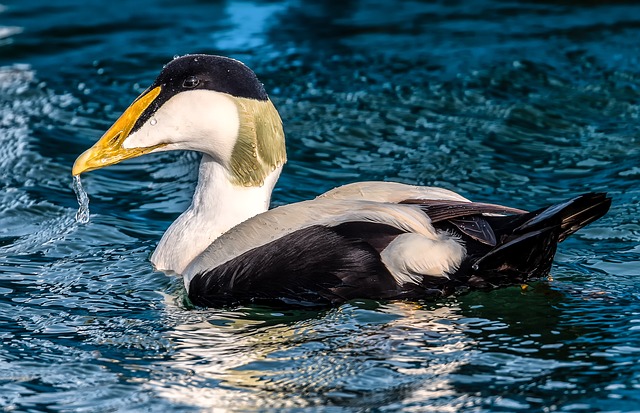
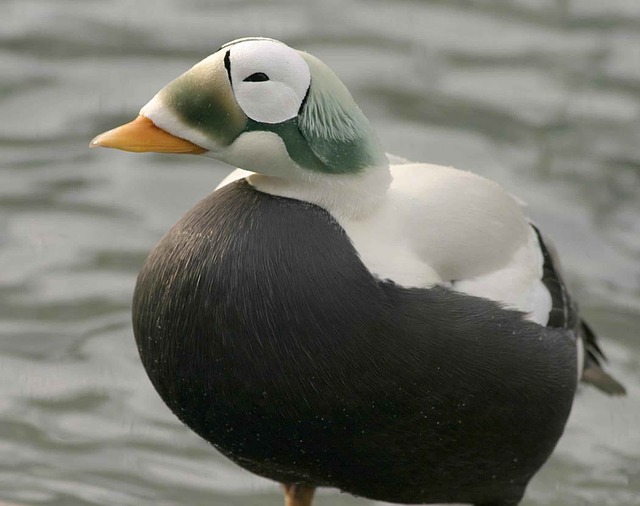
The best down comes from eider ducks and muscovy ducks. Goose down dominates the bulk of the down market.
The quality of down feathers is measured by "fill power", which is inverse density. Bird down far outperforms synthetic fill and it's biodegradable.
                    Fill power (inches3/ounce)

Eider duck down               1200
Goose down, highest quality    900
Goose down, high quality       800
Goose down, average quality    550
Typical synthetic              500
Small feathers                 300
A nest can be harvested halfway through the incubation period, with 1 goose producing 21 grams of high-quality down. It can be harvested again after the young have departed for another 21 grams of lower-quality down.
The best down is eider down, and nest-harvested eider down commands a high price.
Eider down price            =  2200  $/kg
Yield of down from one nest =  .021  kg/duck/year
World eider down production =  4000  kg/year
Iceland production fraction =   .85
Canada production fraction  =   .12
Goose down with a 700 fill power costs 120 $/kg.
Down comes primarily from farmed geese and ducks.
              Produce  Value  Population  Killed  Mass  World mass
              Bkg/yr   B$/yr      B        B/yr    kg      Bkg

Down               .12    6.8     -        -        -        -
Goose, farmed     3.2     4        .2       .84     4.5       .9
Goose, wild       -       -        .02     -        4         .08
Duck, farmed      5.5     7        .9      3.7      1.5      1.4
Duck, wild        -       -        .1      -        1.2       .12
Chicken, farmed  90     128      24       65        2       48
Turkey farmed     5.5     7        .22      .62     7.3      1.6
Swan, wild        -       -        .002    -       11         .022
Most of the down that is produced is live plucked instead of harvested from moult. When buying down-filled goods, take care to check the source of the down.
Population in millions:
Duck total        100
Goose total        20
Swan total          2

Mallard           19        Canadian goose     6         Mute swan     .6
Long-tailed duck   6.5      Snow goose         6         Tundra swan   .3
Northern shoveler  5.8      Cackling goose     1.1       Black swan    .3
Northern pintail   5.4      Greylag goose      1.05      Whooper swan  .18
Gadwall            3.5      Magpie goose       1.0
Eider              3.5      Brant goose         .56
Goldeneye          3.4      Cotton pygmy goose  .4
Eurasian wigeon    3.0      Emperor goose       .085
Tufted duck        2.8      Swan goose          .08
Garganey           2.7
Pochard            2.4
 |
 |
 |
 |
 |
 |
 |
 |
|---|---|---|---|---|---|---|---|
Energy/$ Power/$ Energy/Mass Power/Mass
MJoule/$ Watt/$ MJoule/kg Watt/kg
Battery, lithium-ion .008 7 .6 400
Battery, lead-acid .045 58 180
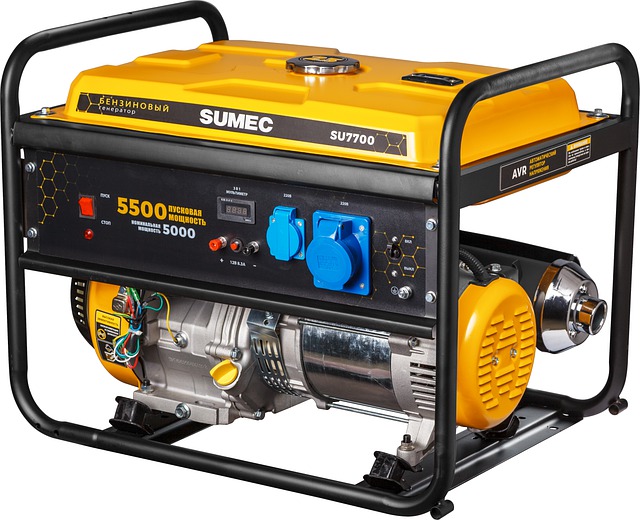
Generator, gasoline - 10 100 Converts gasoline to heat to electricity
Generator, Stirling - 10 30 Converts any hydrocarbon to heat to electricity
Solar cell - .6 20
Wind turbine - 1 10
Water turbine - 1 30
Generator, hand crank - .4 40
Generator, bike chain .8 15 Extracts energy from a bike chain
Generator, bike wheel .15 15 Extracts energy from a bike wheel
Gasoline generators have good power/mass but they're not sold in small sizes. The smallest gasoline generator have a power of 1000 Watts and a mass of 10 kg.
The energy used by electronic devices is:
             Volts   Watts

Phone           5       .5       Assume the phone is on and playing a video
Tablet         12      3
Small laptop   12     10
Large laptop   19     20
                     Energy/Mass  Energy/$    Mass/$
                      MJoule/kg   MJoule/$     kg/$

Coal                        32     320        10
Natural gas                 55     250         4.5
Firewood                    22     220        20
Gasoline                    47      47         1.0
Propane                     50      38          .75
Butane                      50      38          .75      Lighter fluid
Coal, matchlight            32      13          .4
Wax                         45      11.2        .25
Coal, hookah                32       3.8        .12
Gel fuel                    22       2.2        .10      Methanol, ethanol, diethylene glycol
Solid fuel                  30        .9        .031     Hexamine, trioxane
Heat pack, iron powder      10        .89       .089
Lithium-ion battery           .6      .008      .013
You can cook outdoors with coal, and you can cook indoors with hookah coal. Hookah coal produces minimal smoke.
 |
|
|---|---|
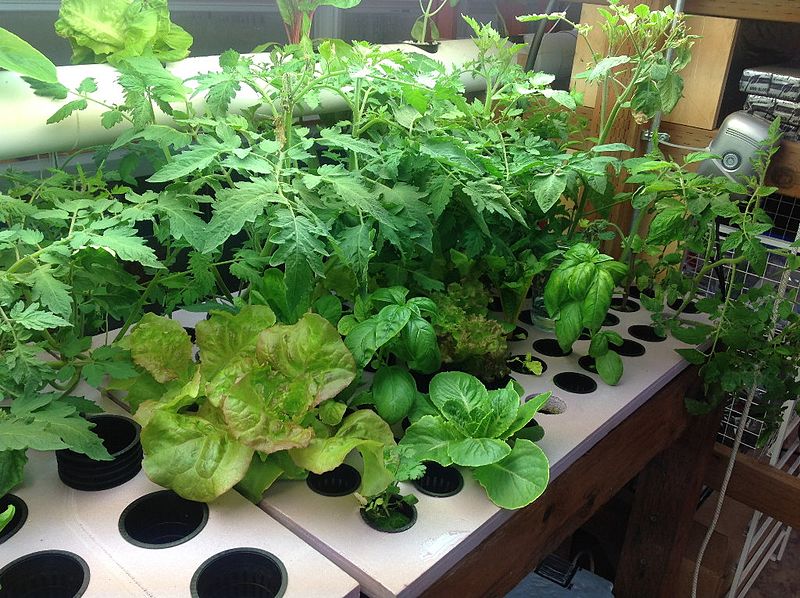
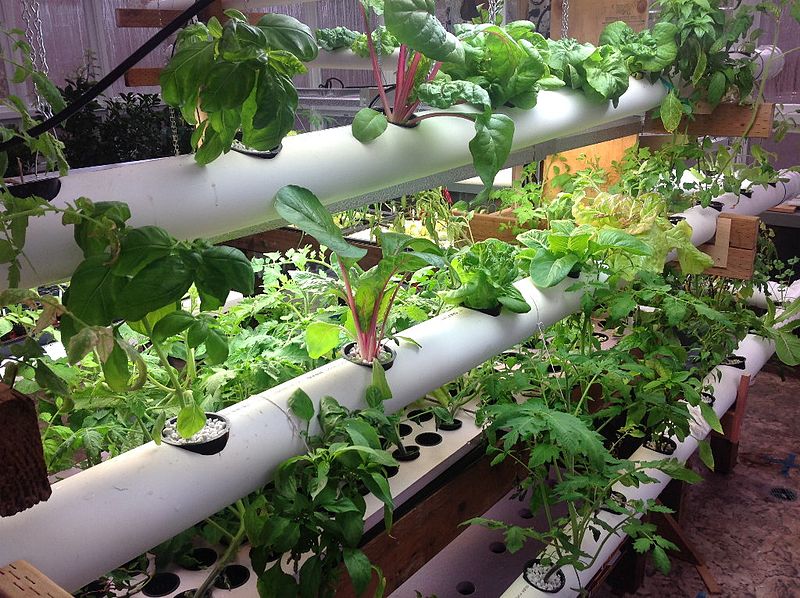
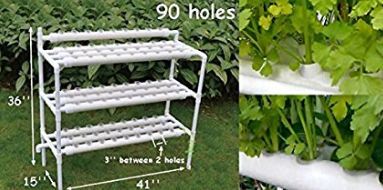
Hydroponics is the technique of growing plants in water rather than soil, where the water is fertilized with nutrients. Hydroponics can yield 100 times as much food as soil-based agriculture, and a person can be sustained with only 200 square meters of hydroponics.
Hydroponics is easy. One can buy a system that takes care of everything and one need only supply the system with water and fertilizer. One can further improve yield with greenhouses, lighting, and mirrors.
 |
 |
 |
|---|---|---|
 |
 |
 |
|---|---|---|
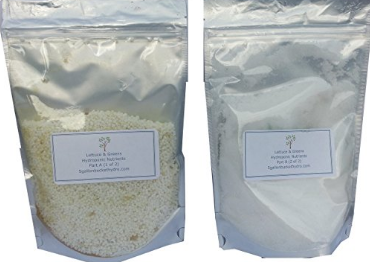
A "grow kit" takes care of supplying the plants with water. One need only supply the kit with water and fertilizer. Fertilizer comes in powder form and dissolves in the water. Kits cost $2 per plant site.
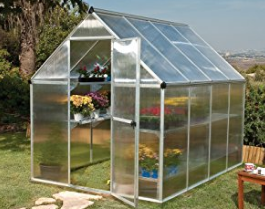
Putting a greenhouse around the kit amplifies the yield by allowing one to control temperature and humidity. A greenhouse also allows plants to be grown during the winter.
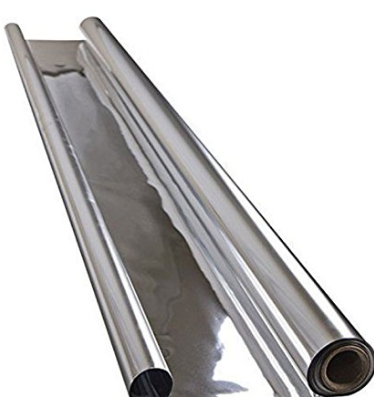
Mirrors can amplify the sunlight reaching the planet, and mirror film is cheap.
Lights can improve the growth rate and make it possible to grow plants 24 hours.
1 kg of nutrient powder is mixed with ton of water. The composition of a typical nutrient solution is
        Parts per million

Potassium       160
Nitrogen        150
Calcium         100
Phosphorus       40
Sulfur           40
Magnesium        30
Iron              2
Manganese          .5
Zinc               .3
Boron              .2
Copper             .1
Molybdenum         .075
Source
Hydroponics offers gains over field agriculture in many categories. The following table shows the amplification for each category in terms of hydroponic yield over field yield. The total amplification is the product of the amplification from each category.
                  Amplification factor

Plant density               8          In terms of plants/meter2
Crops per year              4
Crop variety                2
Temperature contro l        2
LED lighting                2
Carbon dioxide enhancement  1.5
 |
 |
 |
 |
|---|---|---|---|
Cities often encourage wild cats to stay wild, and many have a "catch, sterilize, and release" program. Many also do censuses of cat colonies and have a network of colony caretakers.
The plague has closed down most of New York City's animal shelters.
New York City has the same number of wild cats as house cats.
Pet dogs in homes  300000
Pet cats in homes  600000
Wild cats          400000
Given to shelters   20000 per year
Adoptions           14000 per year
Euthanized           4000 per year
NYC area              784 km2
NYC humans        8300000
Wild cats/area          5 cats/hectare
Wild cats kill on average .12 rats/day. The calorie intake is:
Cat mass             = 4.5   kg
Rat mass             =  .265 kg
Cat food requirement = 218   Calories/day
Rat kills/day        =   .12 Rats/day
Calories in a rat    = 800   Calories
Calories from rats   =  96   Calories/day
                        Average     Oldest   Average  Most massive  Most massive   Female reproductive
                        lifespan    member    mass       member        gender           maturity
                         years      years      kg          kg                            years

  Pine, bristlecone                  4854
  Cypress, Mediterranean             4500
  Yew                                4500
  Cypress, fitzroya                  3652
  Sequoia                            3200
  Baobab, African                    2450
  Suji, giant                        2400

  Tortoise, aldabra giant     100     255
  Tortoise, Galapagos giant   100     177      294         417         Male

  Whale, bowhead              100     211
  Whale, killer                        80
  Whale, sperm                 65                                                         9
  Manatee

  Human                        75     122
  Elephant, African                    70
  Elephant, Asian                      89
  Horse                                62
  Orangutan                            55
  Bear, Eurasian brown                 50
  Bear, polar                          42
  Panda                        28
  Cat                                  38
  Dog                                  31
  Rabbit                               18

  Macaw                        70
  Cockatoo, sulfur-crested            120
  Flamingo, greater                    83
  Cockatoo                             83
  Condor, Andean                       79
  Albatros, leysan                     66
  Vulture, Egyptian                    60
  Eagle, American              25      50
  Pigeon                        4      15
  Mourning dove                 3
  Sparrow                       3
  Robin                         2      13
World population hinges on agricultural technology.
|
|---|
Year
  -11000   Pigs and sheep domesticated               Fertile crescent
   -9500   First crops                               Fertile crescent
   -8500   Cattle domesticated                       India and Turkey
   -6200   Rice cultivation                          China
   -4500   Wheel
   -4000   Beadmaking discovered, using yeast        Egypt
   -3500   First crops in the Americas
   -3000   Wine, beer, cheese
   -1900   House-drawn chariots                      Central Asia
   -1700   Wind-powered machines                     Babylon
   -1500   Seed drill                                Babylon
     600   Alcohol distillation
     900   3-field system. One field is fallow
    1492    Columbia exchange. Corn and potatoes introduced to Europe
            Guano fertilizer introduced
    1701    Seed drill of Jethro Tull
    1720    4-field system. Wheat, clover (nitrogen fixation), turnips (deep roots), barley
    1780    Breeding of livestock                     England
    1784    Threshing machine, for separating seeds from hulls
    1807    Potassium discovered. Proved to be a component of wood ash. Humphrey Davy
    1809    Canned food
    1842    Phosphate fertilizer
    1866    Mendel publishes "Mendelian genetics"
    1871    Pasteurization                            Louis Pasteur
    1895    Refrigeration
    1901    Gasoline tractor                          America
    1913    Haber process for producing ammonia
 |
 |
|---|---|
To support a 1 kg bird you need 5.3 meters2 of algae.
Algae growth rate        =  G            =   4  kg/meter2/year
Algae food energy/mass   =  e            =  12  MJoules/kg
Bird calorie requirement =  E            = 253  MJoules/year   =  165 Calories/day          For a 1 kg bird
Area per bird            =  A  =  E/(Ge) = 5.3  meters2
 |
 |
|---|---|
 |
 |
 |
 |
 |
|---|---|---|---|---|
 |
 |
 |
|---|---|---|
 |
 |
 |
 |
 |
 |
|---|---|---|---|---|---|
 |
 |
 |
 |
 |
|---|---|---|---|---|
 |
 |
 |
 |
 |
|---|---|---|---|---|
 |
 |
 |
 |
 |
|---|---|---|---|---|
 |
 |
|---|---|
 |
 |
 |
 |
 |
 |
|---|---|---|---|---|---|
 |
 |
 |
 |
|---|---|---|---|
 |
 |
 |
 |
 |
|---|---|---|---|---|
 |
|---|
 |
 |
 |
 |
 |
|---|---|---|---|---|
 |
 |
 |
 |
 |
|---|---|---|---|---|
 |
 |
 |
 |
|
|---|---|---|---|---|
 |
 |
 |
 |
 |
|---|---|---|---|---|
 |
 |
 |
 |
 |
|---|---|---|---|---|
 |
 |
 |
 |
 |
 |
|---|---|---|---|---|---|
 |
 |
 |
|---|---|---|
 |
 |
 |
 |
|---|---|---|---|
 |
 |
 |
 |
 |
|---|---|---|---|---|
 |
 |
|---|---|
 |
 |
 |
 |
|---|---|---|---|
 |
 |
 |
 |
 |
|---|---|---|---|---|
 |
 |
 |
 |
 |
|---|---|---|---|---|
 |
 |
 |
 |
|---|---|---|---|
 |
 |
 |
|---|---|---|
 |
 |
 |
|---|---|---|
|
|
|
|
|---|---|---|---|
|
|
|
|
|
 |
|---|---|---|---|---|---|
|
|
|
|
|---|---|---|---|
|
|
|
|
|
|---|---|---|---|---|
 |
 |
|---|---|
Animals Moves/Animal dt Longitude Latitude Duration
Days Days
Peregrine Falcon Hungary Soar 10 4000 .000095 21.0 46.7 .38
Soaring bird Gibraltar Africa 73 378 .000382 -5.6 36.0 .14
Black kite Gibraltar Marques 130 594 .00141 -5.6 36.1 .83 2019
Raptor Moessingen Nabu 1 1133543 .00150 -3.5 41.2 1705
Northern gannet Alderney 60 6057 .0023 -1.8 49.8 14
Little bustard Portugal Spain 17 10708 .00269 -.1 .3 39
Black kites Gibraltar 129 599 .0027 -5.6 36.1 1.6
Scopoli shearwater 22 1046 .0034 7.3 42.8 3.6
Scopoli shearwater free ranging 27 2021 .00372 2.8 40.6 7.5
Western marsh harrier Belgium 3 15967 .0044 4.3 51.3 57 Antwerp
Common crane Lithuana 2016 1 360007 .00475 18.2 52.8 1711
Scopoli shearwater Pollonara 28 827 .00510 6.9 42.9 4.2 2015
Adlie penguin Adlie land 52 1658 .0052 140.0 -66.6 8.6 **
Lesser kestrels EBD 141 5702 .0056 -6.5 37.4 32
Heron egret telemetry 16 83373 .0066 -121.9 37.7 343
GreyHeadedAlbatross NewZealand 24 3895 .0072 -10.6 -55.8 28 Torres 2017
Western marsh harrier Groningen 4 246779 .00825 3.6 46.6 779
Common crane Lithuana 2015-2016 2 49556 .0092 15.5 51.3 579
Snares penguin incubation 2003 3 424 .0093 167.7 -48.1 3.95
Red kite Baden Wuerttemberg 1 37896 .0108 5.4 46.6 409 * download crash
Masked boobies ocean desert 23 229 .0113 -109.5 -27.2 2.57
Eagle owl Reinhard Vohwinkel 21 24701 .0114 8.7 51.3 80
Bewick swans 9 11190 .0119 26.0 58.5 133
Eurasian oystercatcher Belgium 7 9647 .0131 3.8 51.2 112
Hypsignathus monstrosus Olson 10 943 .0139 15.6 .9 35
Common crane Sweden gps 19 31777 .0171 11.5 54.2 420
Hornbill NE India 6 3212 .0179 57.6 92.9 58
Yelkouan shearwater ChickRearing 51 157 .0217 13.4 35.0 3.41 2012 2014
Brown pelican Gulf Mex Gea 30 1818 .0240 -91.0 29.1
Egrets herons 3 32595 .0248 -80.5 36.0 **
Whooper swan Latvia 4 11931 .0315 22.0 56.8 376
Trumpeter hornbill KWA ZuluNata 35 695 .0339 30.3 -30.7 24
Northern harrier Ornitela 5 7112 .045 -121.7 38.8 316
Von der Deckens hornbill Kenya 17 11260 .0482 36.4 .4 542 Jetz
Indian yellow nosed albatros 26 2460 .0523 79.4 -38.1 129 Amsterdam Is Boulinier
Great egrets lifetrack 10 22599 .067 -78.6 37.4 392
Raptor tracking NYSDEC 7 13560 .095 -74.5 45.2 1288
Cougar coyote Utah Idaho 8 10422 .095 -122.6 43.4
Black-bellied plover Alaska 1 500 .118 -142.5 68.8 59
Baltic dublin Pakanen 25 2352 .169 30.8 15.4 397
Osprey S.E. Michigan 9 12466 .199 -83.0 34.9 4471
Antarctic petrel Antarctica 2016 75 64 .216 4.2 -71.1 14 SvarthamarenTarrooux
Pelican landscaps func eco 16 6977 .237 33.1 23.1
Hurricane frigate MPIAB 8 2342 .249 -88.5 21.2 583
Buzzards, eagles 23 15606 .26 34.4 30.2 4058
Short eared owl N America 26 703 .27 -148.0 60.8
Loggerhead Canary Is Juvenile 5 1219 .298 -18.9 23.3 364
Brown pelican lamb 2017 81 2093 .30 -90.3 28.1
Black skimmer Andean Davenport 8 217 .335 -71.9 -19.2 73 2016
Wild Turkey Margadant 37 698 .34 -86.4 33.2 237
Black tailed godwit Senner 2015 30 580 .352 -.6 46.5 204
LongBilledCurlew MtWest 63 3064 .40 -112.6 34.3 976
Grey plovers Wadden Sea 13 751 .44 31.5 58.1 330
Grasshopper sparrow Vermont 24 581 .50 -80.2 33.1 290
Connecticut Warbler Alberta 5 690 .50 -70.8 13.0 344
Great knot EAAF 8 282 .504 129.1 43.2 142
Winchat British Saxicol Rubetra 20 653 .504 .7 26.0 329 **?
Wood warbler Tottrup 2018 1 404 .52 14.8
BlackpollWarbler deluca 2015 5 575 .53 -71.2 24.6
Argentine barn swallow 9 505 .539 -53.8 -11.8 272 **
Great cormorant Lake Constance 17 616 .558 8.0 46.3 201
Mediterranean storm petrel Malta 7 370 .65 11.7 37.5 239
Solowki Larus 6 392 .677 32.4 62.5 265
Snowy owl N America 32 1047 .78 -70.8 65.3
African cuckoo Nigeria Iwajomo 5 1070 .820 10.2 9.2 877 2018
Canadian plover Bylot 19 412 .86 -17.3 26.7
Gadwall MPIAB 40 106 .989 12.1 48.3 105
Painted bunting ABM 2015 11 198 .99 -99.6 27.2 196
Pernis apivorus Byholm Finland 9 847 .995 17.5 32.3 842
Fork tailed flycatcher 28 329 1.01 -61.8 -10.4 333 Tyrannus Savana **
Sparrowhawk Armenia Levant 5 266 1.03 36.2 16.2 272
Broad winged hawk 20 370 1.29
Red faced cormorant SGS ASC 2 83 1.37 173.2 52.8 113
Hawk Marc Bechard 3 126 1.39 -73.3 -20.7 175
Great egret MPIAB 1 917 1.93 21.7 50.9 1767
Red necked stints EAAF 17 76 2.47 122.4 14.0 158
Swainsons hawks 42 107 2.31
Curlew sandpiper EAAF 13 74 2.85 120.2 17.3 211 **
Trumpeter hornbill MPIAB 2 188 3.26 30.3 -30.7 614
Osprey N.S. America Martell 78 577 3.55 -84.5 29.6 2048
Snowy Owl Therrien 8 110 6.0 -73.0 65.2
American bittern Huschle 10 195 7.5 -92.5 40.9
Meadowlark Vermont 10 21 12.8 -85.1 40.5
Oenanthe turdidae Uppsala 12 25 12.4 5.0 37.1 307 *
Spotted eagle Lithuania 2017 4 149570 .0078 10.2 34.3 883
Spotted eagle NE Poland 3 1451 .0229 24.1 52.6 33
White tailed eagle Poland 2 6965 .048 22.4 52.7 320
Lifetrack bald eagle 4 24724 .18 -80.1 35.2 4450
Bald eagle British Colu 10 2731 .25 -128.1 54.3 683
Bald eagle Hiliaeetus 15 1995 .32 -128.1 53.6 428
Golden eagle hawkwatch 26 910 1.06 -114.7 45.2 965
Golden eagle Denali McInt 41 326 1.12 -133.4 58.2 365
Mallard Netherlands Kleyheeg 111 1455 .0115 4.9 52.0 17
Dabbling Duck Ottenby 32 13206 .051 15.2 55.8 674
Blue winged teal ASC 40 840 .23 -99.0 41.5
Stellers eider N Europe 19 593 .52 40.3 70.6 308
Long tailed duck GLS 2018 10 492 .54 24.2 61.0 267
Common Merganser 9 289 .59
Black scoter 48 642 1.01
Common eider Alaska 78 840 1.16
Long-tailed duck Alaska 59 445 1.7
Common eider Aleutian Peter 55 311 1.81 147.3 52.2
Long-tailed duck Yukon 14 91 2.22
Spectacled Eider Alaska 134 457 3.6
Pacific sea ducks migration 354 78 5.08 -126.1 54.8 3000
Surf scoter 16 455 6.0
Juvenile greylag geese 17 24381 .00110 9.0 47.8 27
Greater white goose mig 12 79624 .0031 28.3 55.6 247
Goose Wadden sea 9 17552 .0118 50.0 66.0 157
Greater white front goose N. Sea 81 13416 .059 43.8 63.2 222
Pink footed goose Chudziska 2016 1 256 .066 8.4 56.3 17
WhiteFrontGoose Greenland 4 1834 .083 -34.6 63.4 152
BarnacleGeese Greenland 6 1142 .126 -20.1 67.3 144
White fronted goose Nolet 2016 9 324 .132 5.1 51.9 15.9
Brant geese Boyd 2002 10 564 .15 -138.2 68.6 85
Barnacle goose Svalbard 2014 2 629 .153 .9 59.9 96
Bean goose Finnmark 3 1140 .175 20.6 65.0 200
White front goose Alterra 6 1227 .30 44.7 64.3 368
Brant geese Boyd 2005 23 598 .47 -127.2 59.1
Barnacle geese Barents 13 1623 .53 26.9 60.9 860
Pink-footed geese 21 802 .62 12.9 67.7
Bar-headed goose MPIAB 3 328 .84 75.4 33.2 277
Thick-billed murre C 2010 21 1488 .00127 -82.1 63.0 1.89
Thick-billed murre C 2013 116 760 .00189 -82.1 63.0 1.43
Thick billed murre 2011 7 2803 .00267 -82.1 63.0 7.5 Elliott Coates
Thick-billed murre GC 2017 28 3711 .0073 -82.1 27
Thick-billed murre GD 2016 24 5107 .0079 -78.3 62.6 40.3 ** filename too short
Thick-billed murre GM Canada 24 838 .0093 -75.8 72.9 7.8
Thick-billed murre G 2014 9 534 .0098 -88.0 74.1 5.2
Thick-billed murre GD 2015 51 878 .0108 -78.4 62.8 9.5
Thick-billed murre GM 2016 25 1372 .0158 -75.7 73.0 21.7
Alpine swift Spain Tarragona 17 311 .498 -9.3 12.7 155
Alpine swift Switz Biel 7 366 .499 -8.7 12.4 182
Alpine swift Switz Baden 49 392 .499 -7.1 12.67 196
Alpine swift Switz Lausanne 2 373 .499 -9.1 11.8 186
Alpine swift Turkey Pirasali 61 331 .499 33.3 9.8 165
Alpine swift Switz Lenzburg 35 378 .500 -8.1 12.5 189
Alpine swift Switz Luzern 8 469 .500 -6.2 13.9 234
Alpine swift Bulgaria Sofia 27 372 .500 22.5 9.7 186
Alpine swift Switz Solothurn 9 385 .501 -8.5 12.9 193
Homing pigeon Gagliardo 2011 47 28166 .0000189 10.6 43.5 .60
Pigeon anosmic visual 2 70330 .0000688 10.4 43.7 4.84 Familiar cue *
Homing pigeon Pollonara 2017 35 177980 .00023 10.3 43.7 33.9
Pigeon Zannori 2020 51 5427 .00069 10.7 43.7 3.7 **
Pigeon Columbia Livia Santos2014 10 15974 .00064 8.9 47.5 10.1
Homing pigeon Gagliardo 2020 24 76062 .00033 10.3 43.7 17.7
Homing pigeon Gagliardo 2018 52 913 .00125 10.5 43.3 1.14
Juvenile homing pigeons 53 23862 .00163 8.7 50.1 39
Homing pigeon Gagliardo 2016 131 970 .00181 10.6 43.6 1.75
Homing pigeon Gagliardo 2014 19 2031 .0110 10.4 43.7 22.4
Homing pigeon Gagliardo 2021 209 1100 .0171 10.6 44.1 18.8
Homing pigeon Frankfurt 3 44842 .0197 8.6 50.1 884 Schiffner Wiltschko *
White stork Oberschwaben 1 67600 .000230 15.6 9.3 48.0
White stork 2014 60 119430 .000408 6.5 45.8 49
White stork SW Germany 1 73200 .00104 8.9 47.8 76.3
White stork Bavaria 1 14040 .0047 10.9 49.8 66.2
White stork Poland 20 29349 .0047 27.7 37.0 118.
White stork Sicily 7 12929 .0057 14.2 37.2 73.4
White stork e-obs MPIAB 2 26400 .0058 24.7 18.4 154
White stork e-obs GSM 5 14400 .0061 15.4 37.3 88 ** Unknown if same as Carlson
White stork Vorarlberg.2016-19 4 83076 .00706 7.0 45.9 586
White stork Rheinland Pfalz 55 66600 .00764 1.2 41.3 509 2015-2019
White stork Rotics 2016 103 14280 .0101 20.4 36.3 144
White stork e-obs Carlson 2021 47 67538 .0126 13.2 51.3 798
White stork Tunisia 9 22747 .0191 17.3 23.5 290
White stork Rotics 2018 35 34489 .0195 27.1 27.2 673
White stork Greece evros delta 5 15400 .0196 26.0 27.9 301
White stork Uzbekistan 16 61637 .052 69.8 40.8 1218
White stork S Africa lifetrack 1 1935 .066 20.3 -31.9 128
White stork Moscow 10 44551 .089 31.5 24.7 405
White stork Armenia 10 13239 .108 45.5 37.3 341
White stork Bulgaria 1 661 .127 39.8 5.3 84
White stork Kosova 8 33368 .233 31.0 21.0 352.9
White stork S Africa MPIAB 6 838 .466 23.5 -25.0 391
White stork MPIAB 1991 2018 178 1895 .966 14.9 25.9 781
White stork GSM MPIAB 2018 2 42600 .97 32.4 24.1 193 *
White stork Greece MPIAB 2 70 1.28 35.6 28.0 90
Gyps vulture Rocamadour2018 6 32930 .000047 1.6 44.8 1.55
Vulture S Africa Lifetrack 1 2012845 .000328 30.8 -23.9 660
Himalayan vulture Sherub 2016 22 76678 .00194 92.5 30.0 149
Griffon vulture Salzburg 2 18840 .00260 9.8 47.8 49 Albstadt
Griffon vulture Croatia 1 32300 .00398 14.4 45.0 124
Black vulture SE USA 17 153309 .0048 -81.6 33.0 736
Himalayan griffon Bhutan MPIAB 2 22460 .0066 88.7 27.6 149
White backed vulture Namibia 15 23110 .0105 15.8 -19.3 244 Spiegel 2013 V2 **
Andean.condor Argentina 2013-18 8 620 .0107 -71.2 -41.3 6.64
Egyptian vulture 2012-2019 15 38489 .018 42.3 25.6 702 Mid-East, E. Africa
Honey buzzard NE Poland 4 3360 .0304 16.5 31.8 102
Galapagos albatross 28 572 .0647 -84.4 -2.5 37.1
Turkey vulture NS America 359 601 .098 -92.8 27.9 59
Vulture Acopian full 64 10691 .106 -89.7 23.6
Hooded vulture Africa 19 16384 .120 29.3 -15.2 1426
Egyptian vulture MidEast EAfrica 22 26518 .41 42.3 25.5 560
Egyption vulture Tunisia 1 186 .210 10.1 36.2 39
Rough-legged buzzard 2 758 .77 13.3 62.1 587 Variable environment
Rough-leggedBuzzard lifetrack 80 3645 1.97 48.2 62.0 551
Great black backed gull 2019 7 39360 .00172 8.5 54.8 68 Borrmann
Caspian gull 1 252846 .00284 19.3 50.0 718
Black backed gull Garthe 7 7088 .0022 7.7 53.8 16
Herring gull Fifield Witless 8 25680 .0175 -55.4 46.7 449
Herring gulls Canada 6 24166 .0210 -55.3 46.8 507 *
Herring Gull Brier Is 10 10450 .029 -66.7 44.1 303
Herring Gull Kent Is 16 3644 .053 -67.3 44.2 193
Herring Gull East Bay 15 1753 .129 -81.2 57.0 226
Herring gulls Clark Mass 5 2357 .20 471
Lesser black backed gull 120 711 .281 31.1 31.8 200 Wikelski 2015
Herring Gull Sable Is 17 2684 .32 859
Sabine gull Canadian Arctic 36 178 1.24 -96.1 15.8
Red backed shrike 2020 43 677 .527 23.6 7.5 357 Pedersen **
Shrike Scandinavia 2018 17 713 .53 22.6 7.7 378
Shrike Scandinavia 2019 27 686 .53 22.9 7.2 364
Red backed shrike Iberian 2017 7 629 .653 20.6 12.2 410
Trawling bat Giuggioli 2015 545 127 .00000019 -2.7 51.4 .000024
Jap greater horseshoe bat 2020 5 5327 .000060 141.6 42.7 .32
Straw colored fruit bat Africa 62 290 .0122 14.7 -2.0 3.54 2009-14
Fruit bat Ghana Sapir 2014 9 68 .0180 -.3 5.8 1.23
Fringe lipped bat Panama 2017 6 259 .0193 -79.8 9.2 5.0 Jones
Bat frugivorous Specialization 11 68 .0481 -47.9 -22.0 3.3
Blue fin whale S Cal 2015 1 17170 .021 -119.9 34.1 360
Sperm whale Gulf Cal 25 180 .046 8.3
Great whale Azores 31 212 .120 -31.2 45.5 25.5
False killer whale Hawaiian Is 6 716 .120 -162.3 22.9 85.8
Sperm whale Gulf Mex 17 421 .21 88
Sperm whale NW Atlantic 1 55 .220 -74.0 35.9 12.1
Grey whale Russia Sakhalin 2011 1 243 .362 147.7 53.5 88
Blue whale E N Pacific 285 57 .40 -119.8 33.7 23
Humpback whale Hawaii 1995 2000 45 45 .586 -150.2 35.5 26.6
Fin whale Gulf Cal 2001 8 72 1.21 -112.1 27.4
Fin whale N Mediterranean 2003 8 20 6.92 3.7 41.1 142
Grey seals Sable Is 14 8888 .030 -6.5 37.4 267
Grey seal McConnel UK 1 2535 .095 -.6 56.0
Cat Australia 441 2398 .0039 138.7 -34.8 9.4
Cat New Zealand 232 1752 .0058 174.8 -41.2 10.2
Cat USA 153 4312 .0092 -76.8 37.8 40
Cat UK 100 182 .056 -5.0 50.3 10
Cat curious minds 2017 30 87 .736 175.5 -36.8 64
Cat Albany 11 74 1.45 -73.9 42.7
Elephant Java MPIAB 1 83370 .00058 101.9 -1.0 49 **
Elephant Kruger 2007 14 20263 .0313 31.7 -24.5 634
African elephant Wall 2014 2 11747 .0399 .6 14.3 469
African elephant etosha 2018 15 6666 .109 15.8 -19.1 728 Tsalyuk
Forest elephant telemetry 34 1074 .390 12.7 .1 419
Wolf Alberta Lamtham 12 1263 .130 -113.0 55.9
Wolf Mongolia 2003-5 2 1840 .387 93.7 45.5 712
Jaguar Catinga 2 3478 .0454 -42.6 -8.7 158
Jaguar Taiama 13 3301 .067 -57.4 -16.9 222
Elk Banff 2018 31 4466 .070 -115.7 51.7 *
Elk Banff 2020 175 9060 .235 -115.6 51.7 738
Baboon Strandburg Peshkin 2015 1 143729 .0000238 36.9 .3 3.42 **
Cattle Cameroon far north 33 5058 .000094 15.0 11.2 .47
Cattle Cameroon Logone 9 6712 .000076 15.0 11.2 .51
Irish hare N Ireland 2 1366 .00130 -6.1 54.9 1.77
Frigatebird Panama Iguana Is 9 1149 .00354 -80.1 7.9 4.08
Bison Dunn Ranch 9 12450 .0107 -94.1 40.5 133 **
Dog stray Prishtina 1 130 .0121 21.2 42.6 1.57
Swamp wallabie Australia 48 478 .0144 145.2 -38.5 6.9 Phillips Is
Lyles flying fox Cambodia 2019 10 677 .0163 105.1 11.3 11.0
Black backed jackal Namibia 22 5940 .042 15.9 -19.1 252 Etosha
Red fox Australia Scotia 14 6718 .0536 141.0 -33.2 360
Kruger African buffalo S Africa 7 3521 .0606 31.8 -24.6 214
White bearded wildebeest Kenya 36 7752 .0667 36.3 -1.7 517
Galapagos tortoise movement 2 38898 .0675 -90.9 -.5 2625 Movement ecology *
Baboon S Africa Bonnell 2016 14 4417 .074 20.4 -34.5 327
Mongolian gazelle Mongolia 4 827 .135 106.6 47.3 111
Roe deer Italy 2005 2008 5 2202 .194 11.0 46.0 428
Cheetah S Africa 2014-15 1 1182 .256 27.1 -25.3 302 Pilanesberg Park
King cobra Thailand Elapidae 7 1834 .354 101.9 14.5 649
MangabeyMonkey Uganda Waser1975 18 669 .428 30.4 .6 286
Horse Mongolia Przewalski 2007 1 1355 .53 93.5 45.5 720
Mountain caribou B Columb 195 1259 .58 -122.1 55.4
Tsavo lion study 3 718 .654 38.9 -3.8 469
Green python Australia CapeYork 28 82 1.91 143.3 -12.7 157
Brown bear Slovenia 1993 1999 22 86 3.55 14.3 45.9 306
Coyote Albany 32 71 4.4 -73.9 42.7
Kruger buffalo S Africa 165 160 5.62 31.8 -24.4 900
Galapagos tortoise hatchling 62 19 33.5 -90.5 -.7 634
We list the full set of fertilizer molecules.
Element     Molecule     Common name          Element  Fertilizer  Element   Solubility   Human
                                               cost       cost     fraction               edible
                                                g/$       g/$        ppt      g/Litre

Calcium     CaCl2        Calcium chloride        182       504       361        745         *
Calcium     Ca(NO3)2     Calcium nitrate          35       142       244       1212
Calcium     Ca(H2PO4)2   Monocalcium phosphate                       171         20         *
Calcium     CaHPO4       Dicalcium phosphate                         295           .2       *
Calcium     Ca3(PO4)2    Tricalcium phosphate                        388           .02      *
Calcium     Ca(C2H3O2)2  Calcium acetate                             253        347         *
Calcium     CaC6H10O6    Calcium lactate                             184         58         *
Calcium     Ca3(C6H5O7)2 Calcium citrate                             241           .85      *
Calcium     CaCO3        Calcium carbonate                           400           .013     *
Calcium     CaC12H22O14  Calcium gluconate                            93        low         *

Potassium   KCl          Potassium chloride      340       649       524        254         *
Potassium   K2SO4        Potassium sulfate       136       303       449
Potassium   KH2PO4       Monopotassium phosphate  44       153       287        226         *
Potassium   K2HPO4       Dipotassium phosphate              13                 1492         *
Potassium   K3PO4        Tripotassium phosphate                                 900         *
Potassium   KNO3         Potassium nitrate                 126       387

Phosphorus  (NH4)H2PO4   Monoammonium phosphate  185       689       269        360
Phosphorus  (NH4)2HPO4   Diammonium phosphate     38       161       235        600
Phosphorus  KH2PO4       Monopotassium phosphate  35       153       228        226         *
Phosphorus  Mg(H2PO4)2   Monomagnesium phosphate                                            *
Phosphorus  MgHPO4       Dimagnesium phosphate                                              *
Phosphorus  Mg3(PO4)2    Trimagnesium phosphate                                             *

Magnesium   MgCl2        Magnesium chloride       55       217       255                    *
Magnesium   MgSO4(H2O)7  Magnesium sulfate        33       336        99
Magnesium   Mg(H2PO4)2   Monomagnesium phosphate                                            *
Magnesium   MgHPO4       Dimagnesium phosphate                                              *
Magnesium   Mg3(PO4)2    Trimagnesium phosphate                                             *
magnesium   Mg(NO3)2     Magnesium nitrate                           164        710
Magnesium   MgS          Magnesium sulfide                                      351

Nitrogen    CO(NH2)2     Urea                    482      1032       467       1079
Nitrogen    (NH4)H2PO4   Monoammonium phosphate   84       689       122        360
Nitrogen    (NH4)2HPO4   Diammonium phosphate     34       161       212        600
Nitrogen    (NH4)2SO4    Ammonium sulfate         69       324       212        744
Nitrogen    (NH4)NO3     Ammonium nitrate                            350        150
Nitrogen    KNO3         Potassium nitrate                           139
Nitrogen    Mg(NO3)2     Magnesium nitrate                           189        710

Sulfur      (NH4)2SO4    Ammonium sulfate         79       324       243
Sulfur      K2SO4        Potassium sulfate        56       303       184
Sulfur      MgSO4(H2O)7  Magnesium sulfate        44       336       130
                 Chloride   Phosphate   Sulfate   Nitrate
                    Cl         PO4        SO4      NO3
                   g/$         g/$        g/$      g/$

Potassium   K       649        153        303*     126
Calcium     Ca      504*         -        114      142*        Calcium sulfate = Gypsum
Magnesium   Mg      217          -        336*     113*
Nitrogoen   NH3     283        698        163*       -         Ammonium nitrate is an explosive
For example, 1 dollar buys 649 grams of potassium chloride.
Urea = CO(NH2)2 = 1032 gram/$.
 |
 |
 |
 |
 |
|---|---|---|---|---|
 |
 |
 |
 |
 |
|---|---|---|---|---|
_(14748581674).jpg) |
 |
 |
 |
 |
 |
|---|---|---|---|---|---|
 |
 |
 |
|---|---|---|
 |
 |
 |
 |
 |
 |
|---|---|---|---|---|---|
 |
 |
 |
 |
 |
 |
|---|---|---|---|---|---|
 |
 |
 |
|---|---|---|
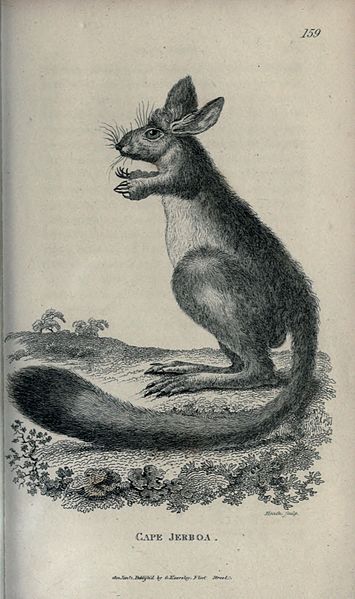
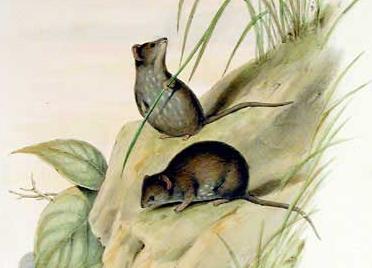
Mass (grams)
Etruscan shrew 1.8
Bumblebee bat 2
Balachristan jerboa 4
Planigale 4.3
Ningaui 6.9
American shrew mole 10
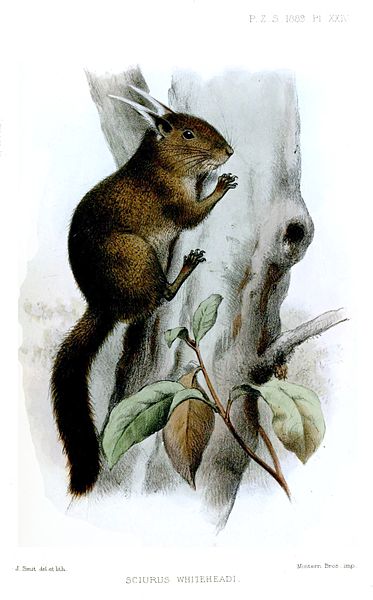
Pygmy squirrel 16
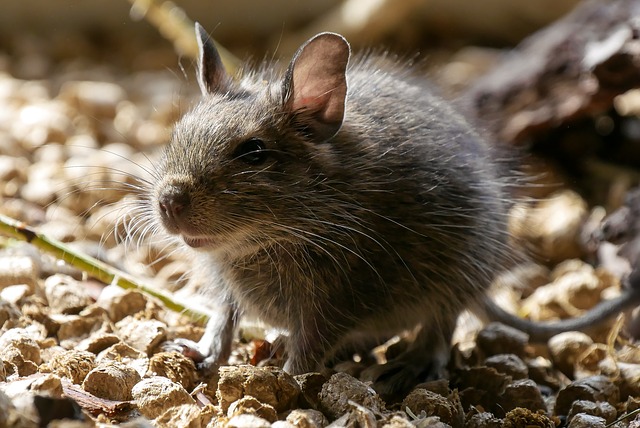
Mouse 19
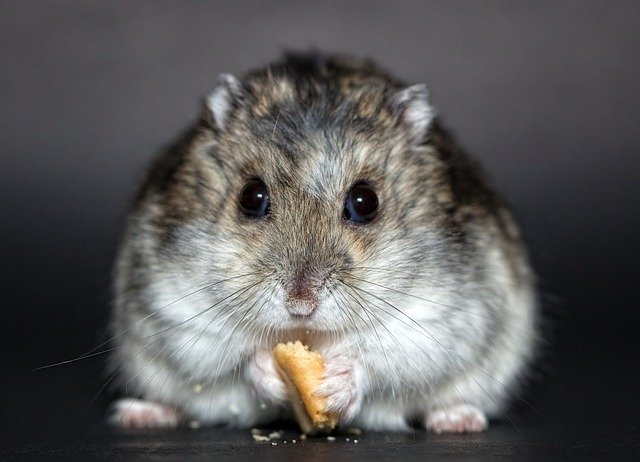
Dwarf hamster 23
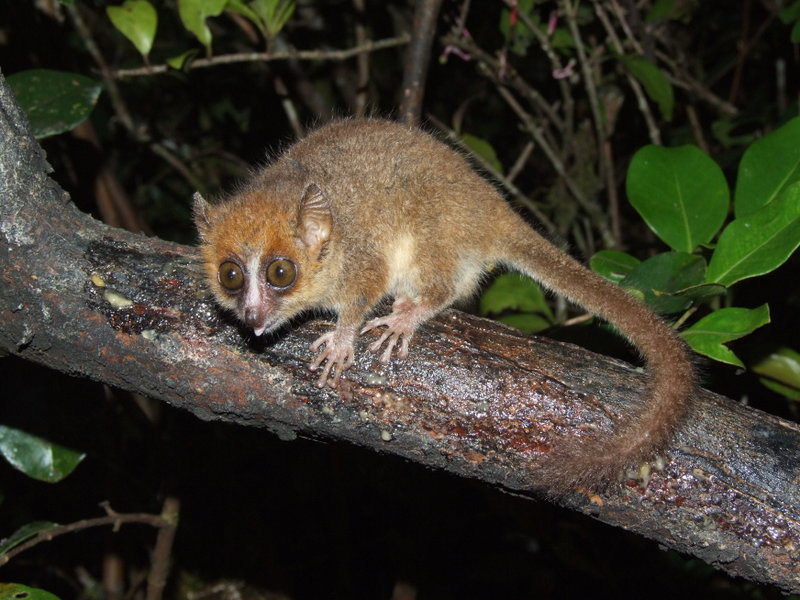
Mouse lemur 30
Pygmy jerboa 34
Gerbil 71
Least weasel 76
Thick-tailed jerboa 80
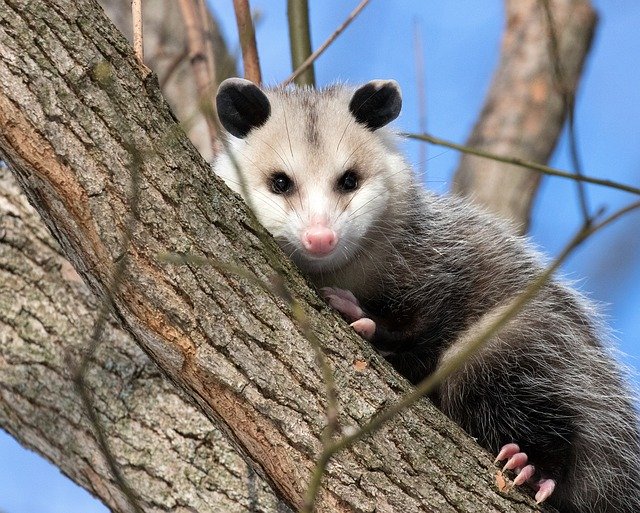
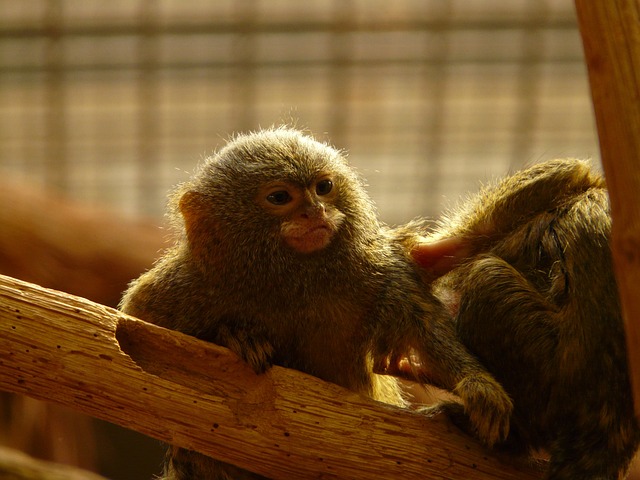
Pygmy marmoset 100
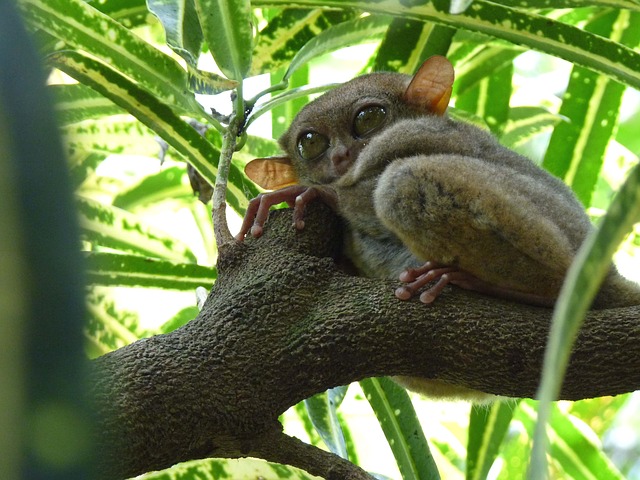
Philippine tarsier 110
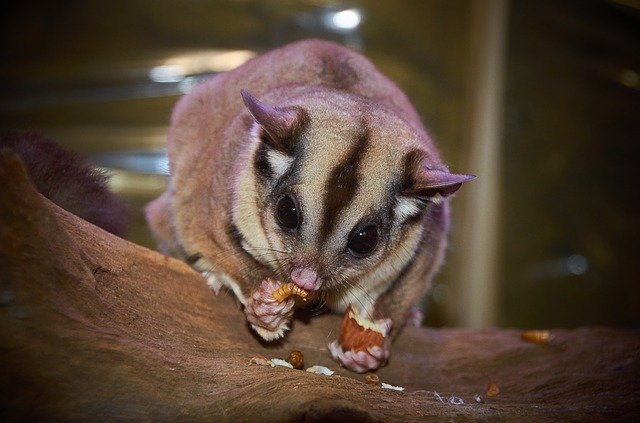
Sugar glider 140
Hamster 160
Flying squirrel 160
Degu 260
Pygmy rabbit 430
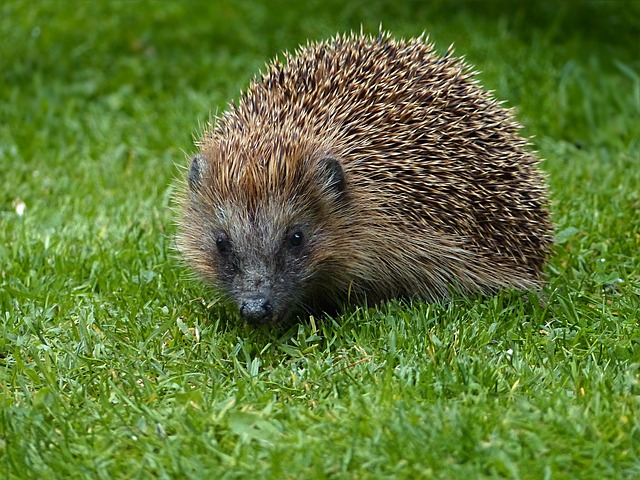
Hedgehog 450
Squirrel 500
Rat 500
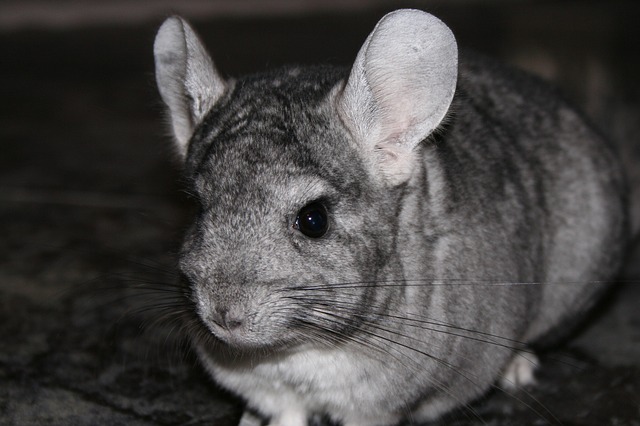
Chinchilla 700
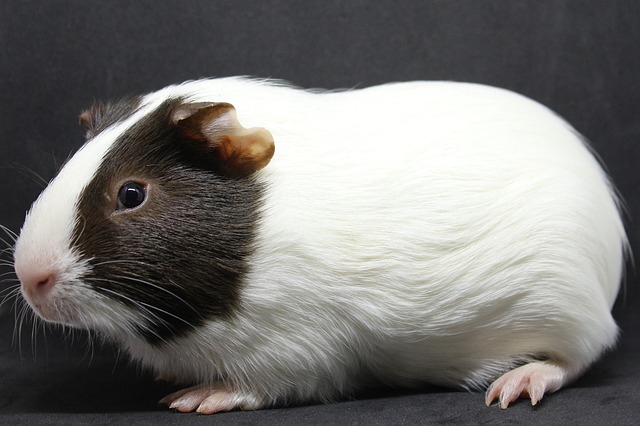
Guinea pig 910
Mink 1000
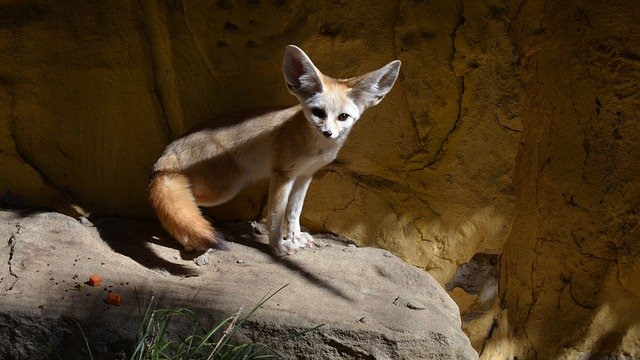
Fennec fox 1060
Muskrat 1100
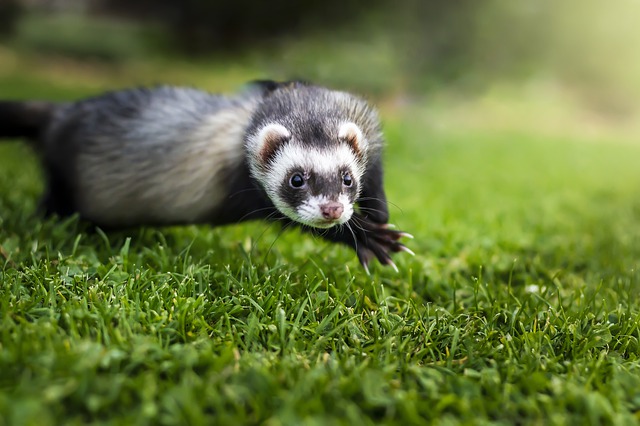
Ferret 1500
Pygmy sloth 3000
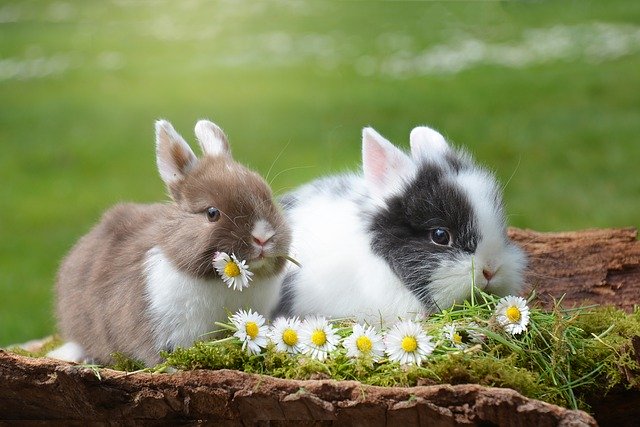
Rabbit 3000
Cat 4000
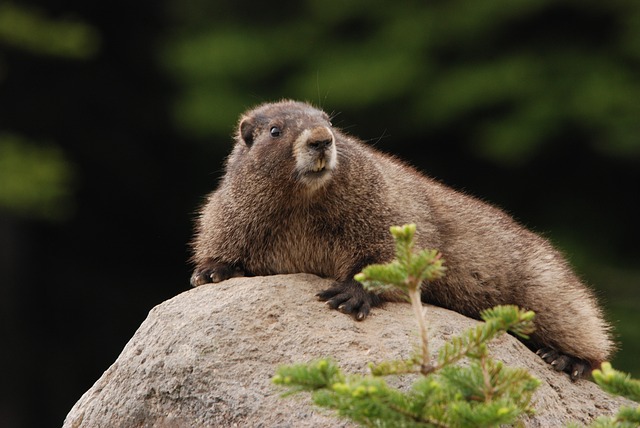
Marmot 4000
Opossum 5000
Koala 8000
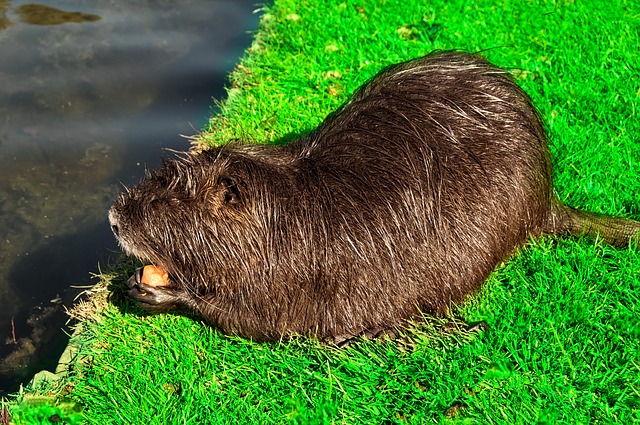
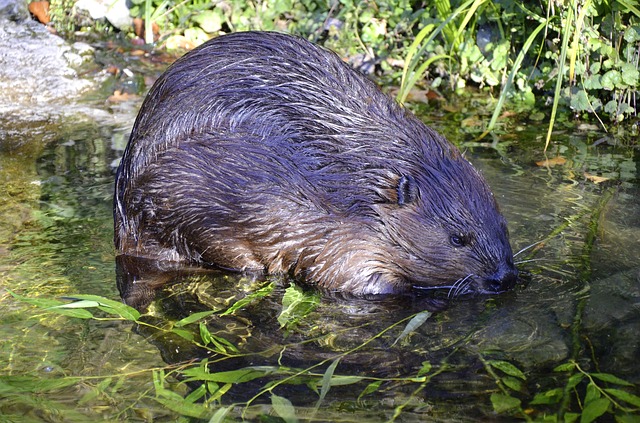
Beaver 20500
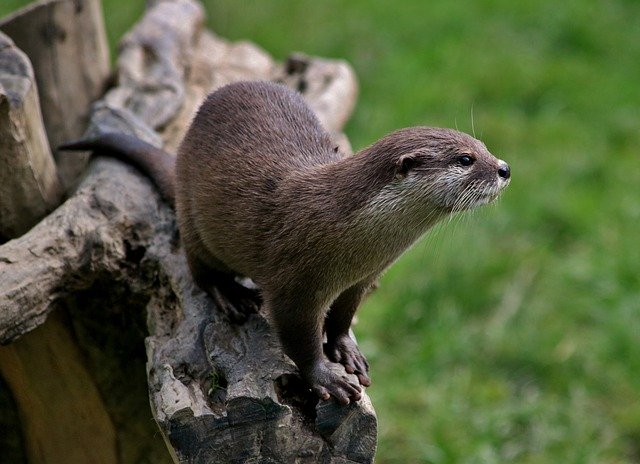
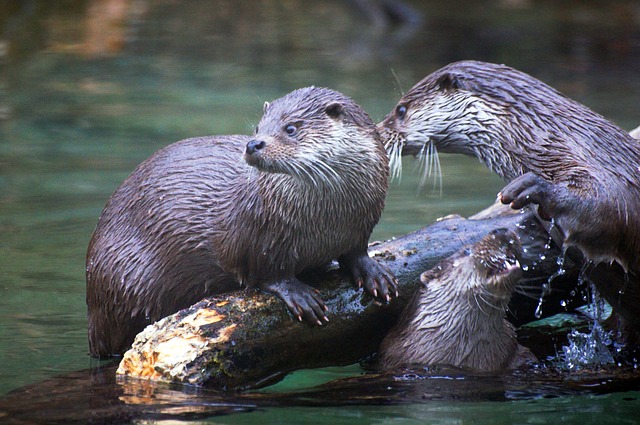
Otter 26000
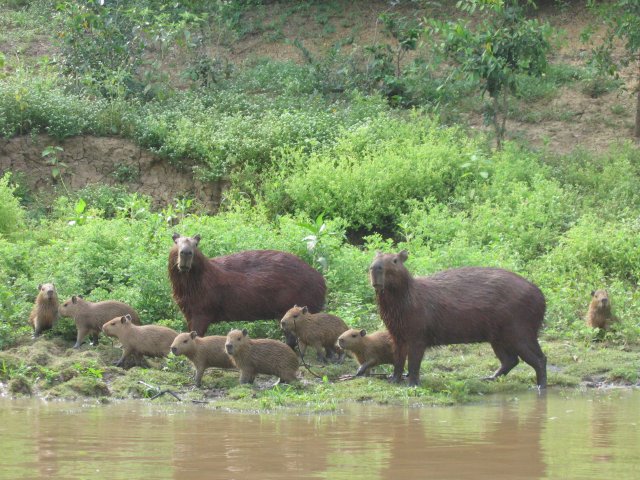
Capybara 50000
 |
 |
|---|---|
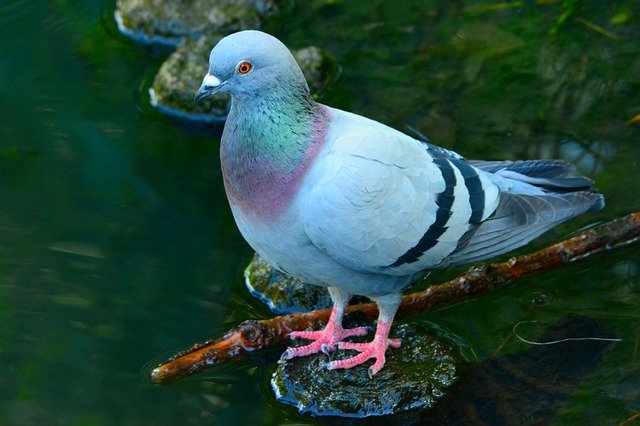
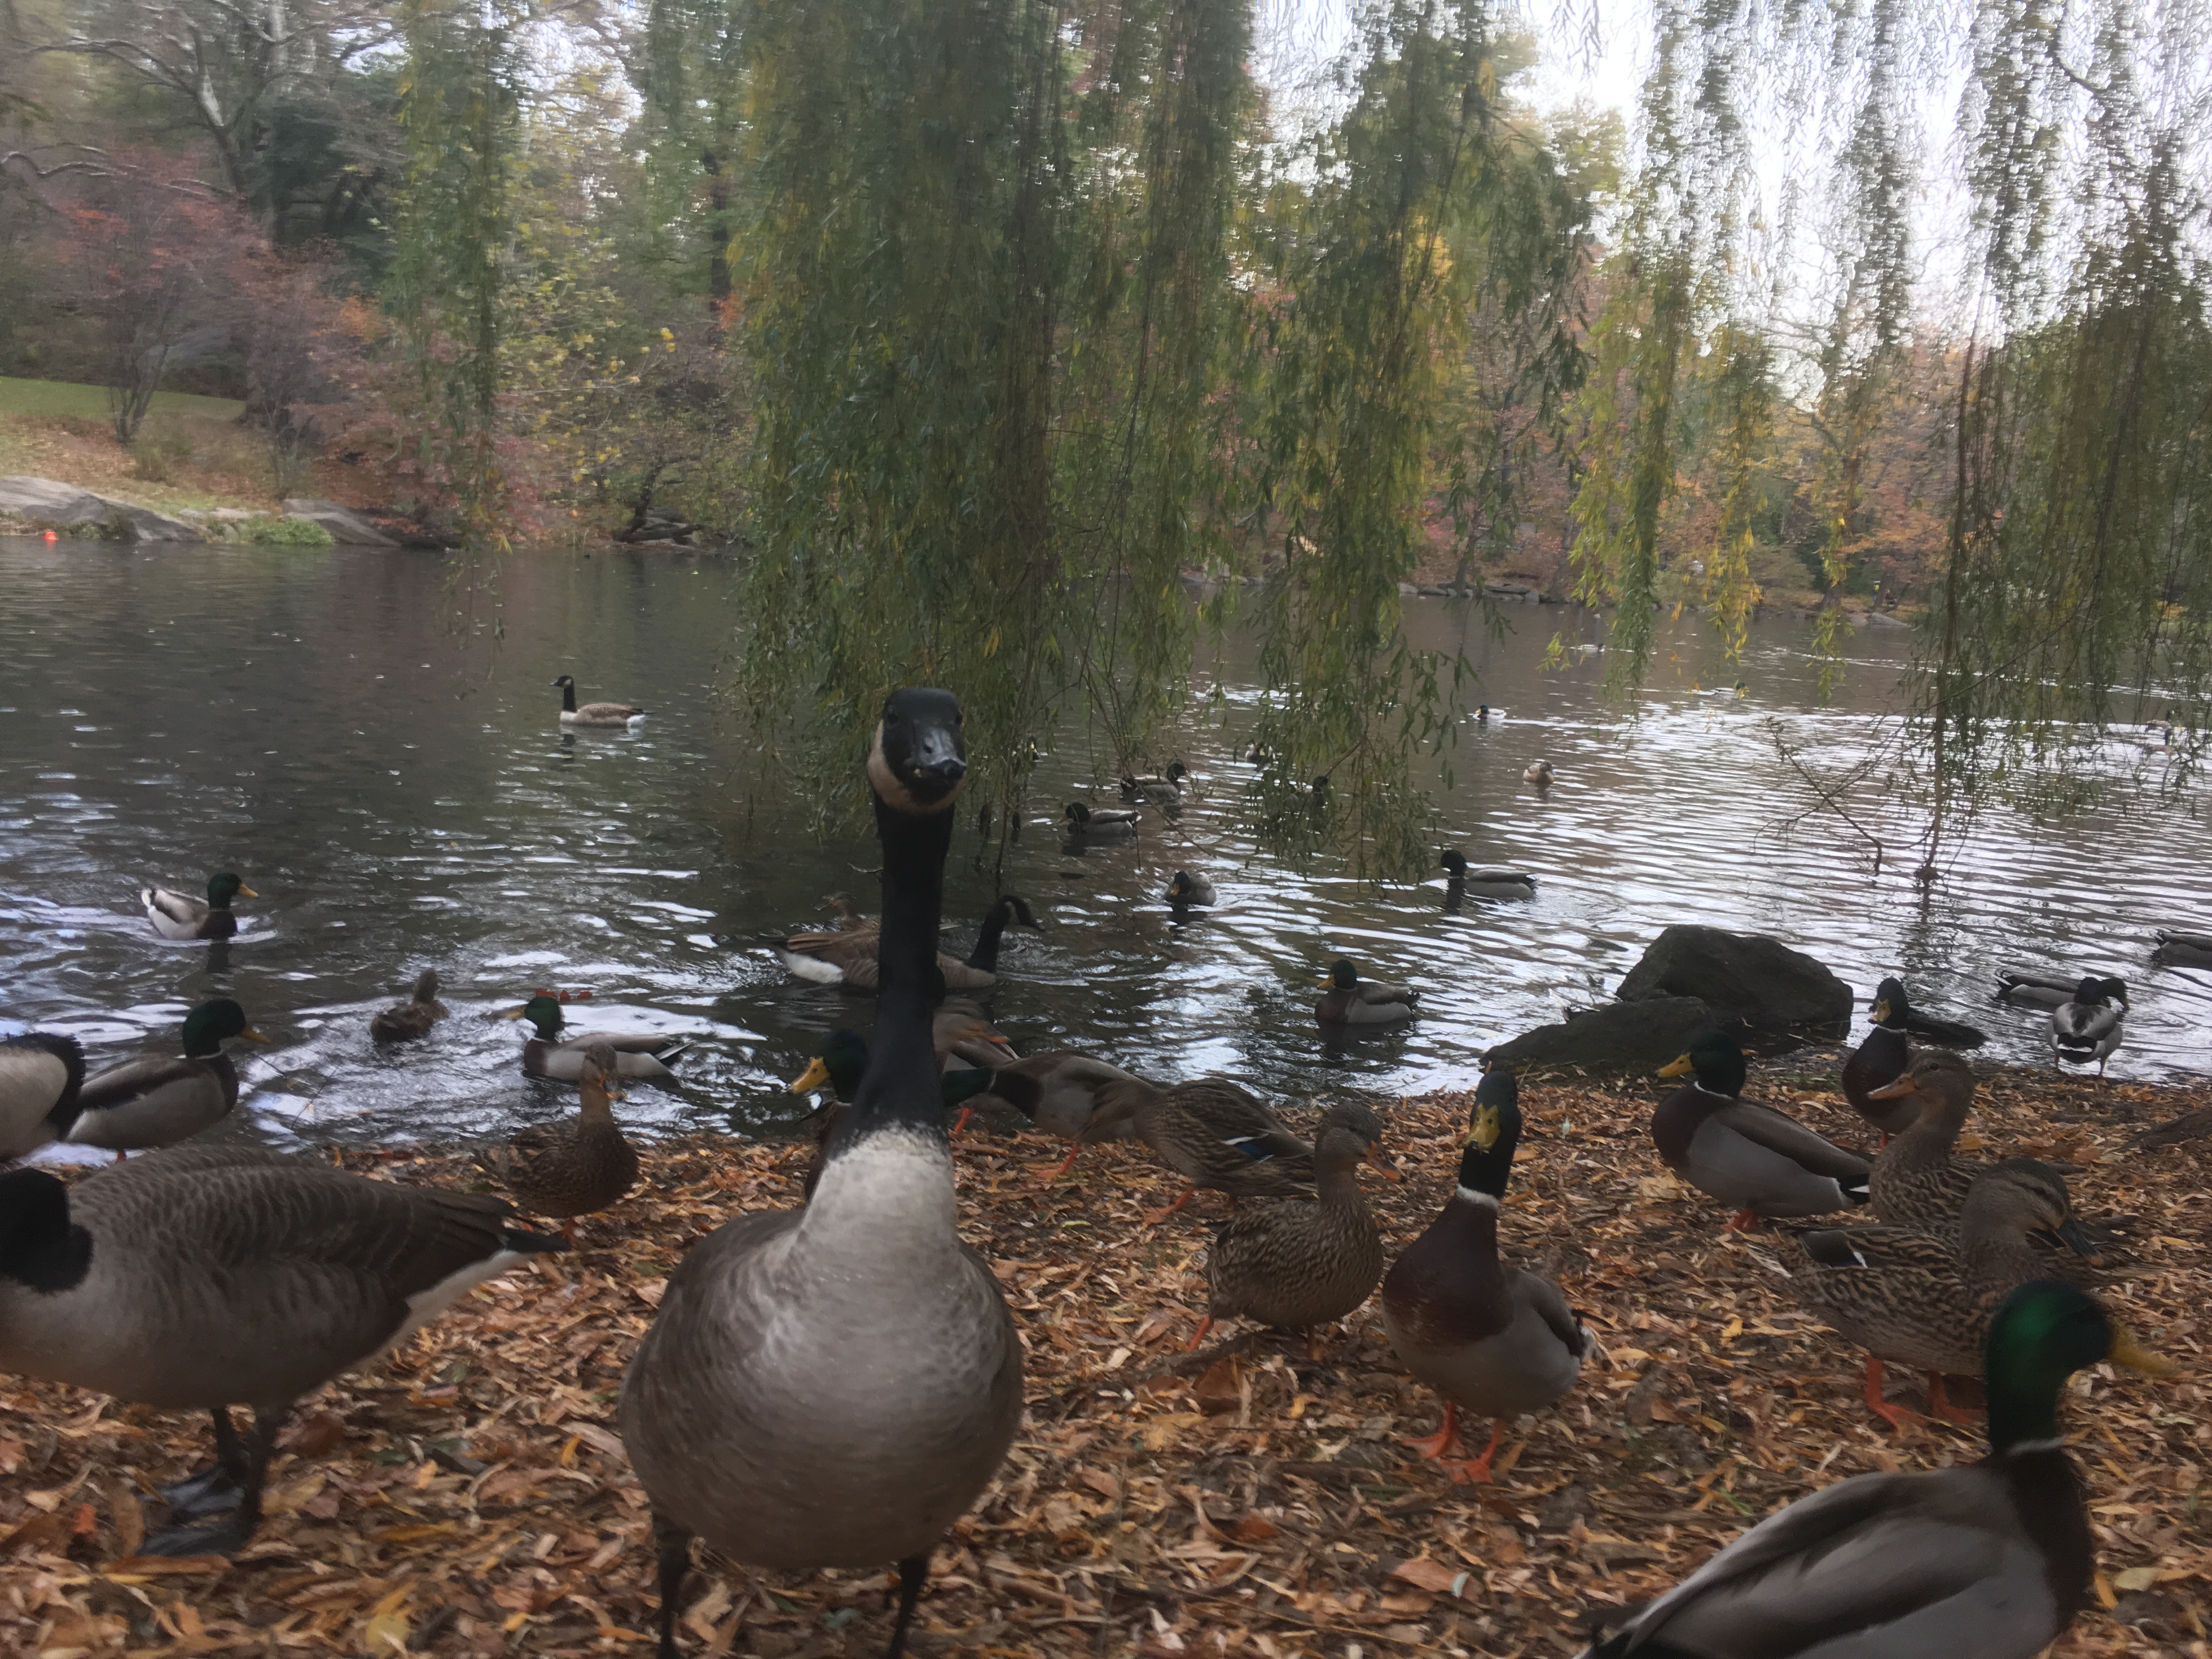
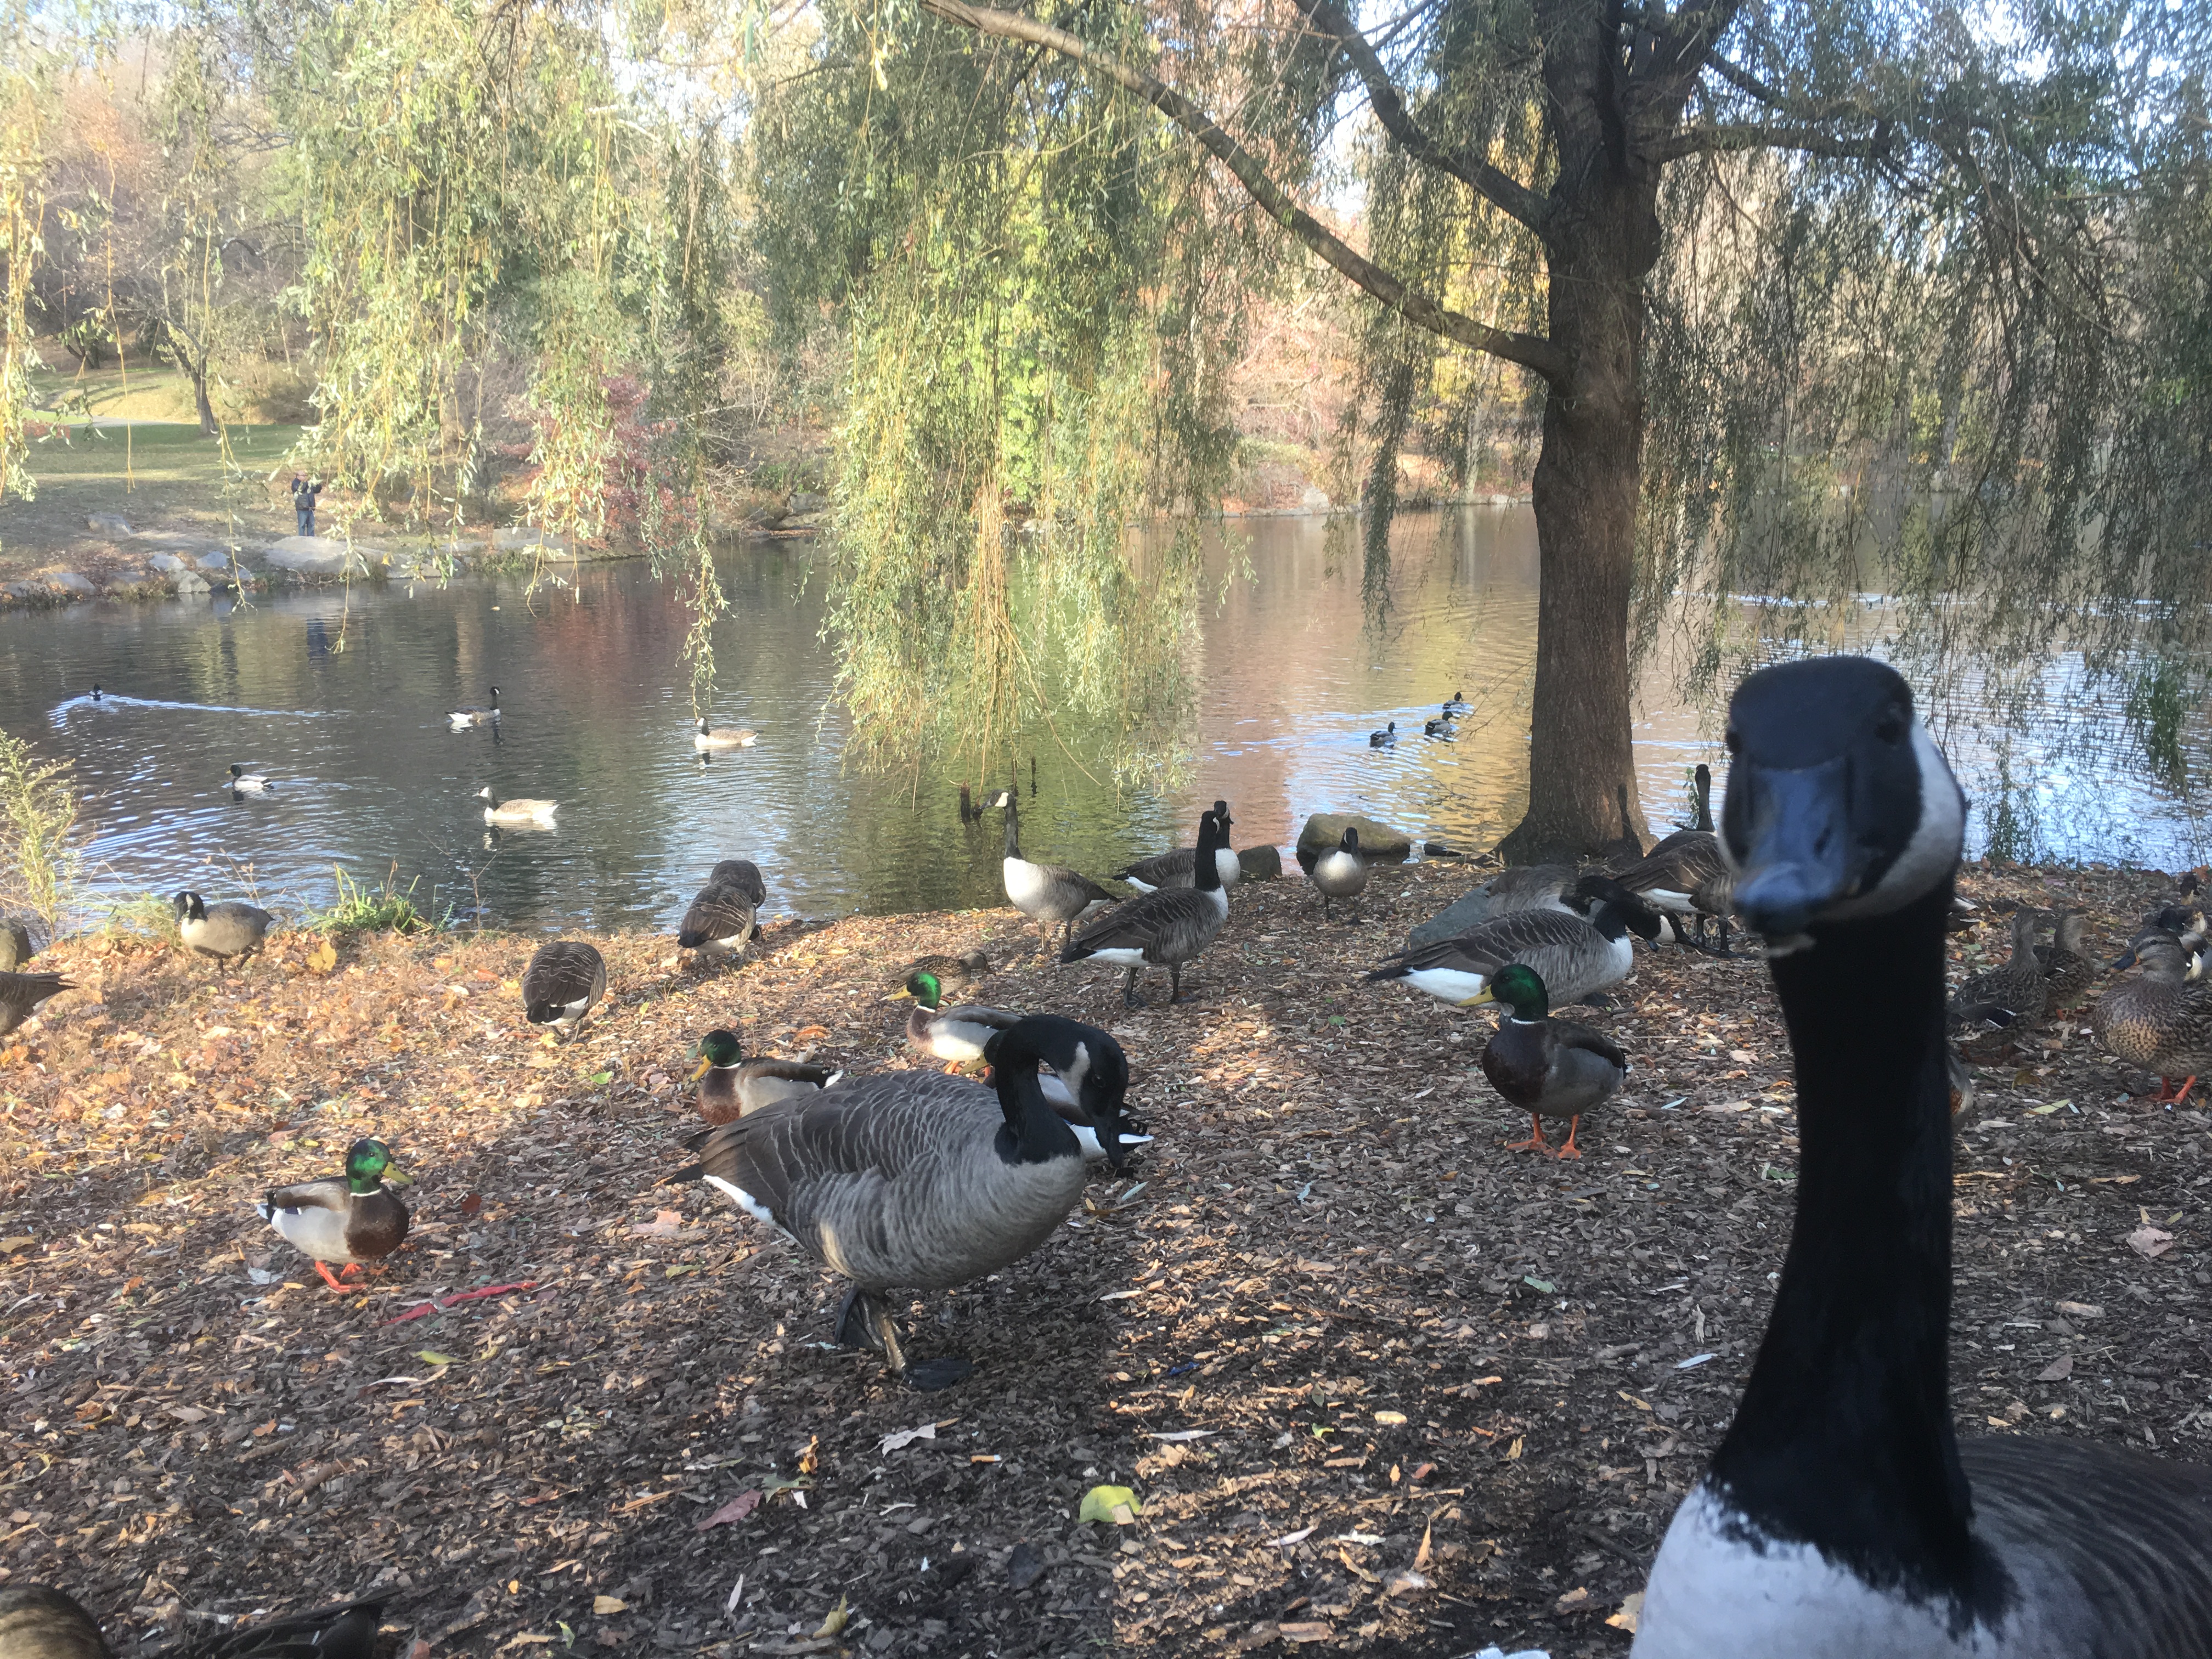
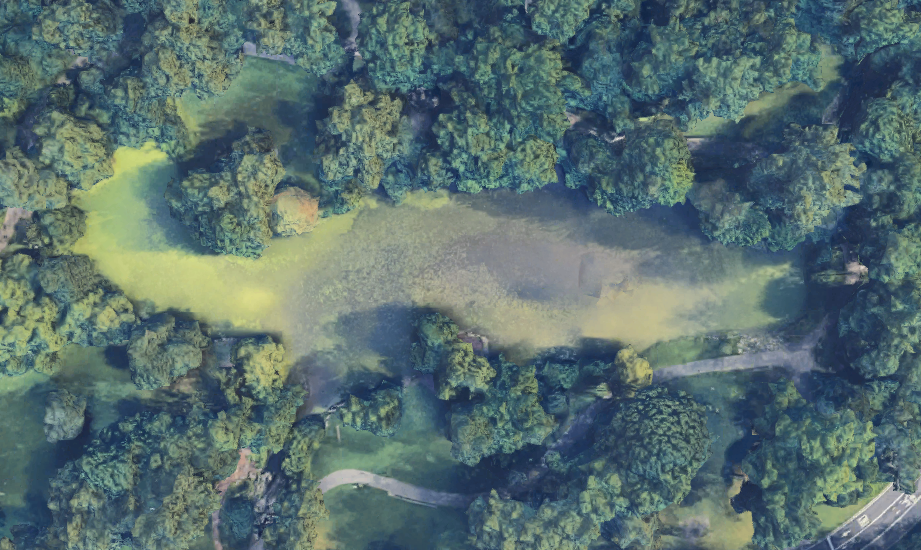
The Bird Spa is at the Central Park lake at 101st street, on the south side isthmus.
 |
 |
|---|---|
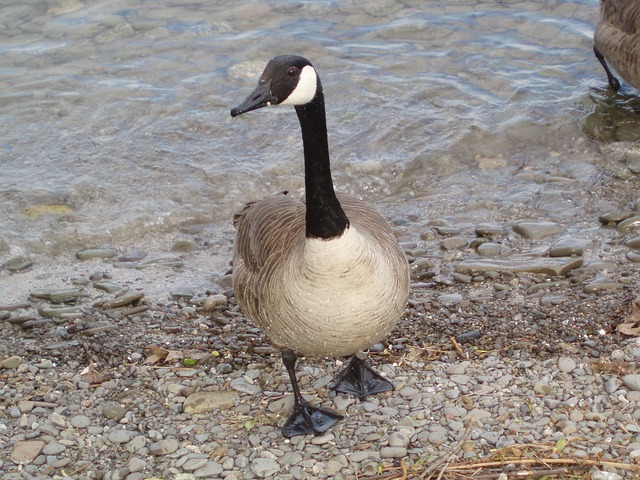
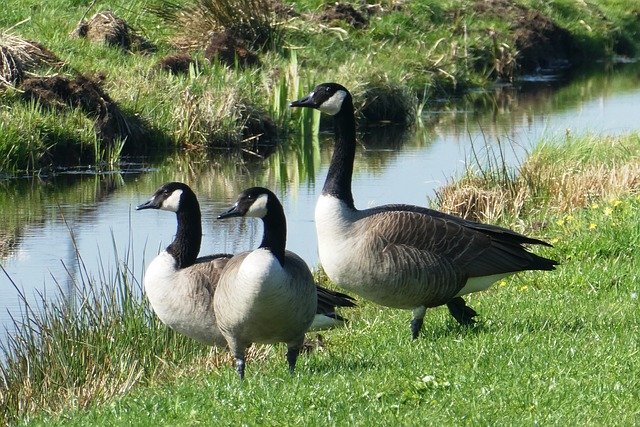
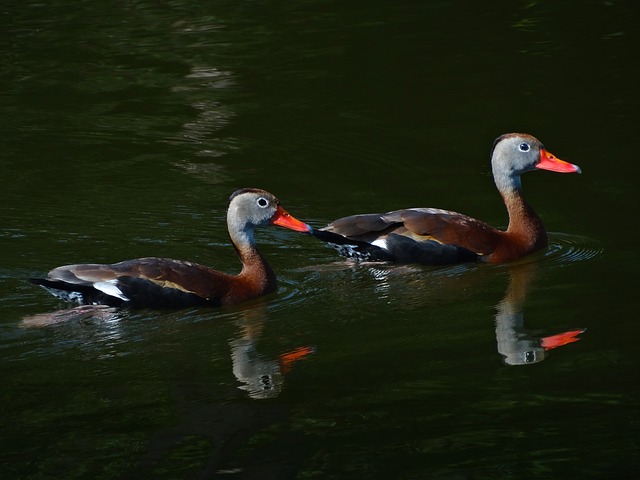
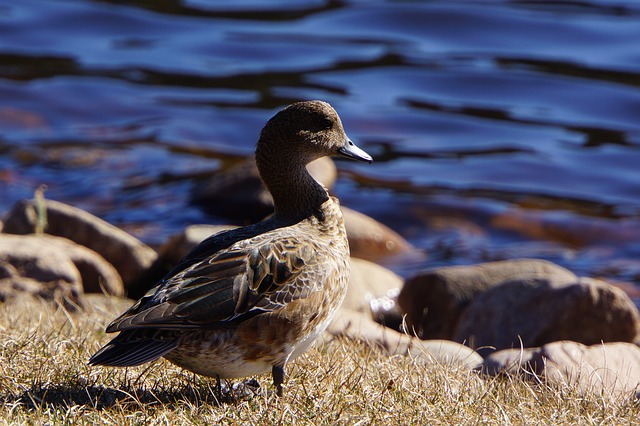
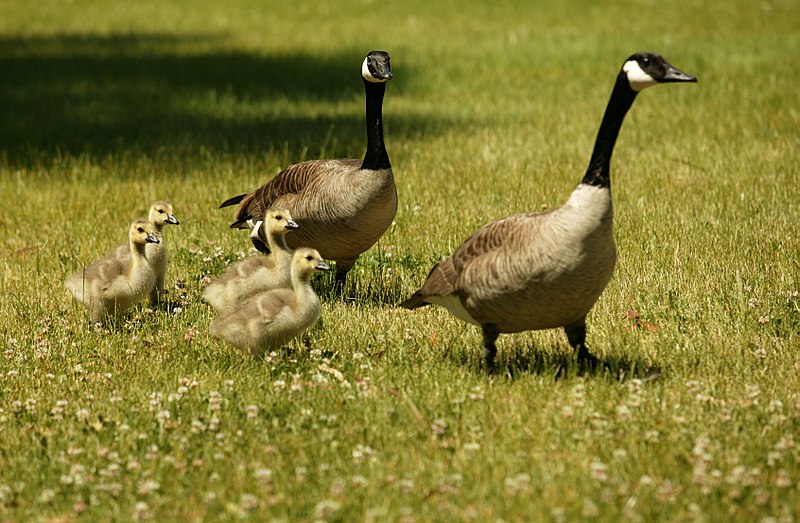
Ducks can catch bread with a week of training. After a month they can make highlight-reel catches. Geese are too slow to catch.
Ducks can take off vertically. Hold out a piece of bread at waist height and a duck will jump and flap to get it.
Geese are gregarious and will eat out of your hand. Ducks will eat out of your hand after a week of familiarity.
 |
|---|
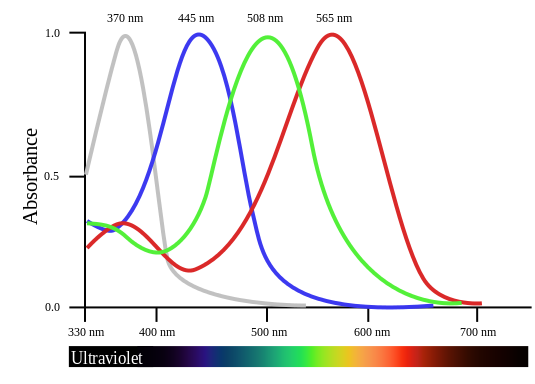
Birds see the 3 colors that human see, plus an extra ultraviolet color.
The incubation temperature for chicken eggs is 37.5 Celsius (99.5 Fahrenheit).
Eggs should be placed with the pointed ends down and turned regularly (at least three times per day) until one to three days before hatching.
       Incubation time
            days

Duck         28
Goose        30
Swan         35
Turkey       28
Chicken      21
Pheasant     25
Pigeon       18
Canary       13
Ostrich      42