
|
|
|
|
|
|
|---|---|---|---|---|---|
 |
 |
 |
 |
 |
 |
 |
|
|---|---|---|---|---|---|---|---|
 |
|---|
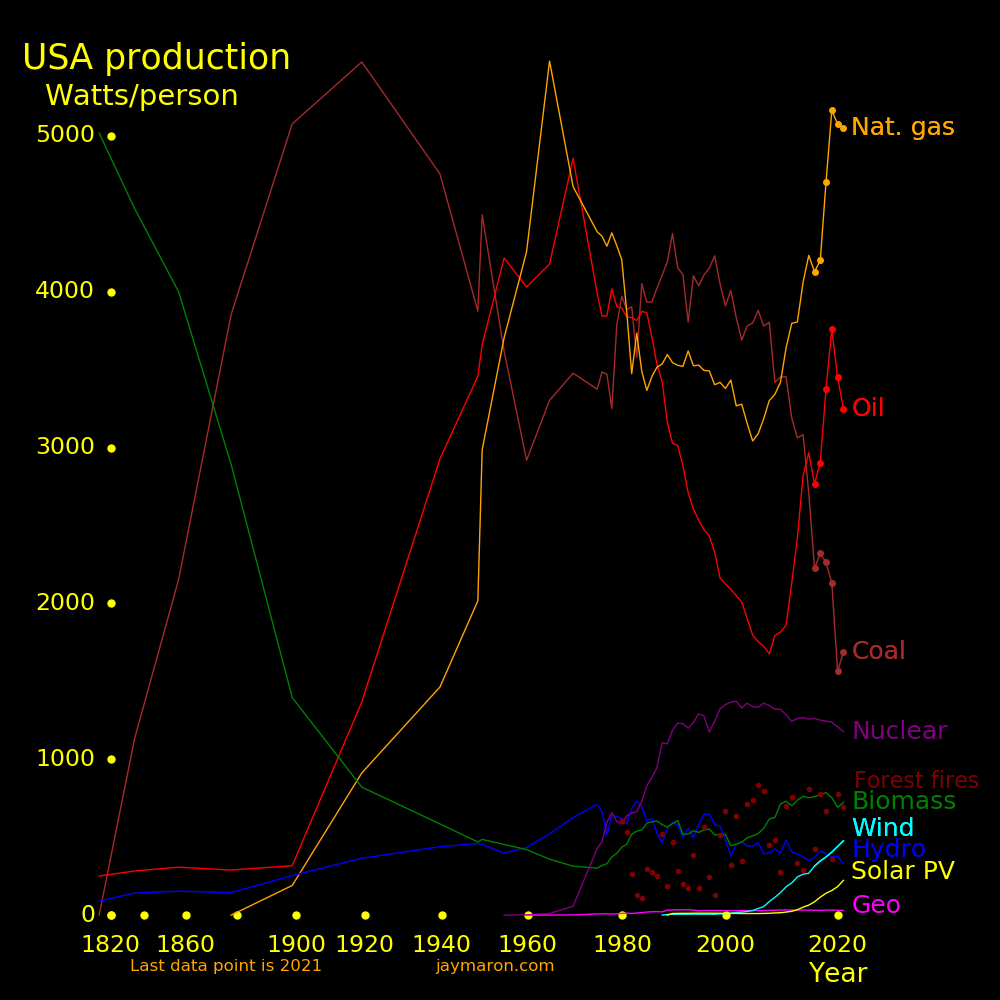
Biomass and nuclear have great expansion potential. Hydro is maxed out, solar and wind are growing slowly, and tidal and geothermal are feeble.
Trees are great for harnessing biomass energy, especially bamboo for its fast growth and ease of harvest. Trees can also capture atmospheric carbon. Tree production hinges on fertilizer, which hinges on energy. Article.
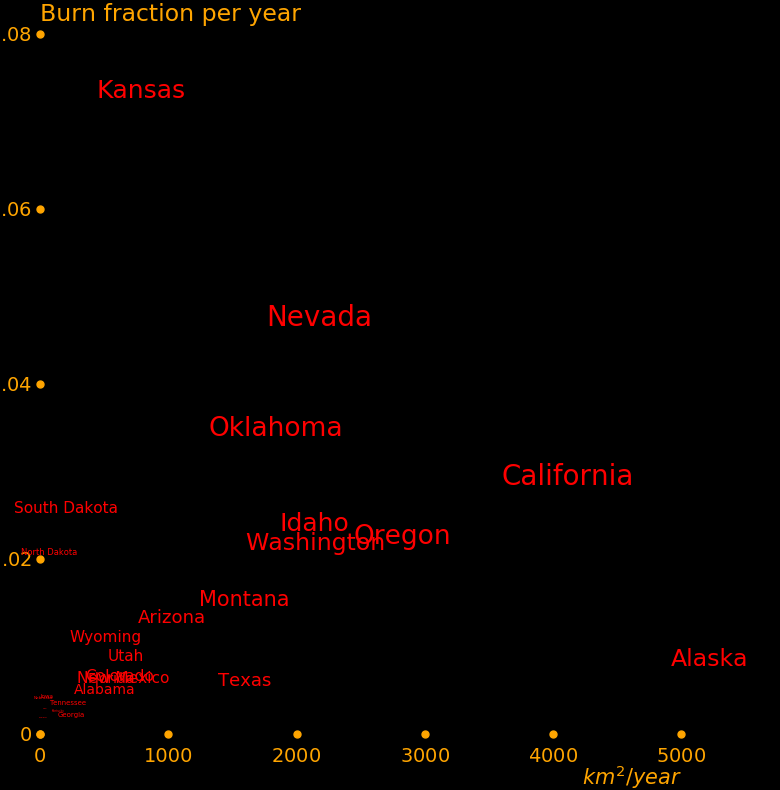
Much energy is lost to forest fires.Article.
Nuclear power is cheap and unlimited, and reactors can provide things of value besides the usual heat and electricity. They can use transmutation to create precious metals and novel isotopes. A reactor's discard heat can heat a city. Radioactive waste contains valuable catalysts such as palladium and rhodium. Modern reactors have abundant safety features. Article.
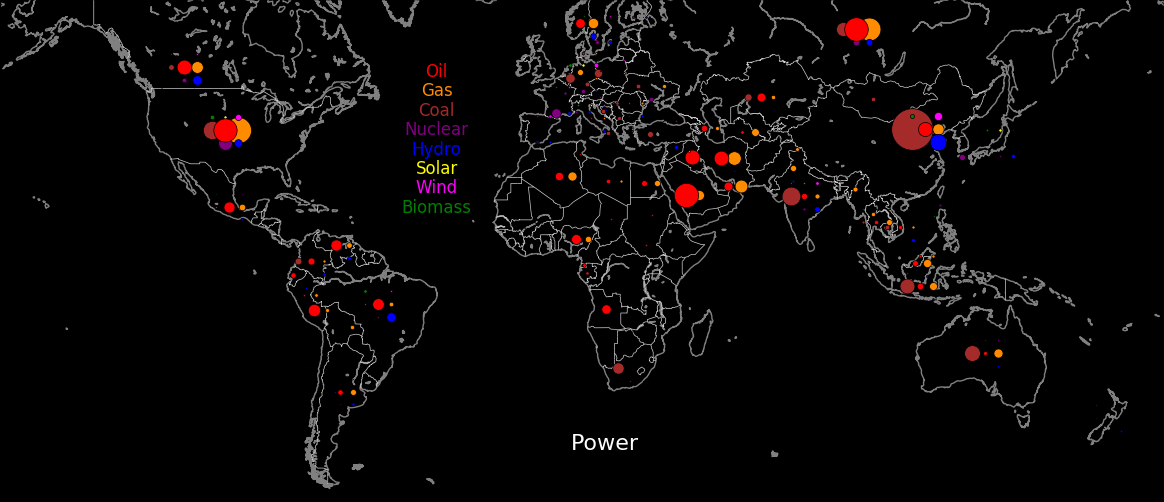
The energy source that produces the most CO2/energy is coal. The carbon produced by each energy source, in kilograms CO2 per MegaJoule of electricity, is:
Coal          .23
Oil           .18
Natural gas   .13
All others   <.01
Data: U.S. Energy Information Administration
 |
|---|
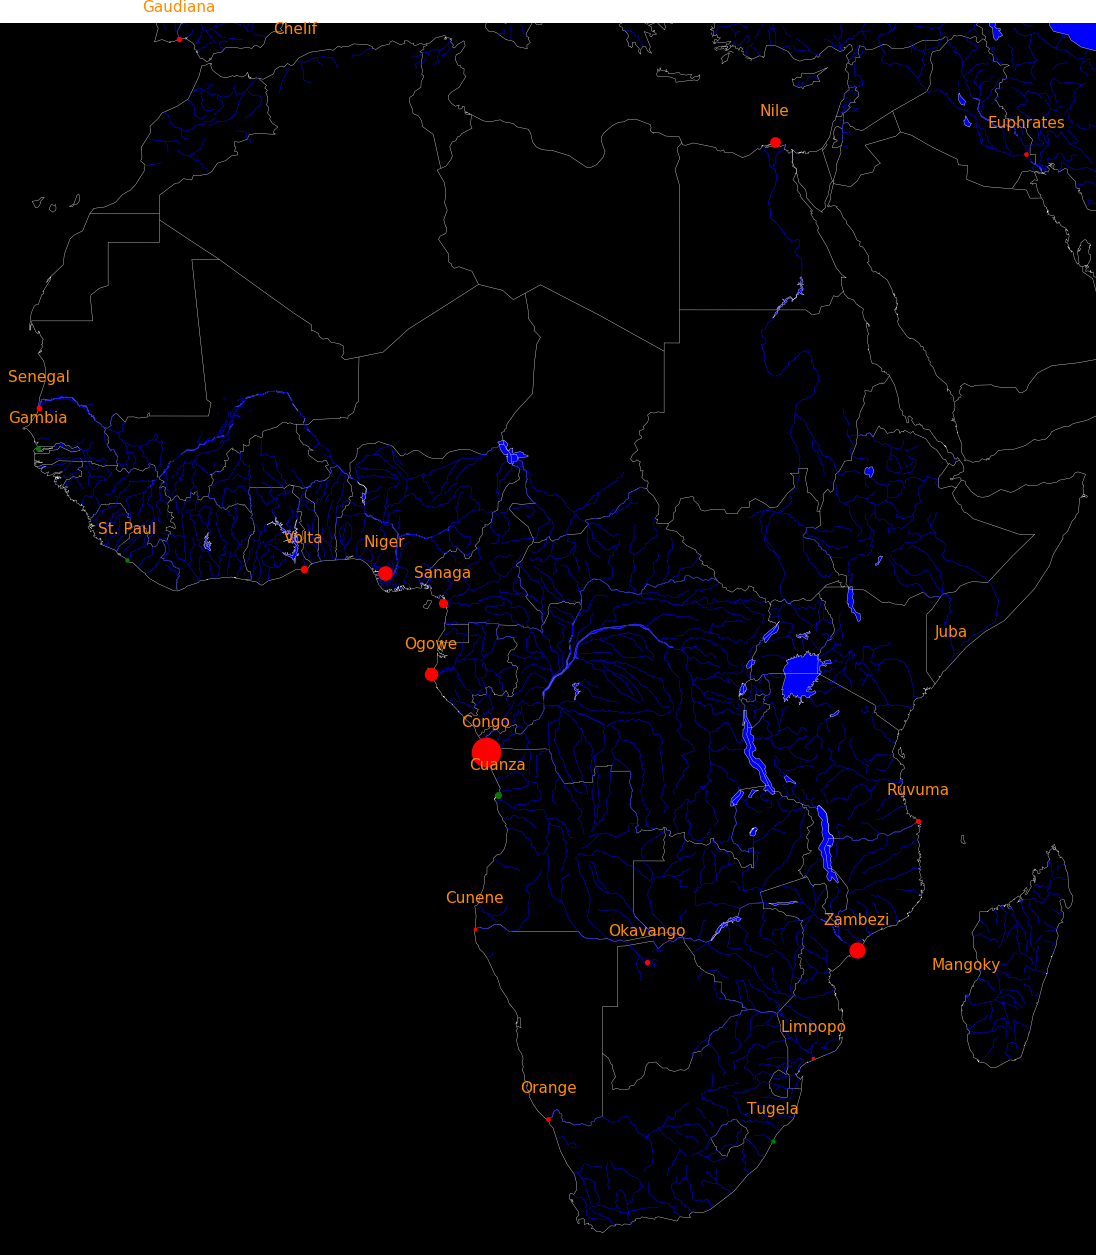
Production scales as dot radius cubed. Production from different sources are in scale.
Data: British Petroleum Statistical Review of World Energy
 |
|---|
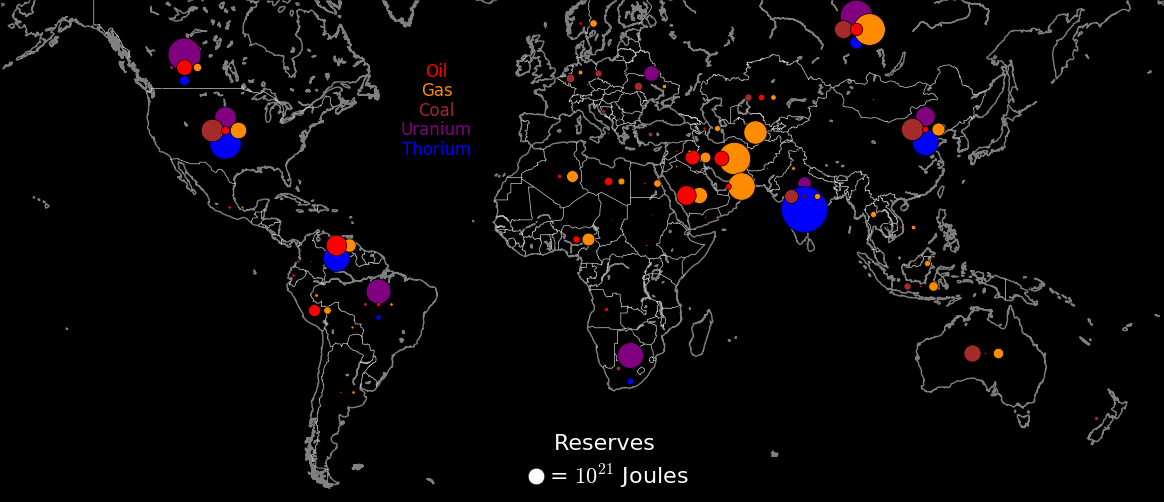
Reserves scales as dot radius cubed. Production from different sources are in scale.
Data: British Petroleum Statistical Review of World Energy
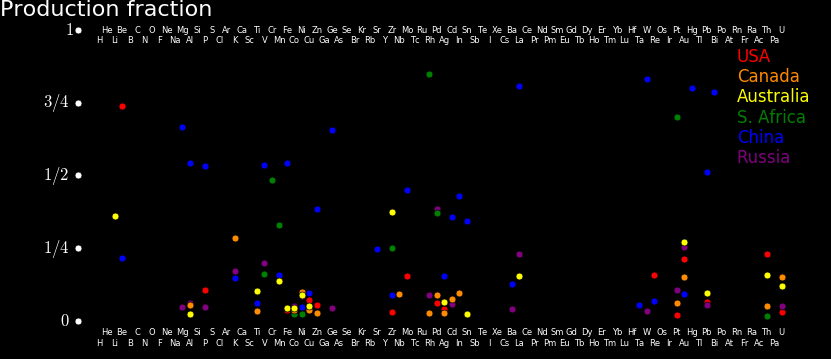
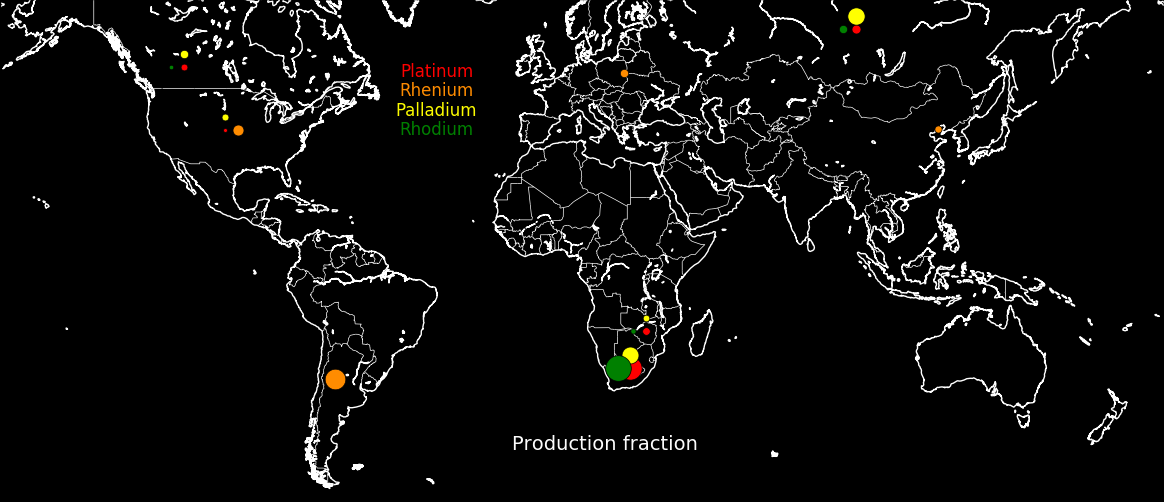
China dominates the production of most elements, with South Africa in second place. America dominates for only beryllium, rhenium, and thorium. The plot shows the fraction of world production for each element.
 |
|---|
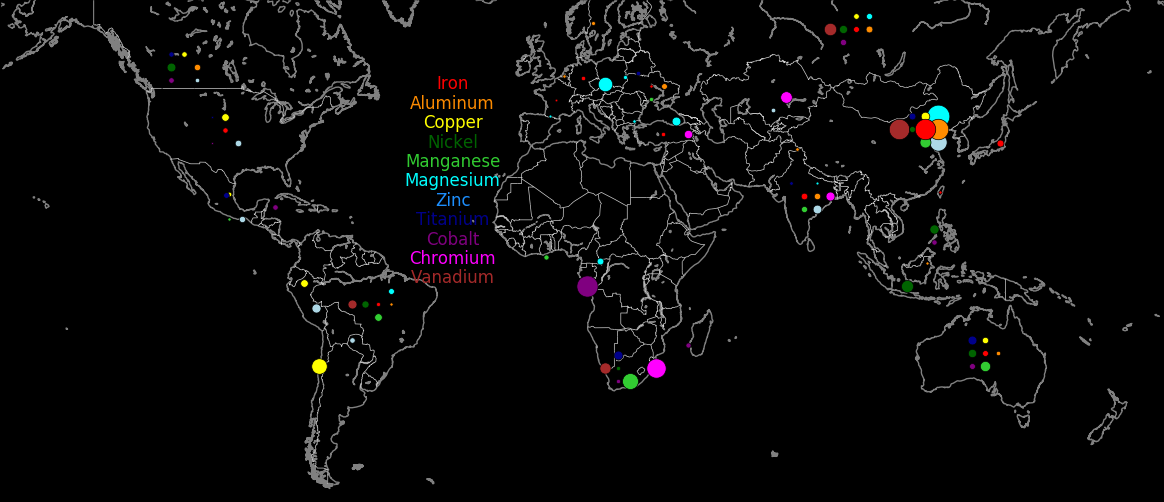
Macrometals are the metals mined by greatest mass. The macrometal superpowers are China, South Africa, Australia, Russia, India, and Canada. America has feeble production. The following plot shows each nation's fraction of world production for each metal. Data is from USGS 2018.
 |
|---|
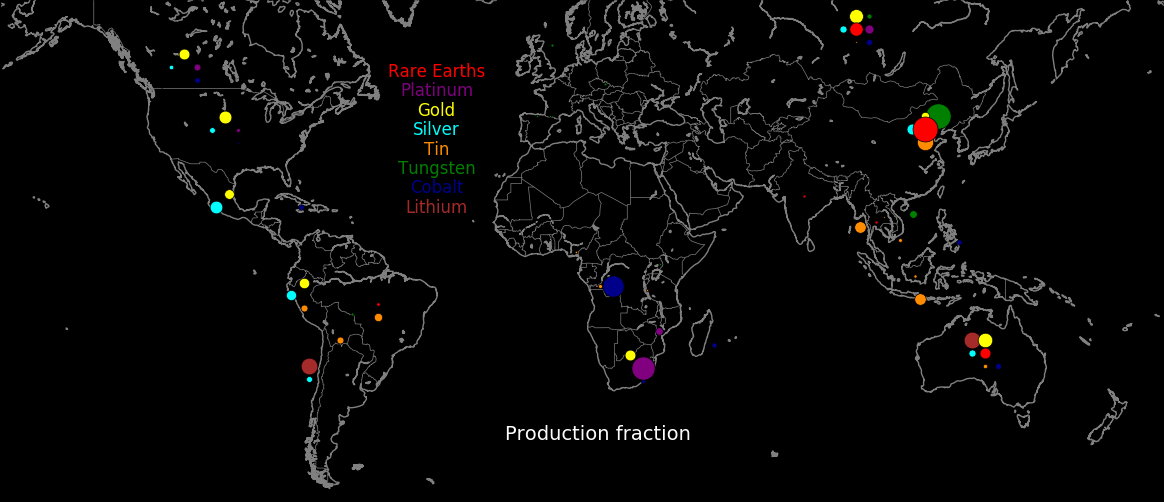
The plot shows the most endangered elements and where they are produced. Many come from conflict zones or from hostile nations. Most come from China.
 |
|---|
The endangered elements are:
Element       Source                   Use

Cobalt        DR Congo                 Lithium-ion batteries, steel alloy
Lithium       Australia, Chile         Lithium-ion batteries
Rare-earths   China                    All of the electronics industry, especially solar cells and magnets
Germanium     China                    Fiber optics
Tin           China                    Solder and bronze
Tungsten      China                    Superhard materials in the form of tungsten carbide
Scandium      China, Ukraine, Russia   Aluminum alloy
Phosphorus    China, Israel, Canada    Fertilizer
Potassium     China, Israel, Canada    Fertilizer
There isn't enough lithium and cobalt to build an electric car for everyone in the world.
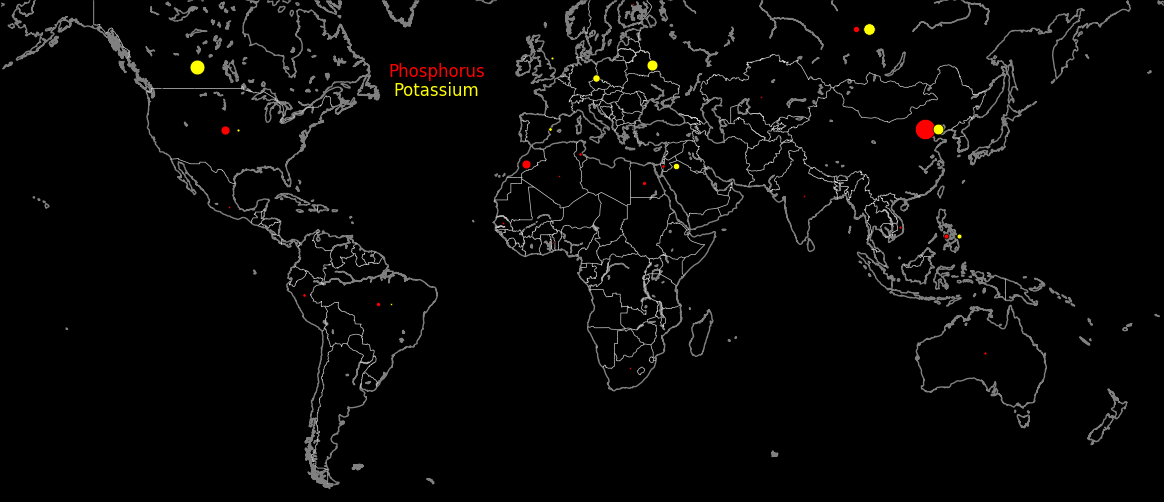
The ultimite limit to how much food we can grow is from fertilizer, and this hinges on phosphorus and potassium. Biomass power is vast, hence phosphorus and potassium are critically important.
Most endangered elements are endangered because they're produced primarily in China.
Elements that are important but not endangered include:
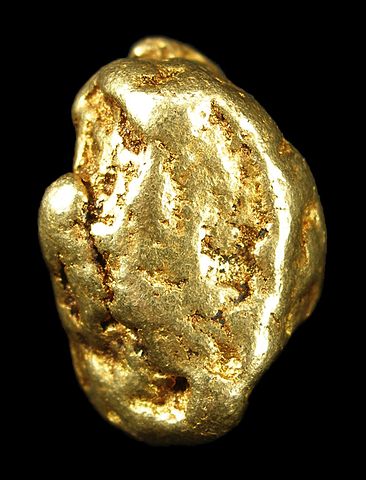
Platinum     Canada South Africa     Catalyst
Palladium    Canada South Africa     Catalyst
Rhodium      Canada South Africa     Catalyst
Rhenium      Chile USA Peru Poland   Aircraft turbines
Osmium                               Superhard metal
Iridium                              Superhard metal
Molybdenum                           Strong metal
Beryllium    USA                     Strong lightweight metal
Tantalum     Australia Brazil Canada Capacitors and is produced in Australia, Brazil, and Canada.
Nickel       Worldwide               Steel alloy. Turbines
Caesium      Canada                  Drilling lubricant in the form of caesium formate
Gold         USA Canada Australia    Currency
Silver       Mexico Peru             Solar cells
Copper       Chile Peru USA Aus Chi  Power wires
Gallium      Worldwide               Extracted from aluminum ore
Uranium      Worldwide               Nuclear energy
Thorium      Worldwide               Nuclear energy
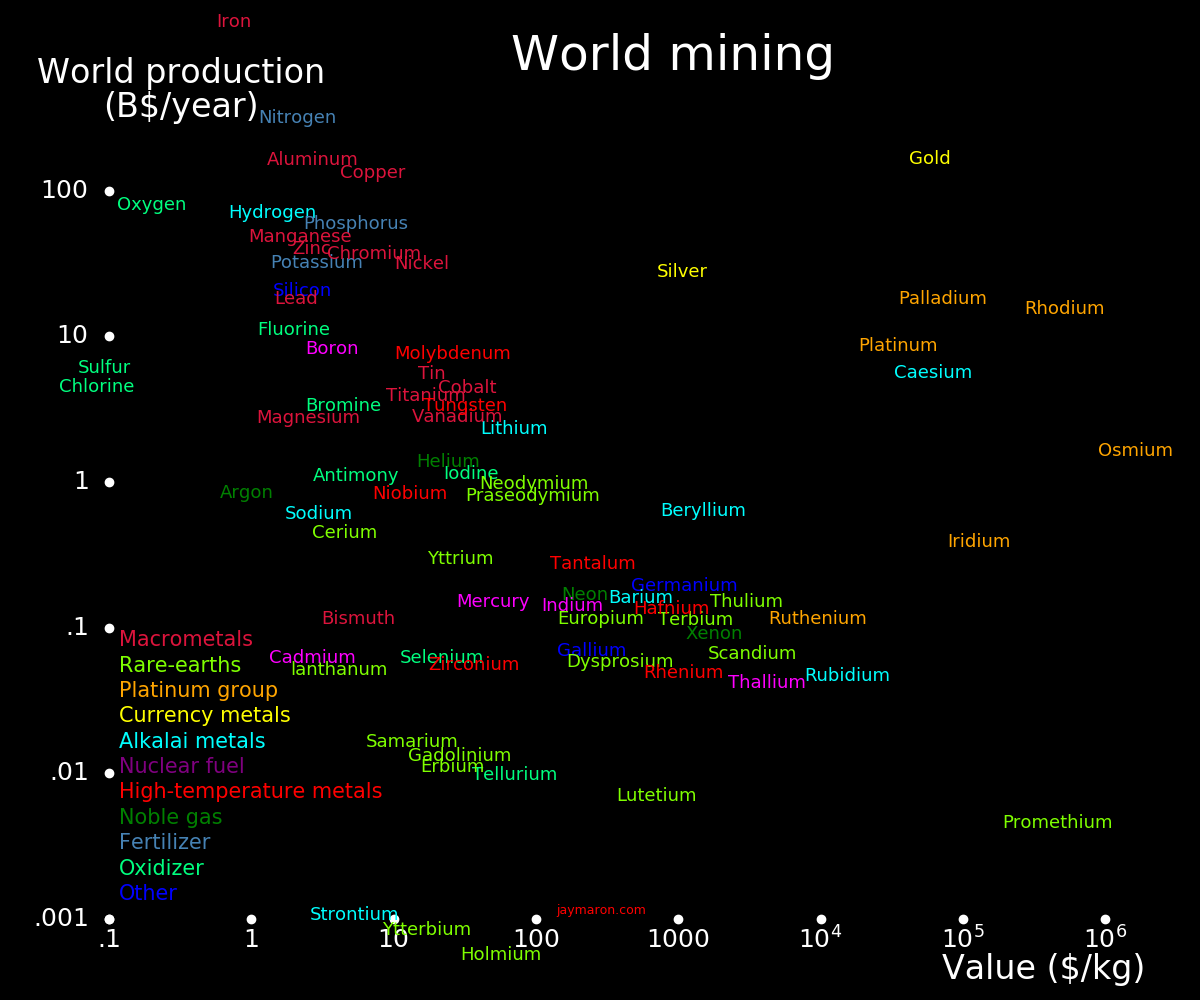
The following plot shows world production for each element. Endangered elements tend to be near the bottom.
 |
|---|
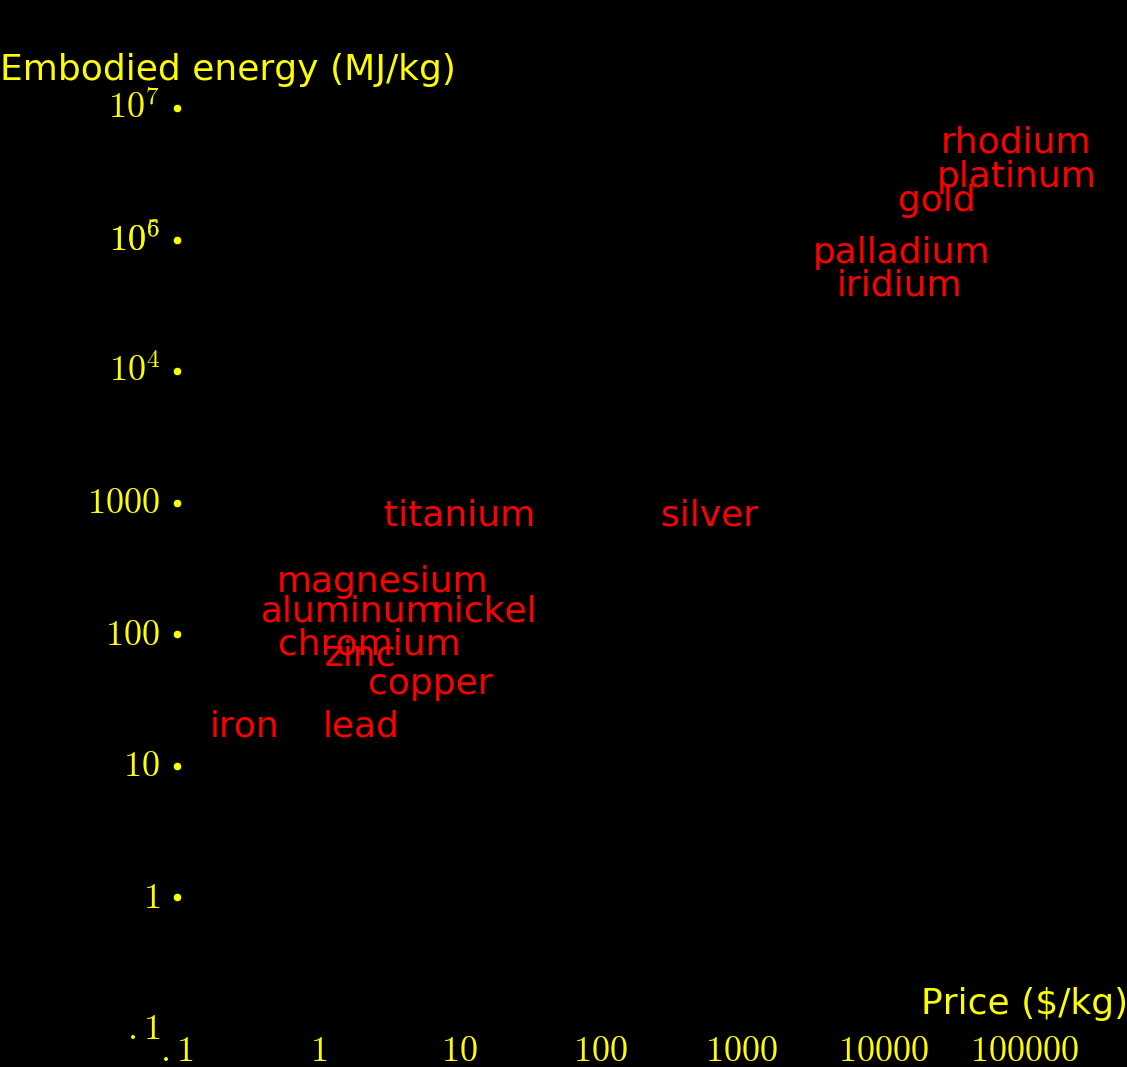
The embodied energy of an element is the energy required to extract the element from ore, in Joules/kg. Most of the price of elements is from energy. For steel, the energy comes from coal smelting and for most of the other elements the energy comes from electricity.
 |
|---|
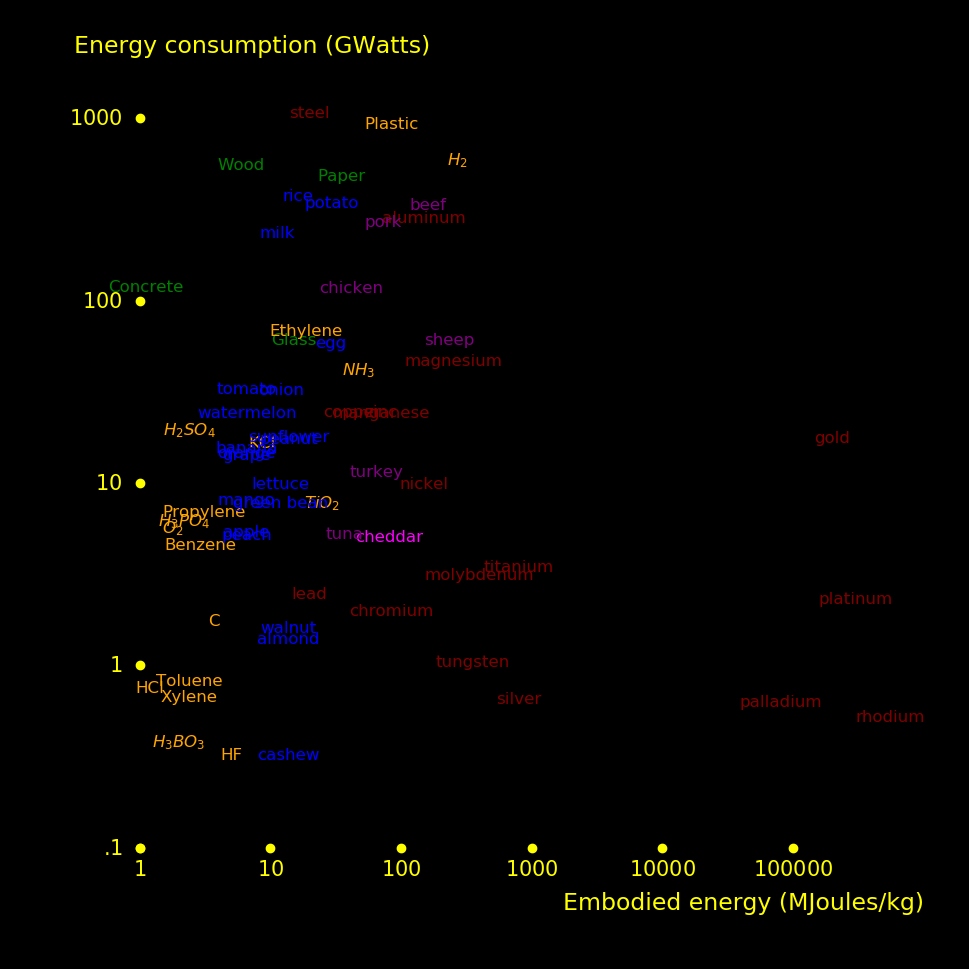
Energy is used in every stage of industry. It's used in the production of primary materials, such as elements, chemicals, plastics, and lumber. It's used again to manufacture things with the primary materials.
The plot shows how much energy the world expends per year for primary materials.
 |
|---|
 |
 |
|---|---|
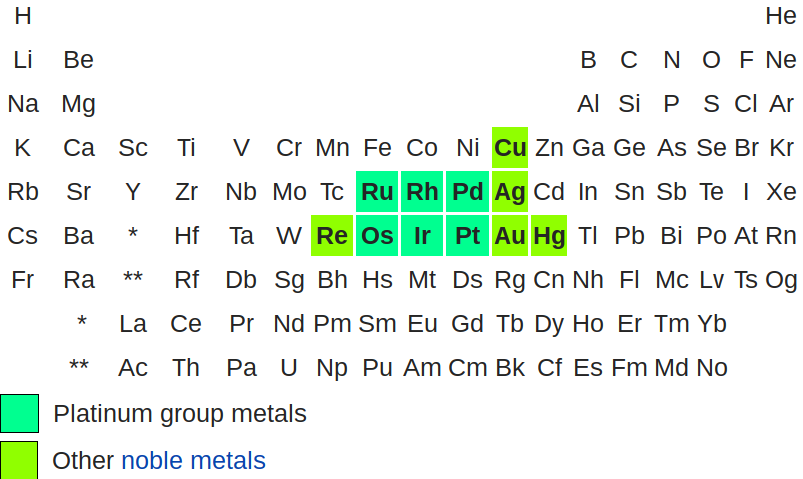
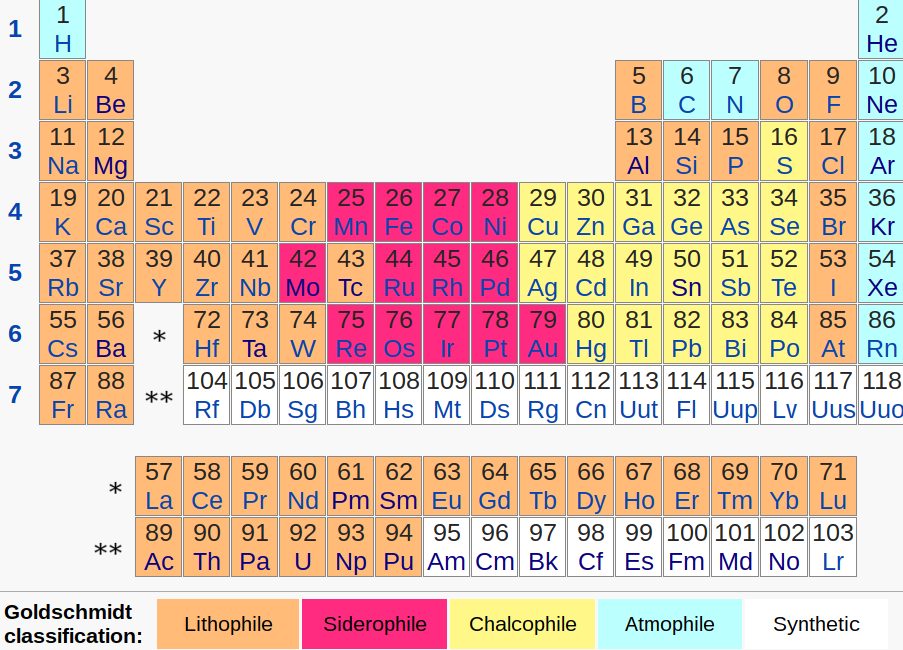
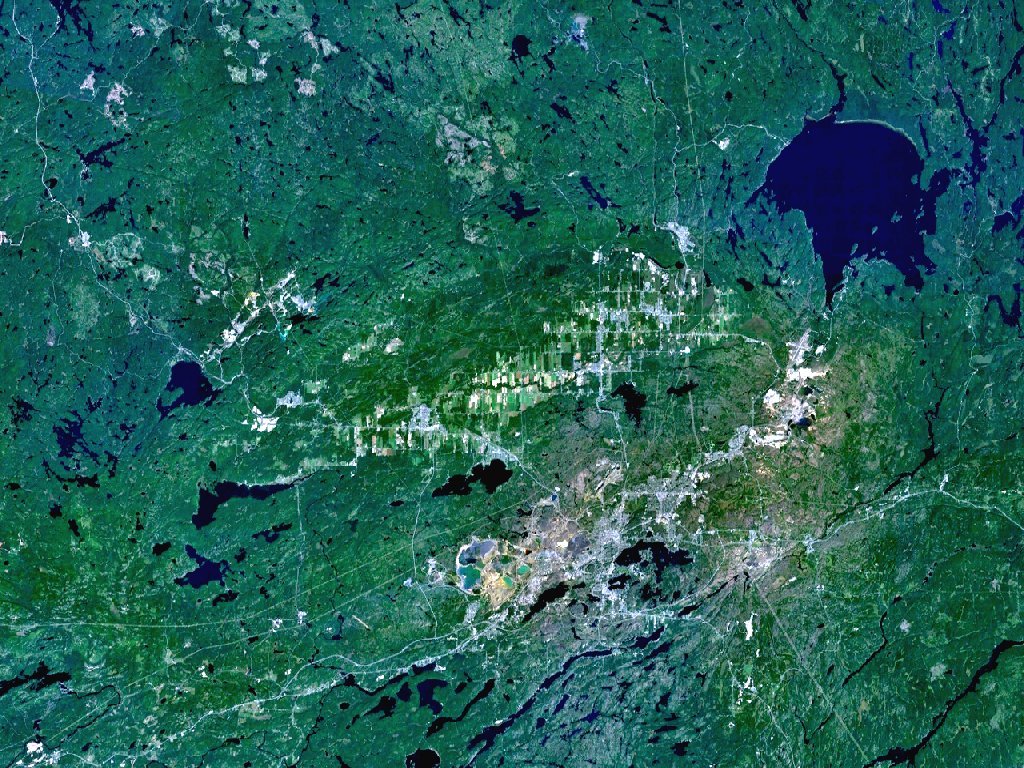
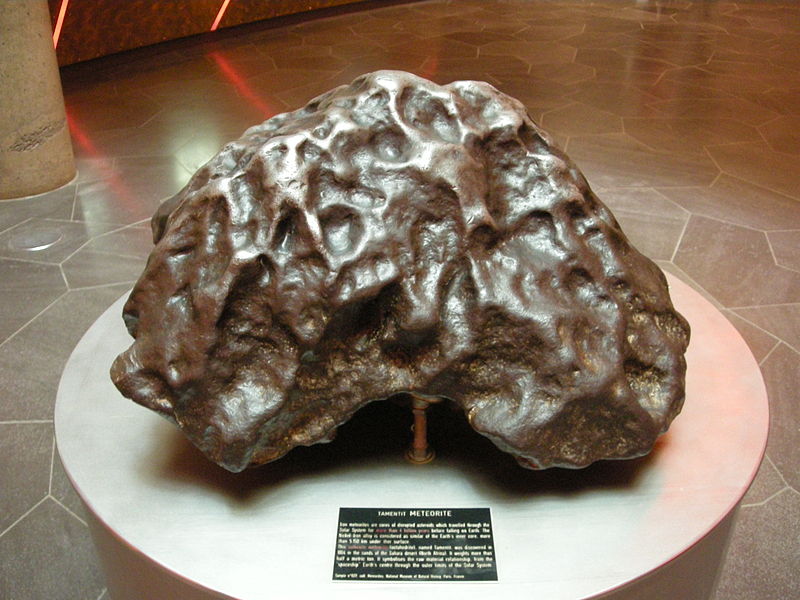
Platinum group metals are rare because they are dense and they tend to sink to the Earth's core. They are mostly mined from metal asteroid craters such as the Sudbury crater in Canada and the Vrodefort Crater in South Africa. Metallic asteroids are rich in platinum group elements because they used to be part of the core of a planet.
Siderophile:  Iron-living. Tends to sink to the core along with the iron.
Lithophile:   Rock-loving. Tends to become included in rock and escapes sinking
              to the core.
Chalcophile:  Ore-loving. Tends to combine with oxygen and sulfur and escapes sinking
              to the core.
Atmophile:    Is a gas at room temperature and tends to escape the crust into the
              atmosphere.
 |
|---|
 |
|---|
 |
 |
|---|---|
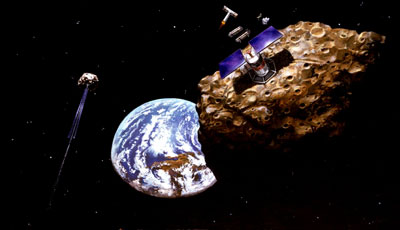
A 300 meter metallic asteroid has 30 billion dollars of platinum group elements, equal to world annual production.
-178918.jpg) |
 |
 |
 |
|---|---|---|---|
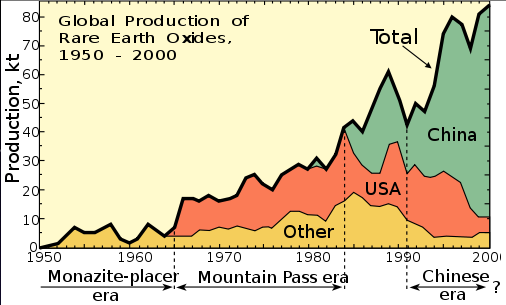
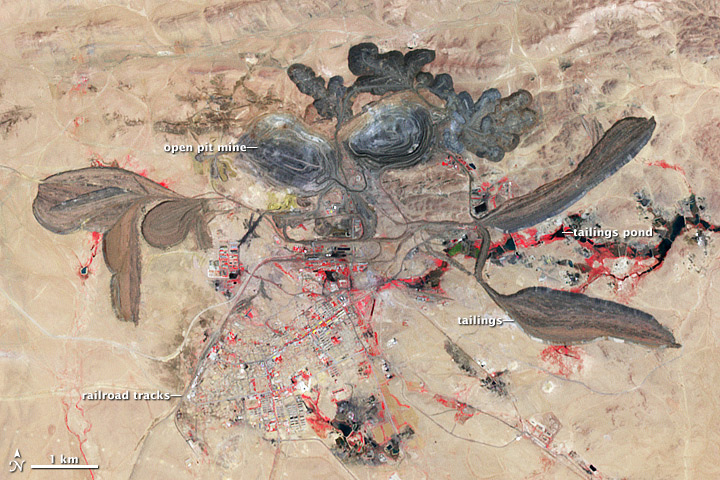
The rare Earth elements are the ones in the row from Lanthanum to Lutetium and they tend to occur together in minerals. They are vital to electronics and 95% of the world's supply comes from the Bayan Obo deposit in China. Uranium and thorium are often found in rare Earth ore.
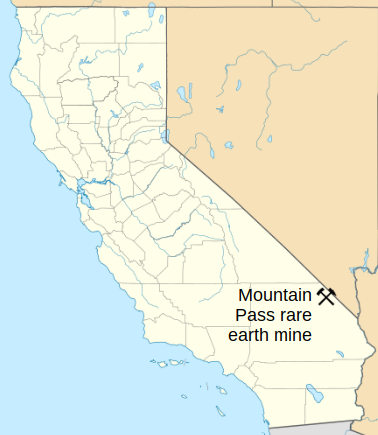
The Californa Mountain Pass mine closed in 2002. In 2010 China restricted rare Earth exports, prompting subsidies from the U.S. Government to reopen the mine. Mining resumed in 2015 and then ceased in 2016 when the mining corporation went bankrupt.
 |
|---|
 |
 |
 |
 |
|---|---|---|---|
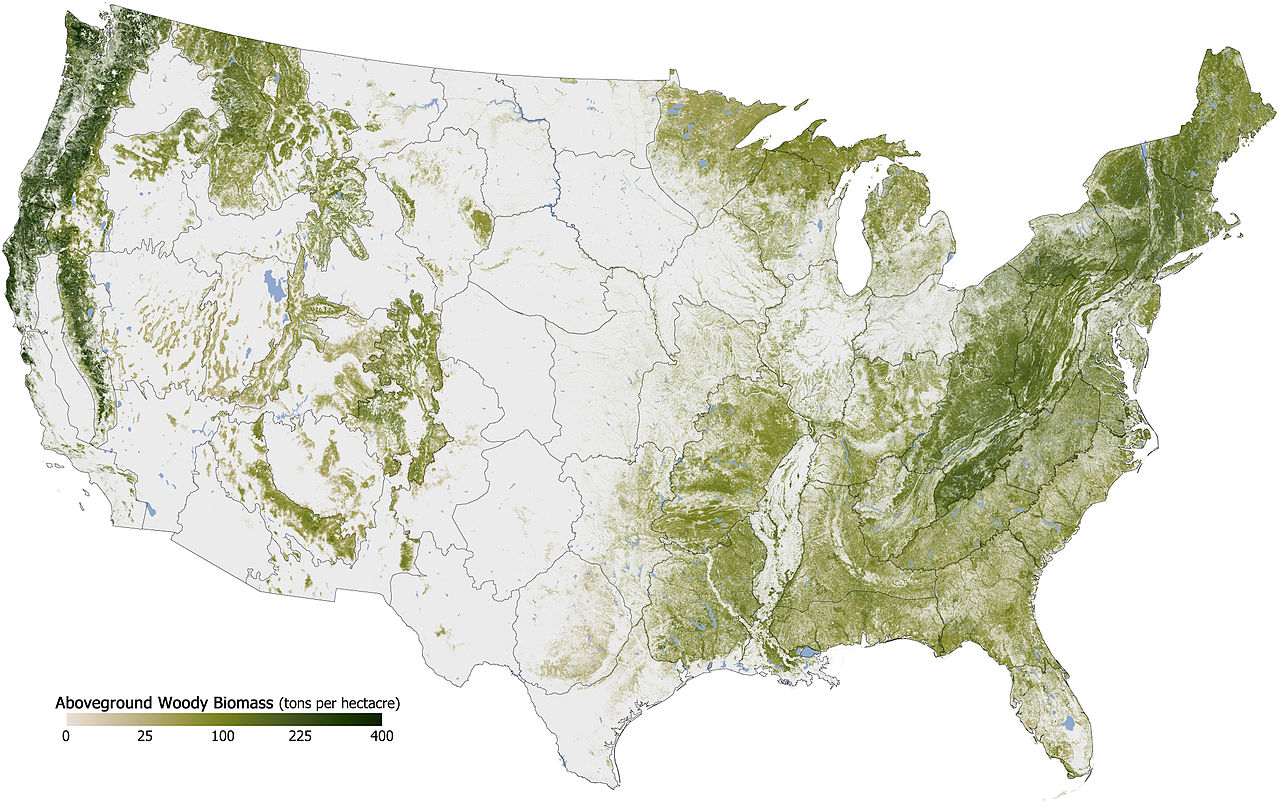
The atmospheric carbon increase of 4000 billion kg/year can be offset by planting 4 million km2 of trees. The fertilizer requirement is 340 billion $/year, and the value of the wood produced is substantially greater.
The amount of forest needed is:
Atmospheric carbon increase     = C        = 4000  billion kg/year
Forest carbon capture rate      = R        =  1.0  carbon kg/meter2/year
Forest needed to offset carbon  = A = C/R  =    4  million km2
The value of wood produced is:
Wood commodity price            = w        =   .3  $/kg
Wood carbon mass fraction       = c        =   .5
Value of wood produced          = W = Cw/c = 2400  billion $/year
The cost for nitrogen fertilizer is:
Wood nitrogen mass fraction     = n        =   .01
Nitrogen requiremnet            = N = Cn/c =    80  billion kg/year
Price of nitrogen in fertilizer = p        =   2.1  $/kg
Total nitrogen price            = P = p N  =   170  billion $/year
Trees also need potassium, phosphorus, calcium, magnesium, and sulfur, and their total cost is similar to that of the nitrogen. The total fertilizer cost is double the nitrogen cost, or 340 billion $/year.
Trees should be planted close to water. For existing trees, fertilizer should go to large trees that are close to water.
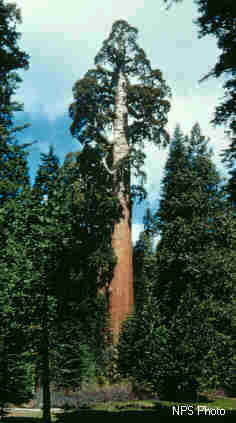
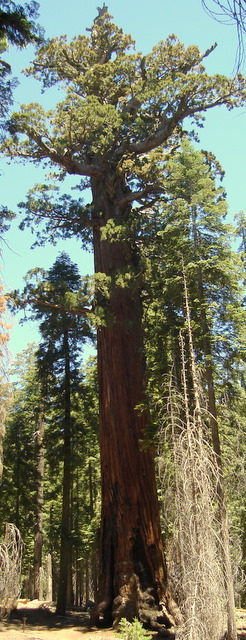
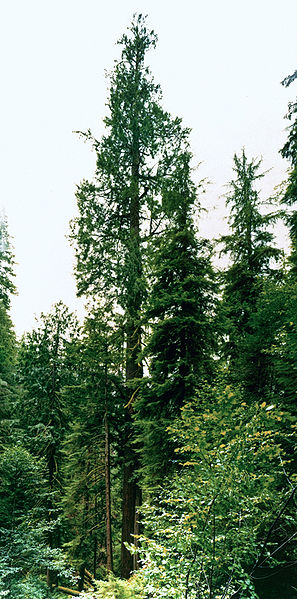
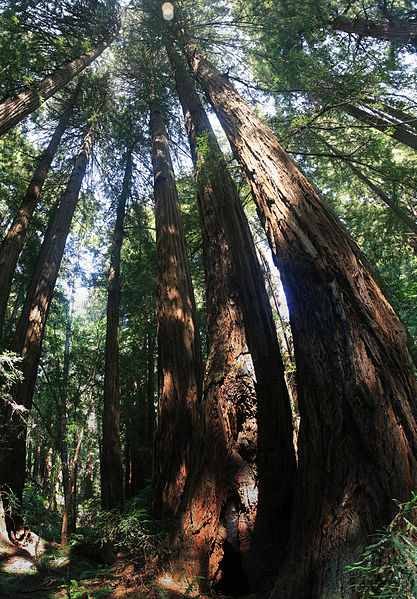
For new trees, chose trees that will become tall and wide. The largest trees are sequoias, redwoods, douglas firs, and eucalyptus. The fastest growing tree is bamboo, which produces 1 carbon kg/meter2/year.
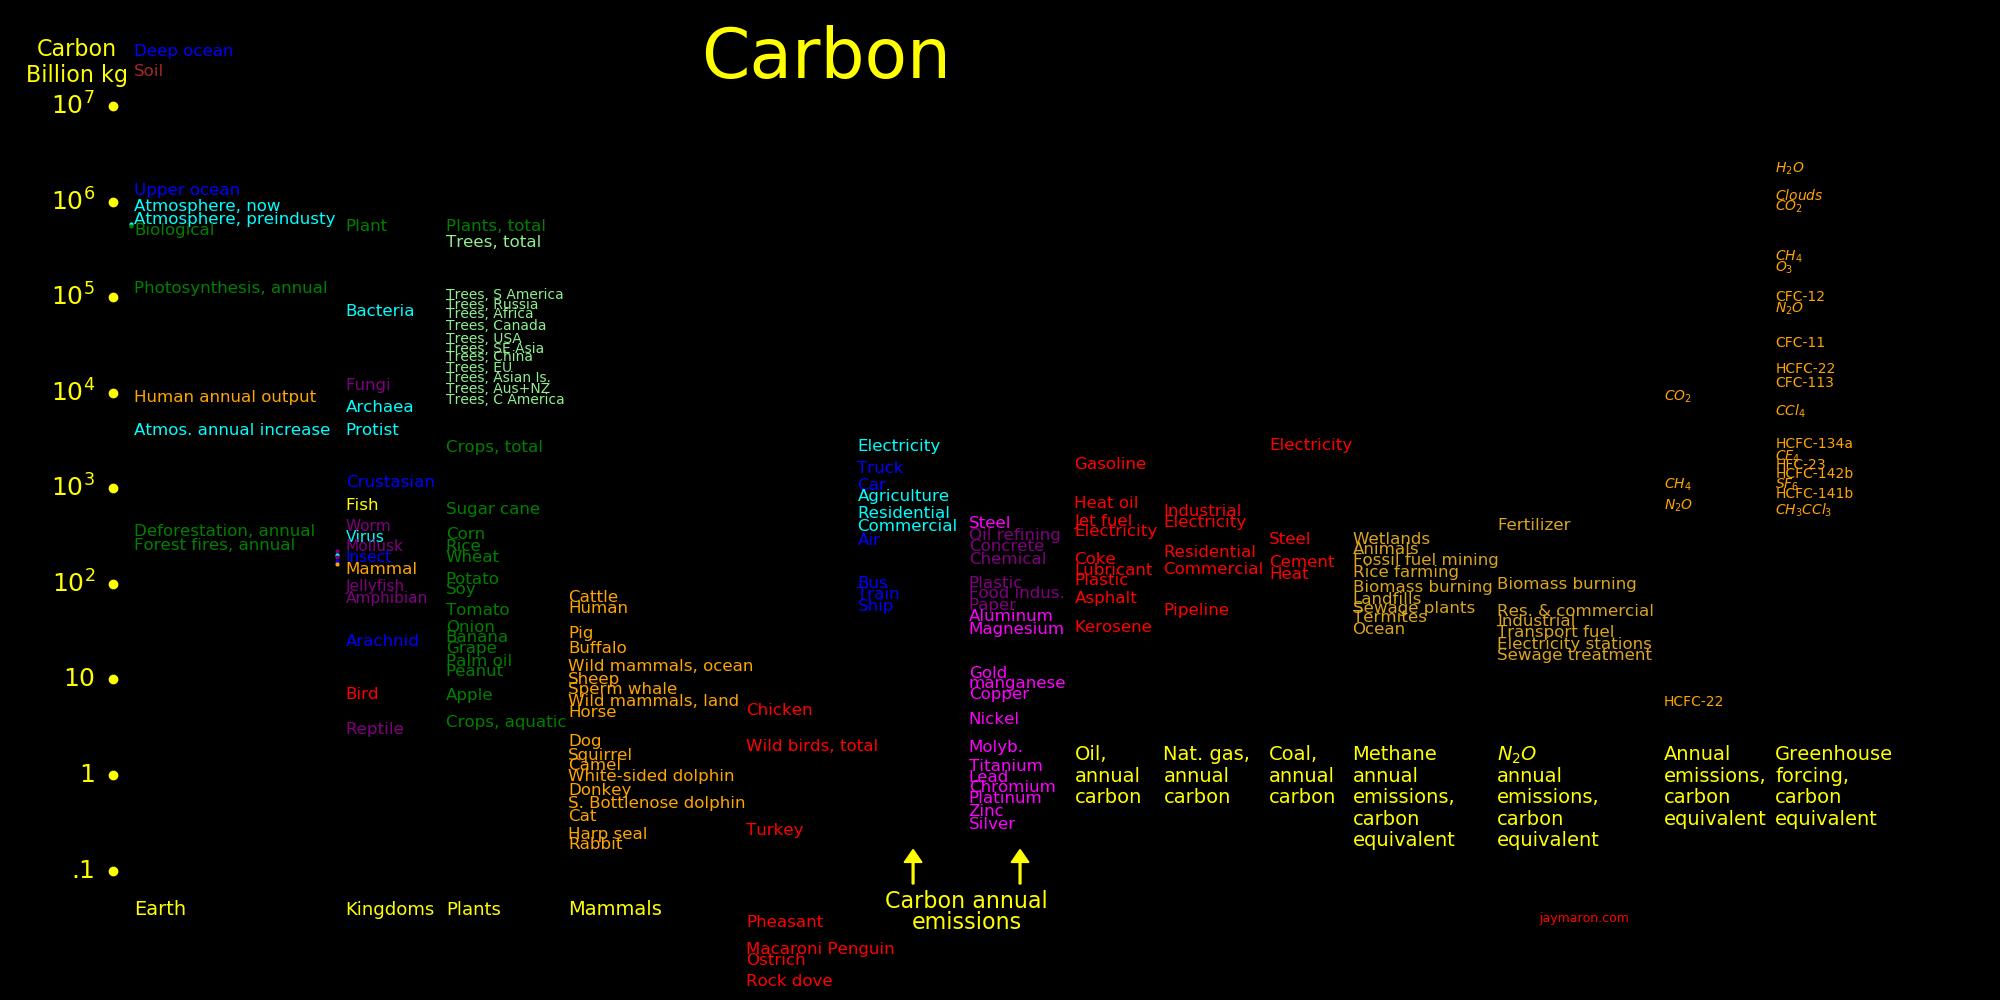
World forest carbon:
Carbon in atmosphere         = 880  trillion kg
Carbon in plants             = 550  trillion kg
Carbon in trees              = 500  trillion kg
Total human-generated carbon = 300  trillion kg
Carbon from deforestation    =  36  trillion kg

Atmosphere carbon increase   =   4  trillion kg/year
Forest carbon capture rate   =  45  trillion kg/year
World forests
Deforestation rate           = .35  trillion kg/year
Carbon from forest fires     = .25  trillion kg/year
World forest area            =  39  million km2
Forest wood density          =  11  kg/meter2

Total wood carbon harvested  =4.56  trillion kg/year     Wood for power + wood for industry
Wood carbon for biomass power=1.59  trillion kg/year
Wood carbon for industry     =2.97  trillion kg/year
 |
|---|
Data: Insurance Information Institute, averaged over 2014-2018.
 |
|---|
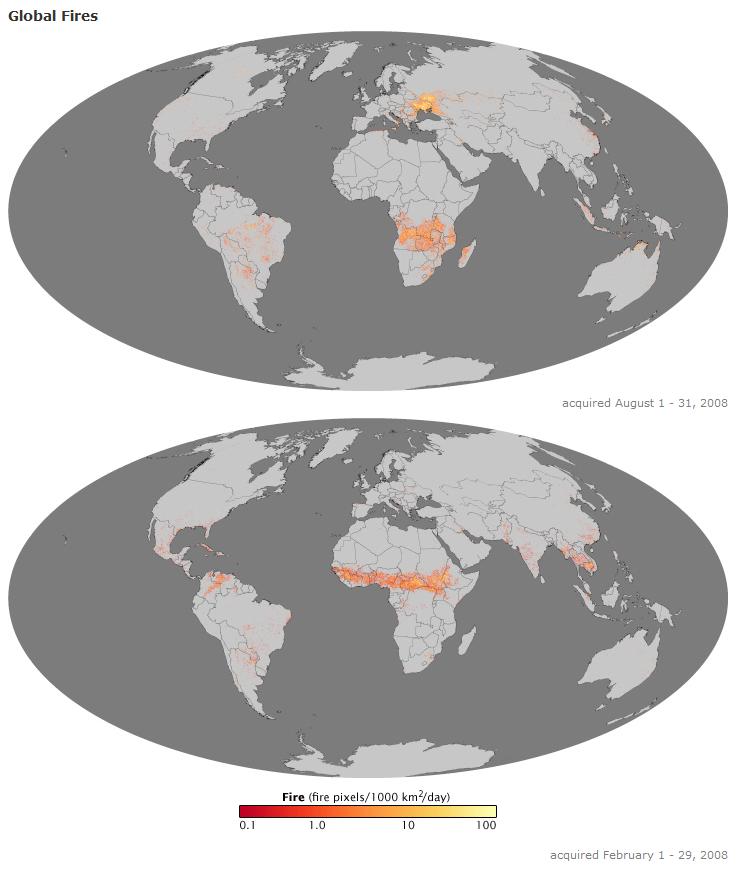 |
|---|
          World fraction  Forest  Deforestation  Fires
                %          Bkg       Bkg/yr      Bkg/yr

South America   22        96000        400         50
Russia          21        92000          ?        100
Africa          17        73000        240         50
Canada          12.6      55000          0         50
USA              7.9      34800          0         15
S.E. Asia        5.9      26000       -120         10
China            5.3      23300       -170         20
E.U.             4.1      18000        -40          3
Asian Islands    3.6      15800         30         10
Australia + NZ   3.2      14100          ?         20
C. America       2.7      11900         60          5

World            1000    440000        350        250
Masses are for carbon. Data: globalfiredata.org
 |
|---|
Animals are 1/6 carbon and trees are 1/2 carbon.
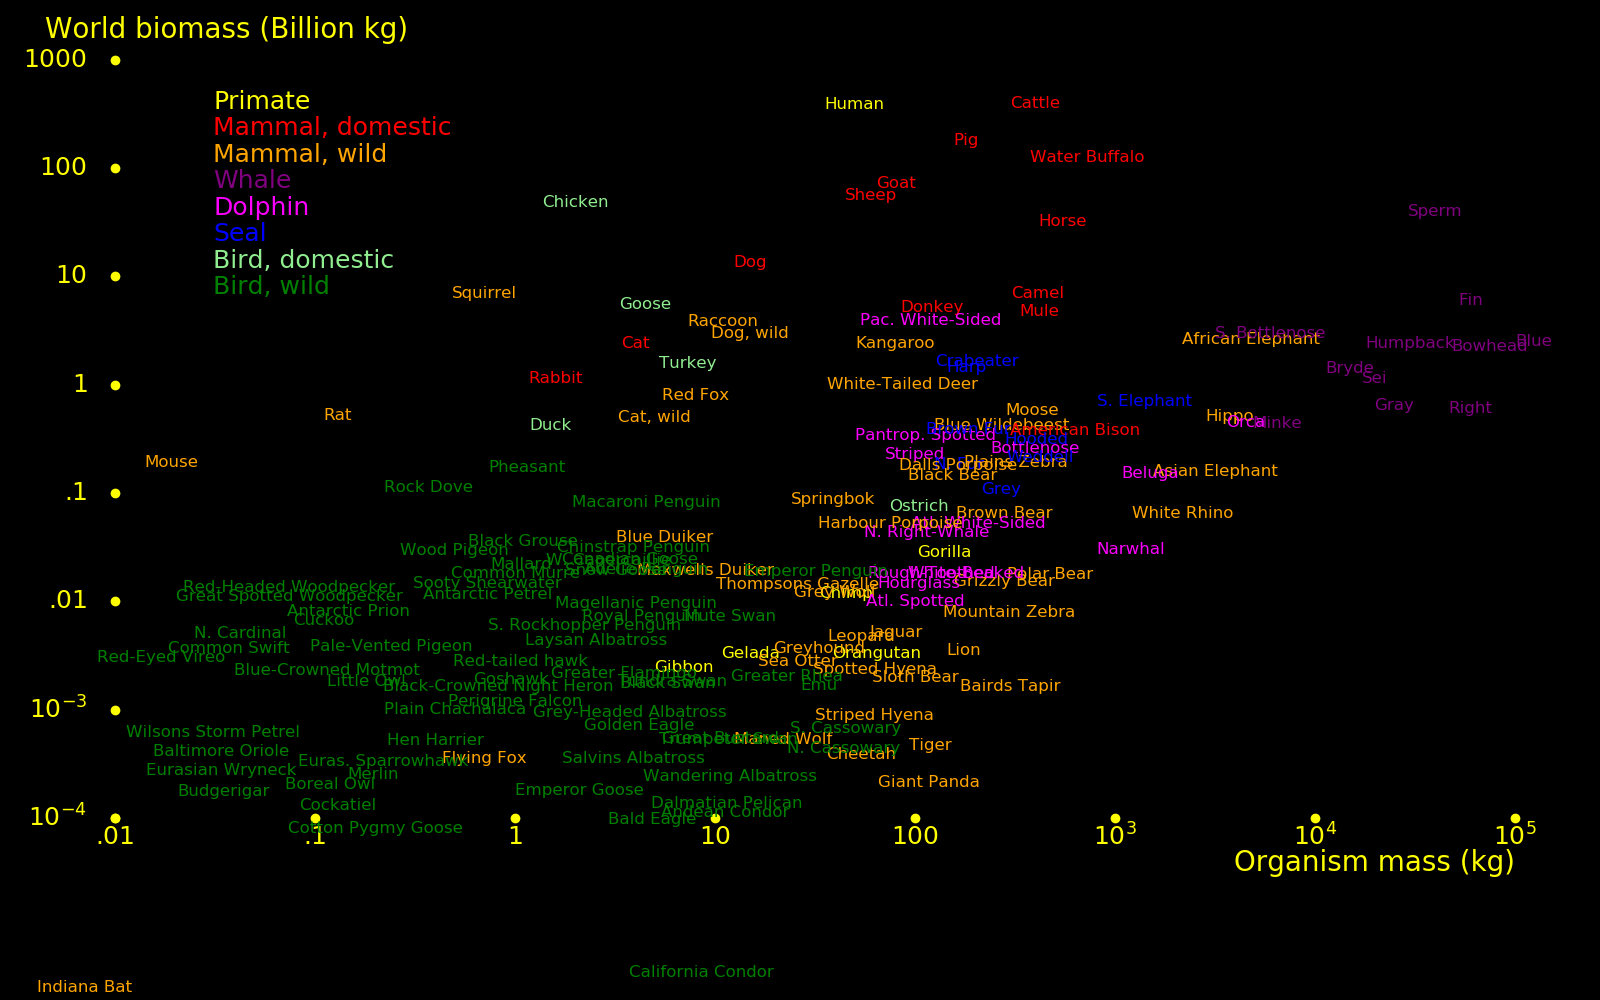 |
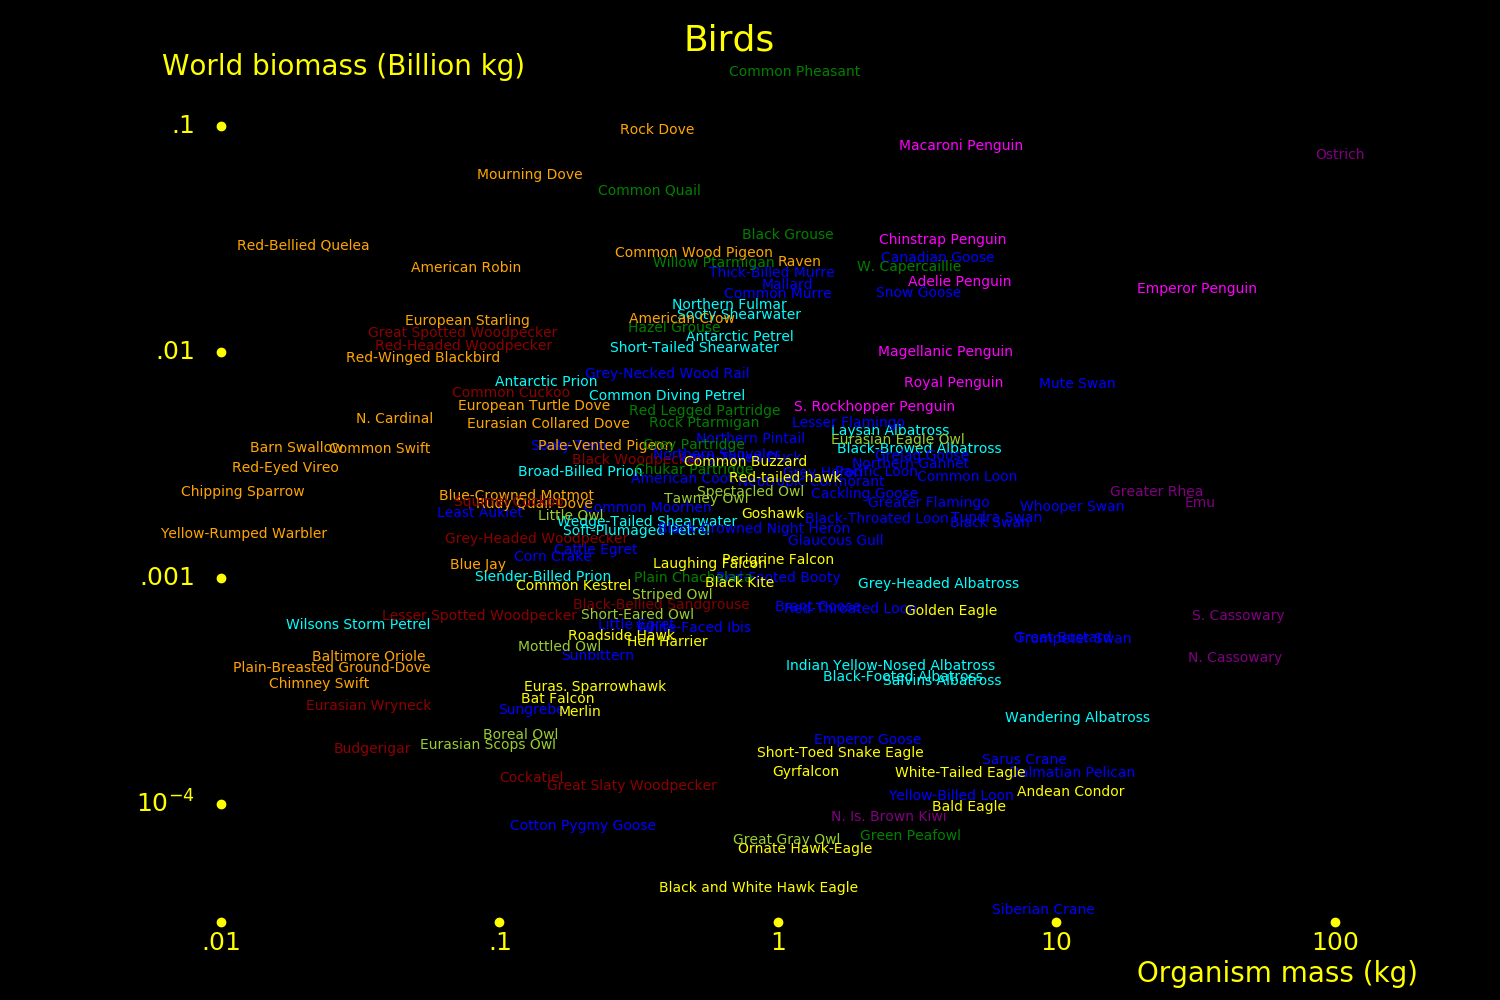
|---|
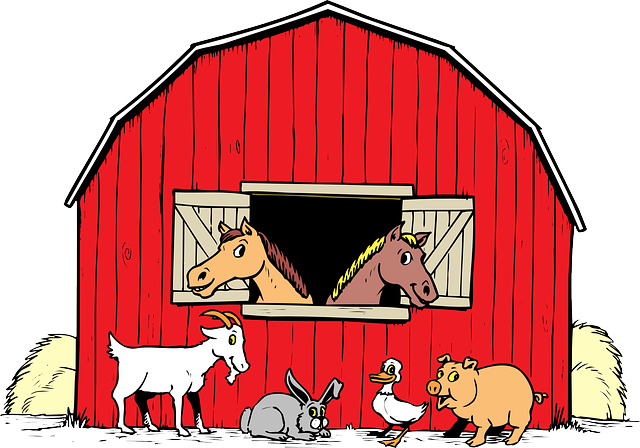
For mammals and birds, domestic biomass far exceeds wild biomass.
 |
|---|
 |
|---|
Primary energy for manufacturing is dominated by steel, concrete, hydrogen, and plastic.
|
|---|
 |
|---|
   Year

 -11000     Livestock
  -9500     Crops
  -6000     Crop rotation. 2-field system
  -4000     Ox power
  -3500     Horse
      0     Trade network
    900     3-field system
   1492     Columbian exchange. Guano fertilizer introduced
   1700     4-field system. Nitrogen-fixing plants
   1800     Fertilizer becomes widespread
   1850     Mechanization
   1895     Refrigeration
   1950     Pesticides
   1980     Genetic engineering
English wheat yield:
Year    Wheat yield (kg/hectare/year)

1500       .018
1550       .022
1600       .029
1650       .031
1700       .038
1750       .047
1800       .063
1850       .073
2020       .8
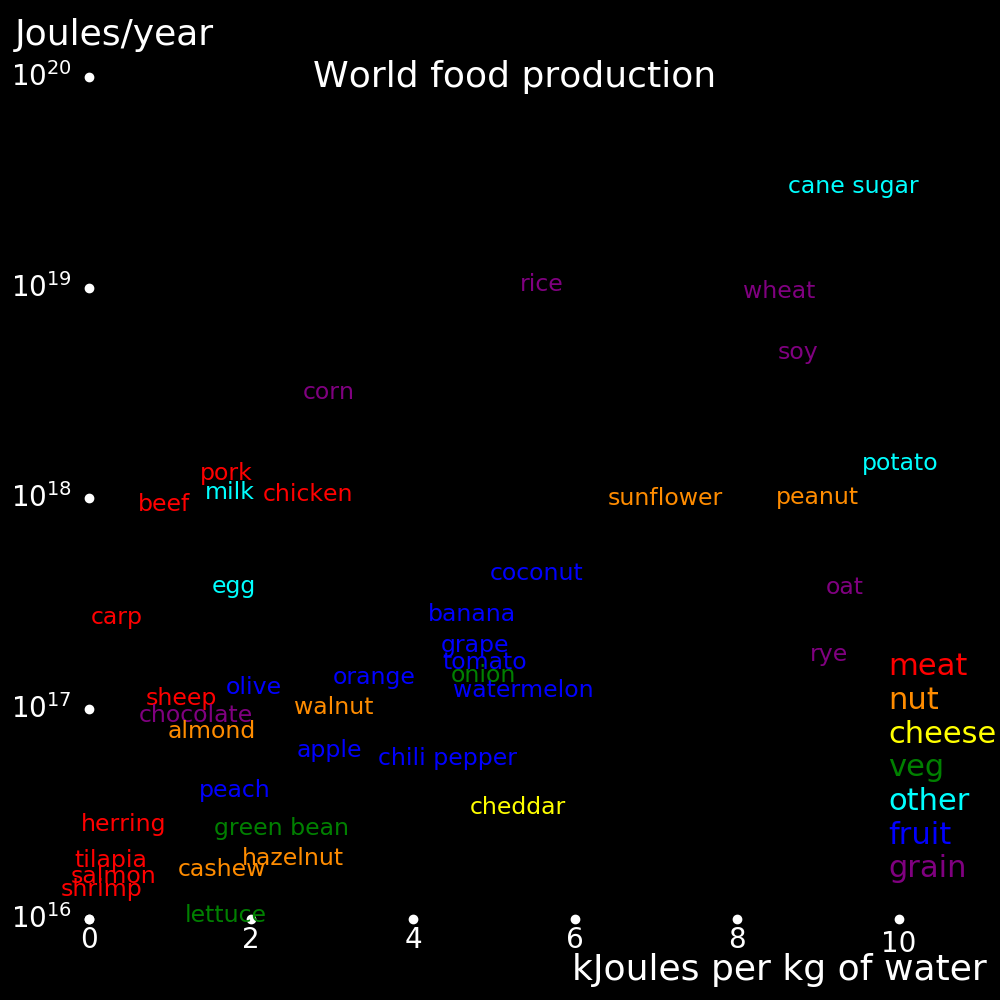
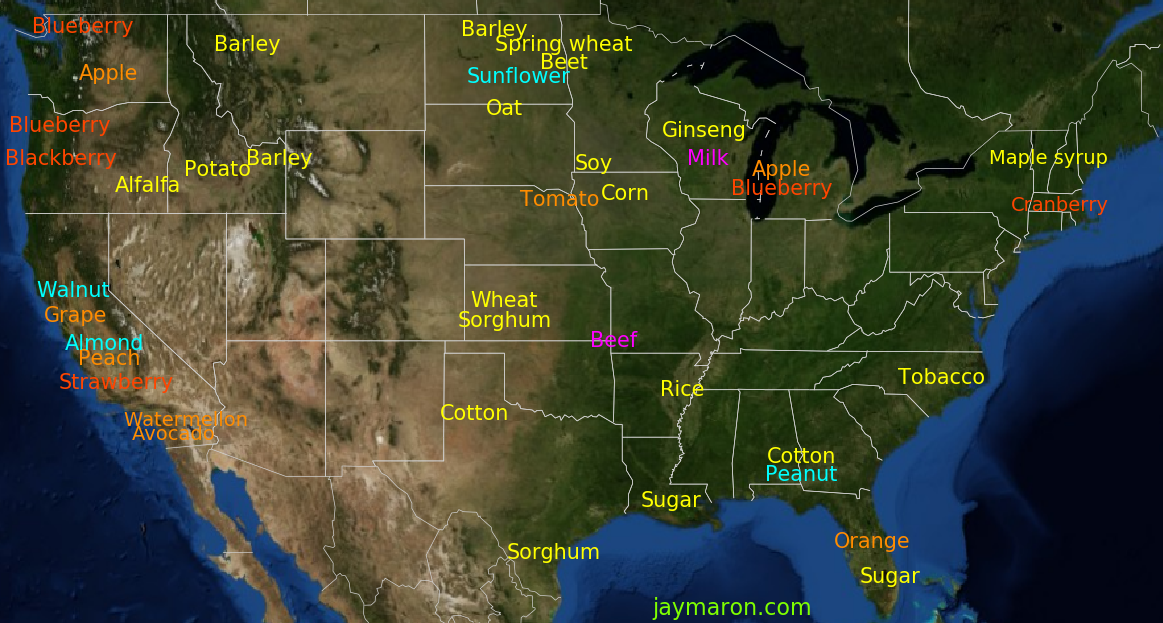
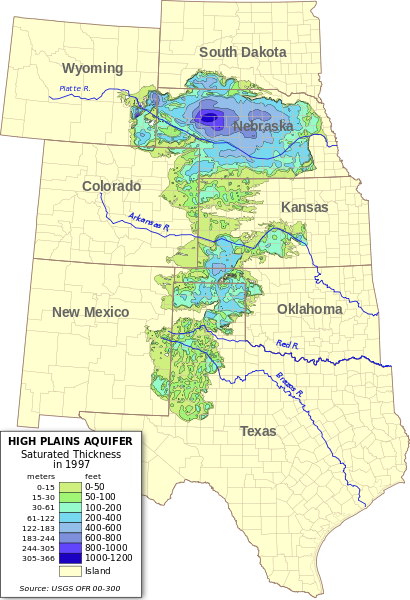
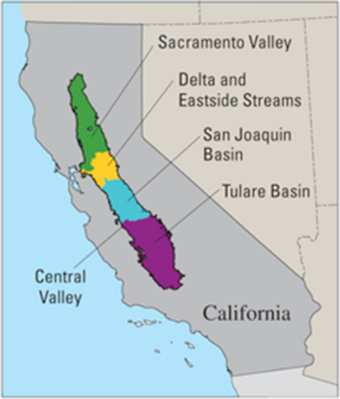
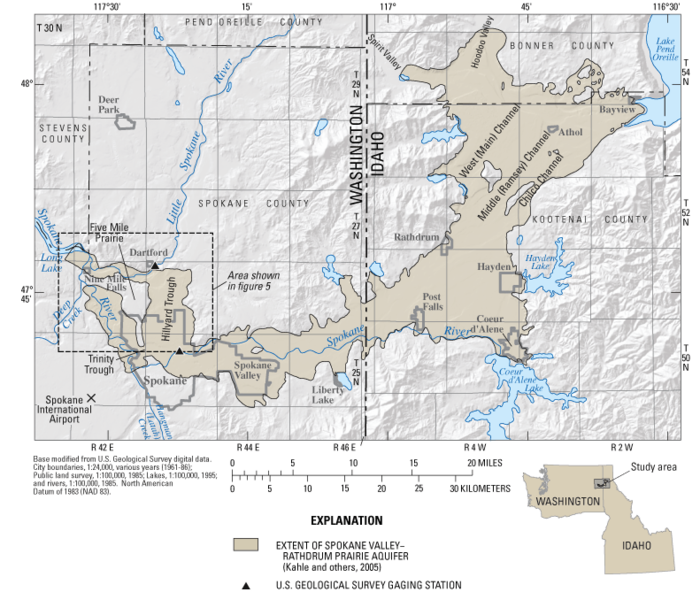
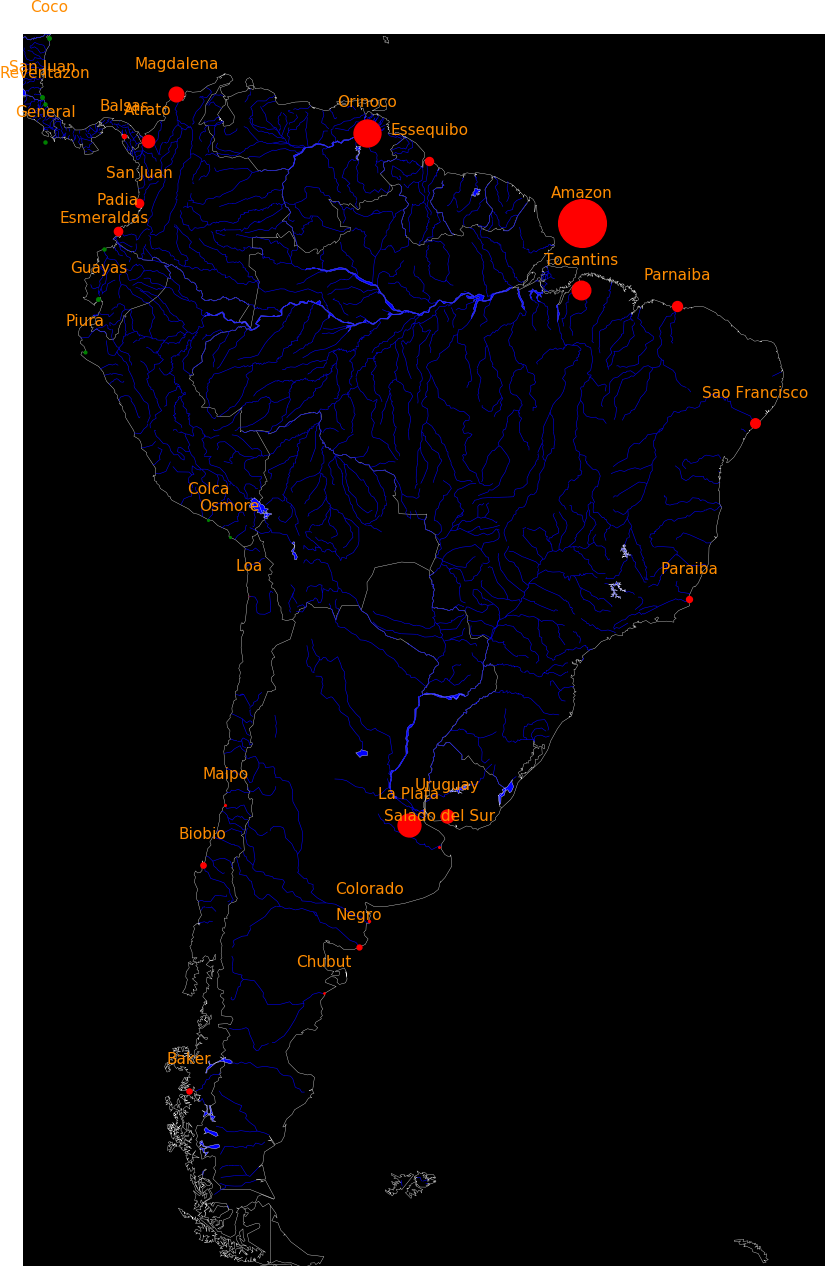
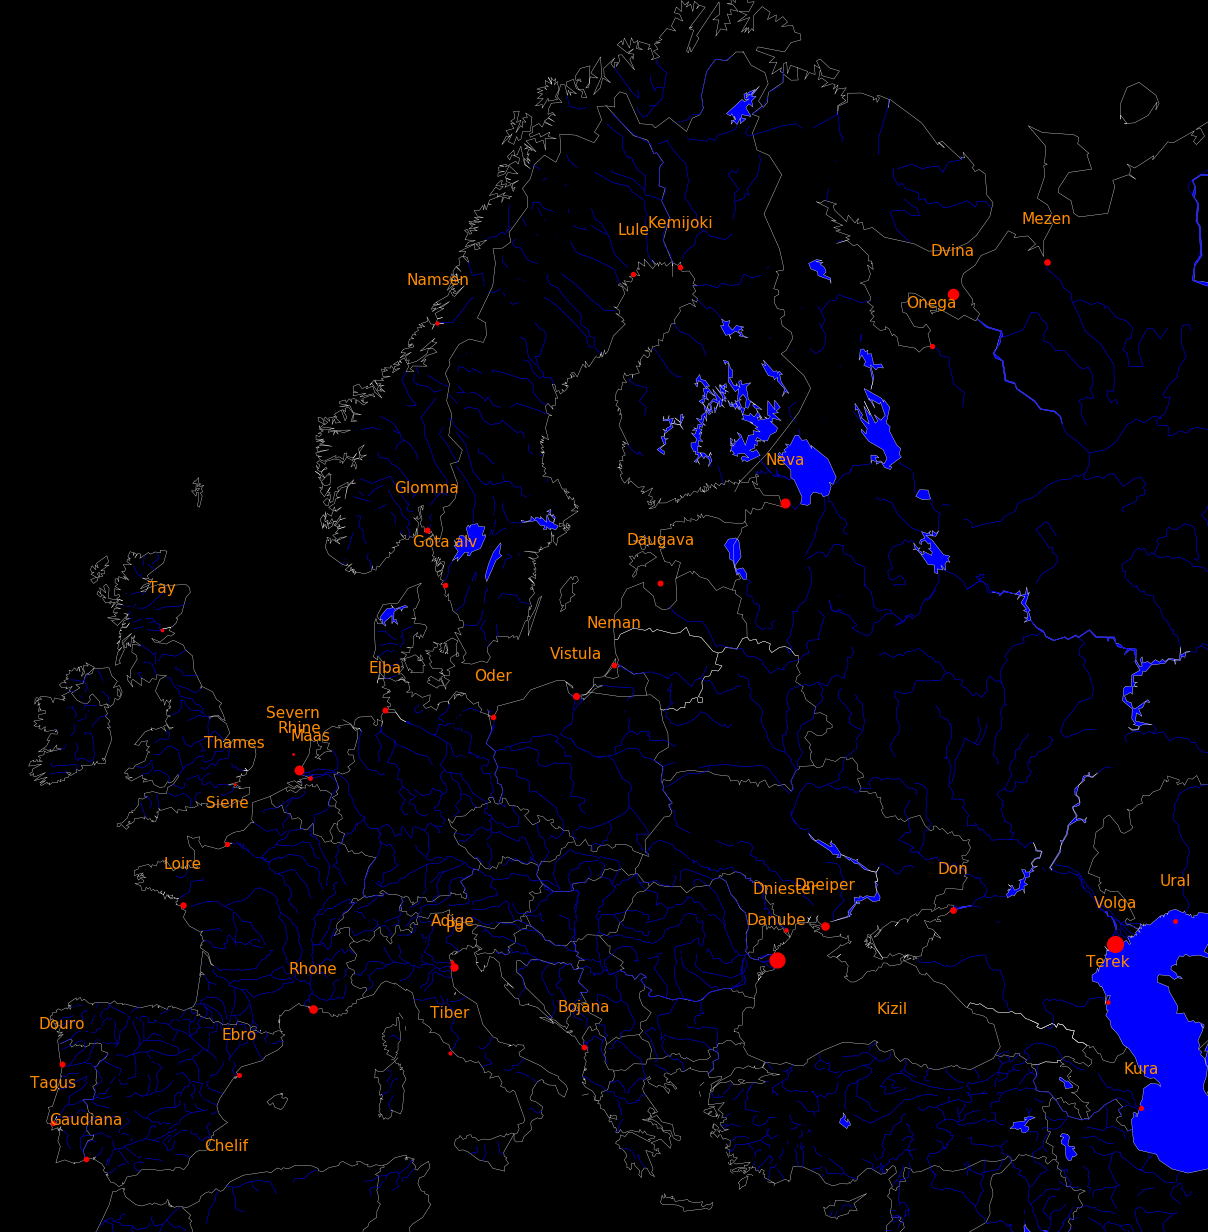
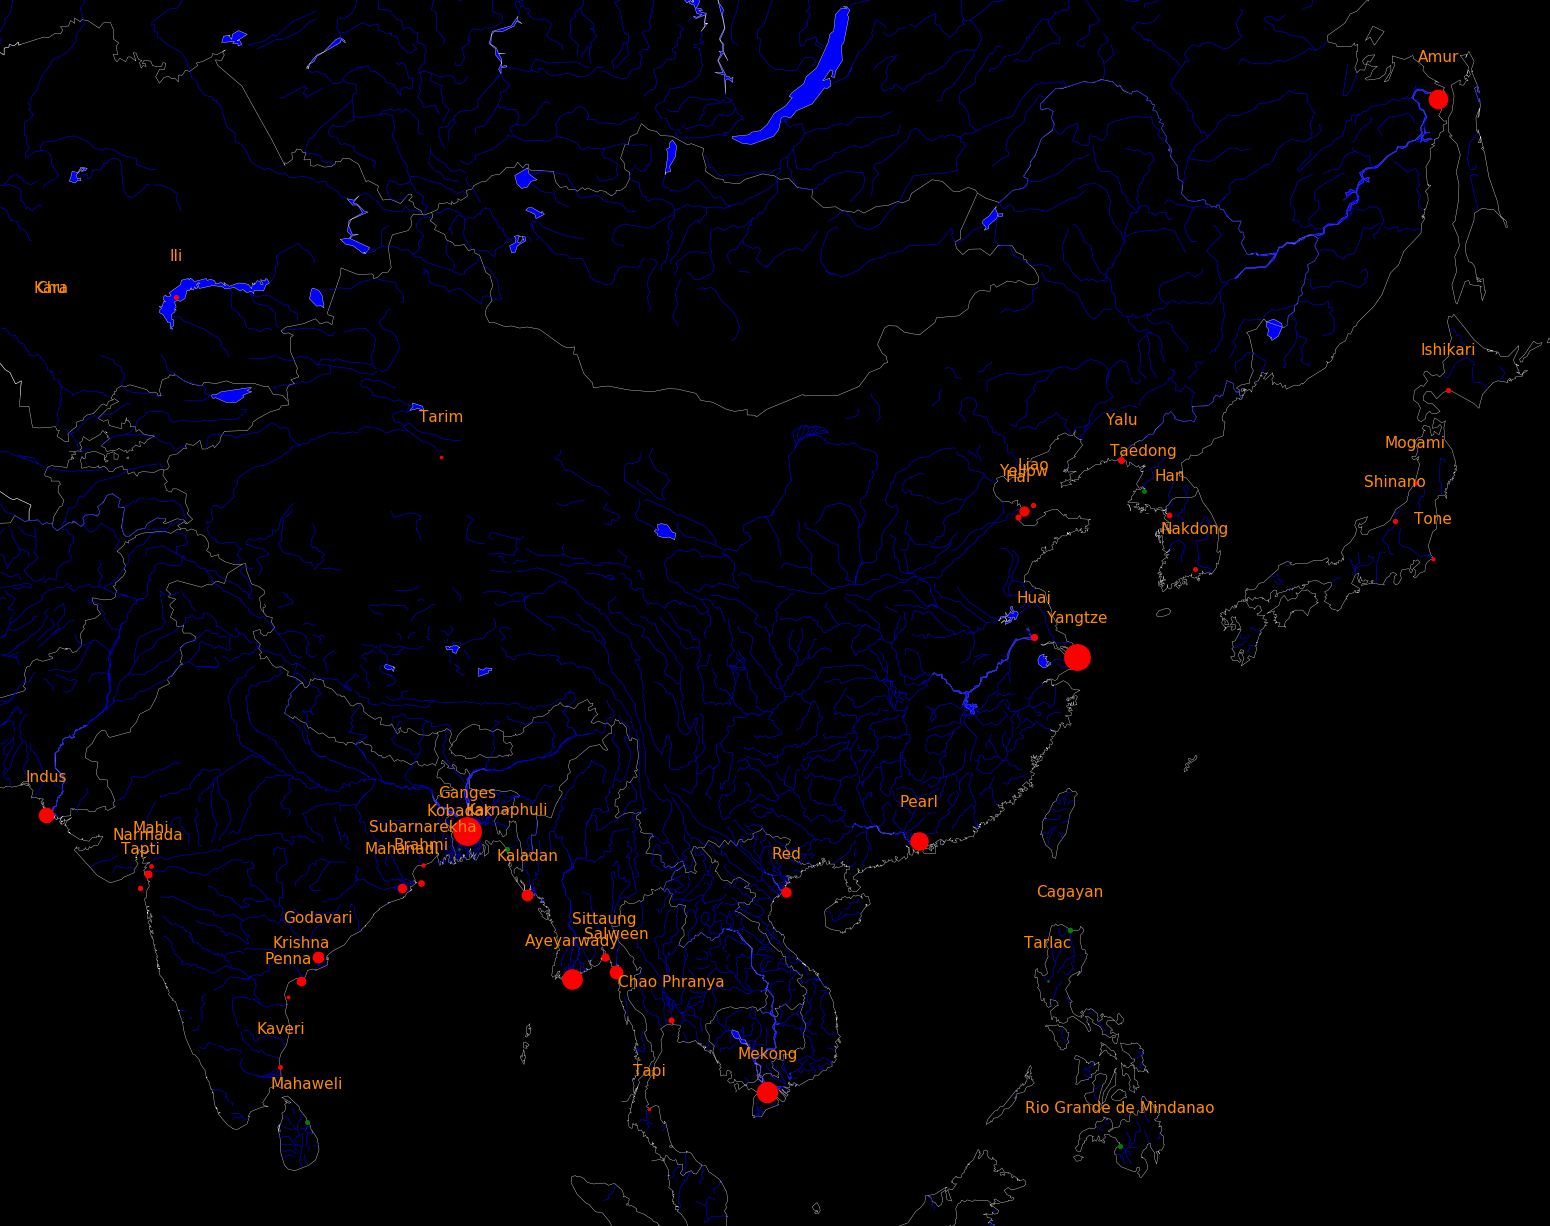
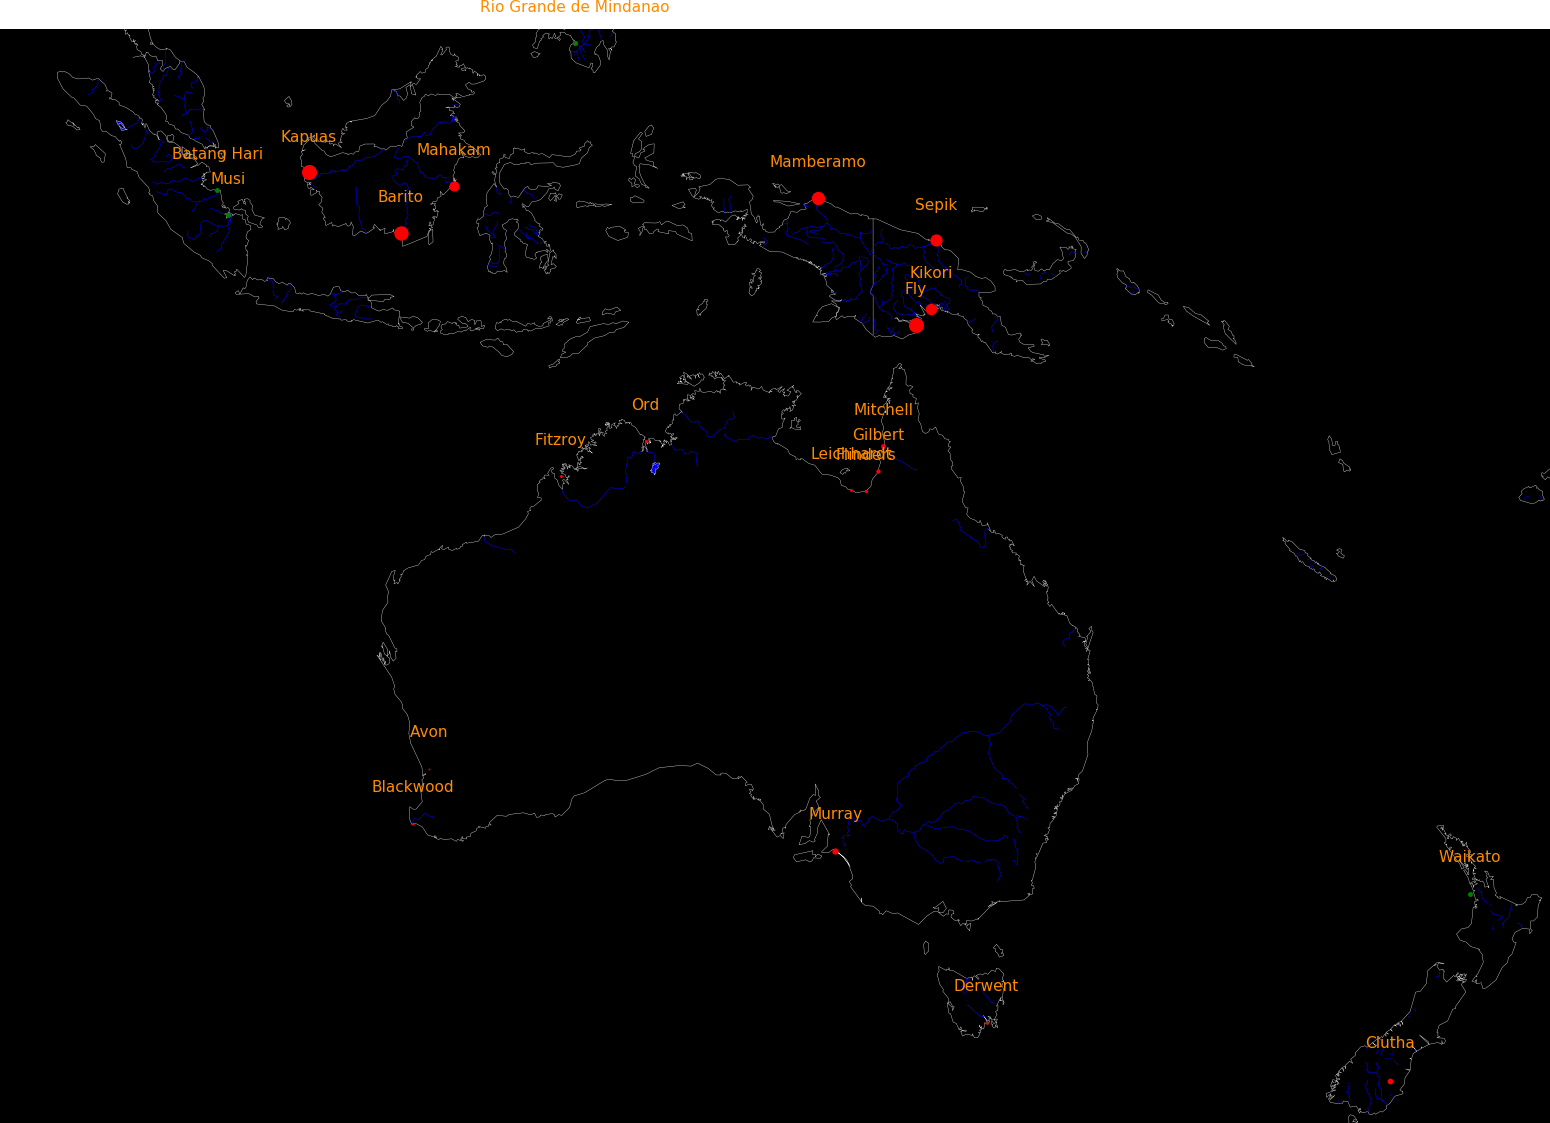
Crop locations are decided by rain, rivers, lakes, reservoirs, aquifers, and aqueducts. Prime farmland is for crops and subprime land is for grazing. There is 2.2 times as much grazing land as cropland, and agriculture is 38% of world land.
The plot shows the center of mass for crops.
 |
|---|
 |
 |
 |
 |
|---|---|---|---|
Land can support more people with wheat than with beef, by a factor of 16. Sugar cane is more efficient than wheat by a factor of 16.
Farm productivity is expressed as kg/meter2/year of food. If we factor in the calorie content of the food, we can express this as food production power in Watts/meter2. The value for wheat is 16 times larger than for beef.
The table shows the production power for various foods, with a comparison to solar cells and wind turbines.
              Production   Energy/Mass    Power    Type of energy
             kg/meter2/yr   MJoule/kg  Watt/meter2

Solar cell           -         -        40         Electricity
Wind turbine         -         -        15         Electricity

Algae               10        16         5.1       Biomass
Bamboo               2        16         1.0       Biomass
Grass                1        16          .50      Biomass
Typical tree          .5      16          .25      Biomass

Sugar cane           8        16         4.1       Food
Wheat                 .5      14          .22      Food
Milk                  .6       2.1        .040     Food
Fish                  .1       9          .028     Food
Goose (grazing)       .1       9          .028     Food
Beef (grazing)        .05      9          .014     Food
Tomato               8        .8          .20      Food
Tomato, hydroponic 150        .8         3.8       Food
For most crops, 50% of the plant biomass is edible produce.
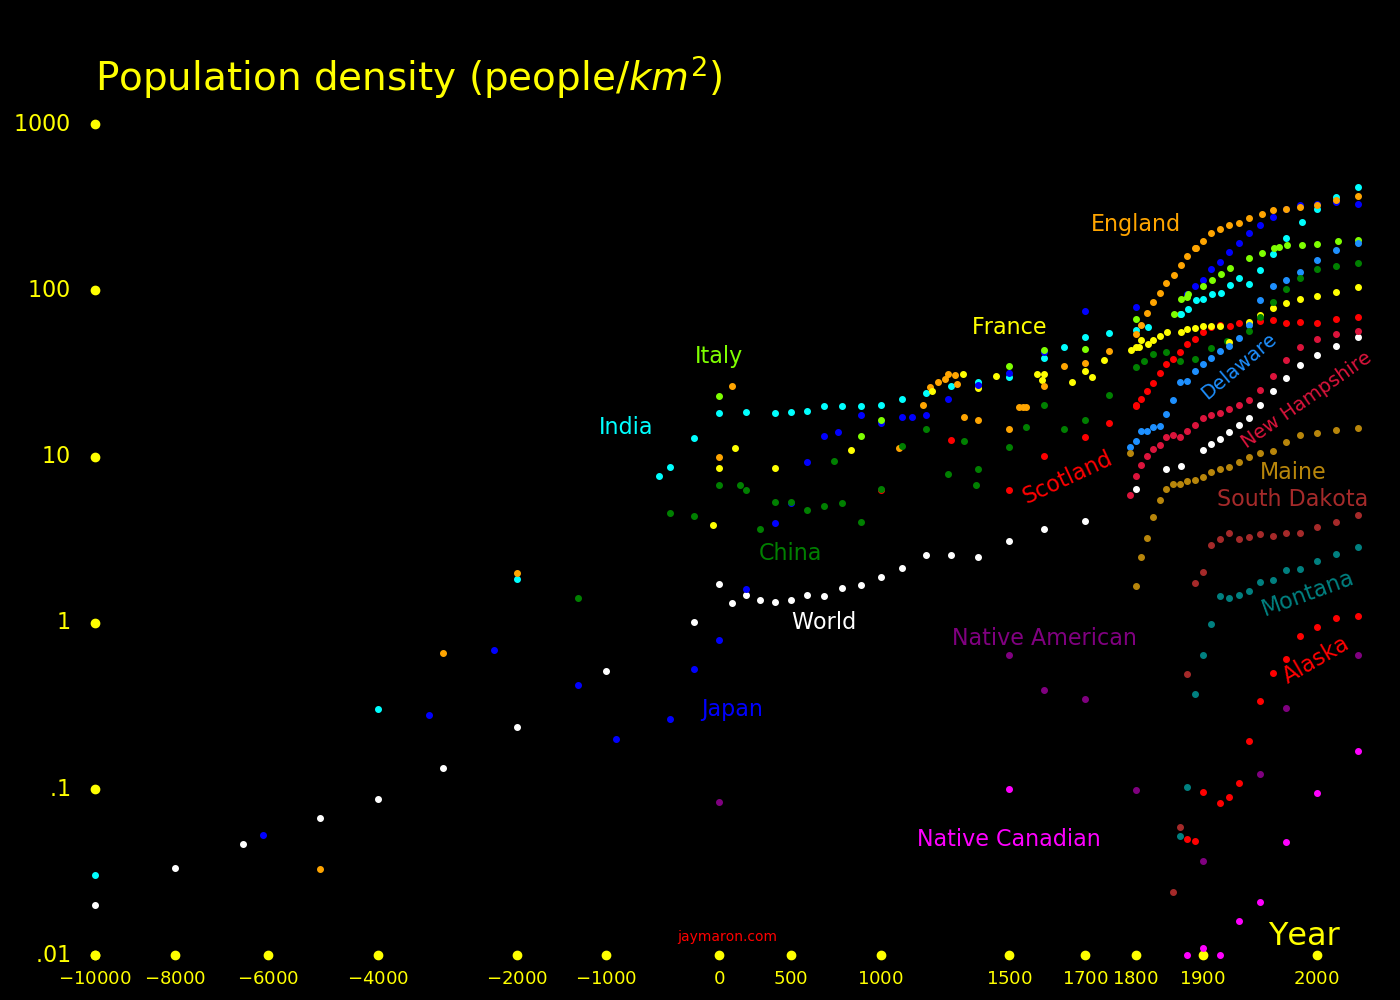
In 1850, a family of 4 could be supported by 40 acres, and this is the origin of the phrase "40 acres and a mule". This corresponds to 25 people/km2. At the time, world population was 8 people/km2 and today it's 50 people/km2.
It takes 120 Watts of food energy to support a human. If the calories come from cane sugar, then land can support 30000 people/km2.
Wild mammal biomass is 30 Bkg and human biomass is 360 Bkg.
 |
 |
|---|---|
Trillion $
World wealth total 400
World stock markets 80
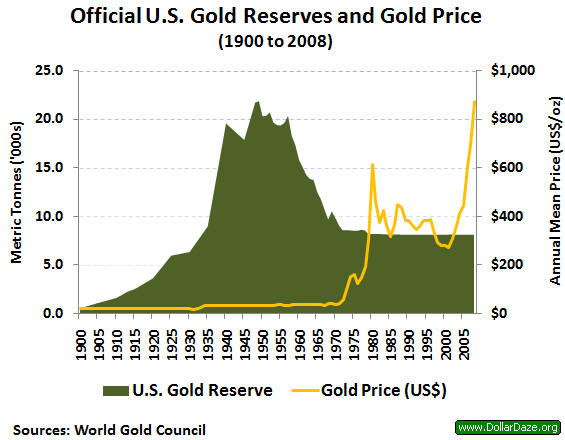
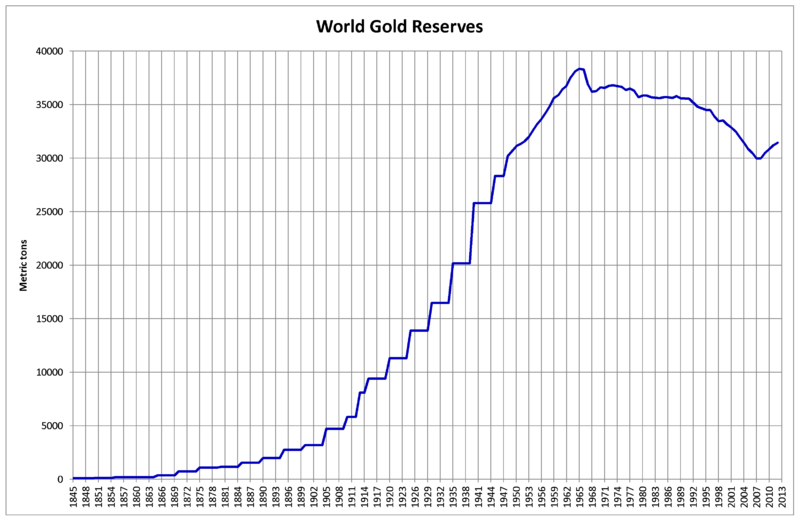
Gold, world reserves 10.9
World paper currencies 7
World cryptocurrencies 2.0
Silver, world reserves .01
Land
Buildings
Vehicles
Stock, New York 22.9
Stock, NASDAQ 10.9
Stock, Japan 5.7
Stock, London 4.6
Stock, Shanghai 4.0
Stock, Hong Kong 3.9
Stock, Euronext 3.9
Stock, Toronto 3.3
Stock, Shenzhen 2.5
Stock, Bombay 2.1
Stock, India National 2.0
Stock, Deutsche Borse 1.86
Stock, Switzerland 1.53
Stock, South Korea 1.46
Stock, NASDAQ Nordic 1.37
Stock, Australia 1.33
Stock, Taiwan .97
Stock, Brazil .94
Gold 10.9 60000 $/kg
Silver .044 .044 605 $/kg
Currency, USA 1.98
Currency, Europe 1.38
Currency, China 1.15
Currency, Japan 1.0
Currency, India .425
Currency, Russia .158
Currency, UK .104
Currency, Switz. .090
Currency, S. Korea .086
Cryptocurrency, Bitcoin 1.09
Cryptocurrency, Ethereum .210
Cryptocurrency, Binance .047
Cryptocurrency, Tether .041
Cryptocurrency, Cardano .038
Cryptocurrency, Polkadot .034
Cryptocurrency, XRP .025
 |
 |
|---|---|
 |
 |
|---|---|
|
|---|
Cobalt is the dominant cost for lithium-ion batteries, and copper is the dominant cost for solar cells, wind turbines, and electric motors.
Lithium-ion batteries can be made with or without cobalt, although cobalt is required if you want large energy/mass.
The critical metals are copper, lithium, cobalt, nickel, neodymium, silver, and rare Earths. Cobalt and rare Earths are a concern because they're scarse (42% of cobalt goes to batteries) and because they come from politically unstable regions.
The metal content of various devices is:
           Cost  Mining  Reserves   Battery   Battery   SolarCell  SolarCell    Wind    Wind   Motor     Motor
           $/kg  Bkg/yr    Bkg     kg/MJoule  $/MJoule  kg/kWatt    $/kWatt   kg/kWatt  $/kW  kg/kWatt  $/kWatt

Lithium     20      .6      30       .023      .46        -            -        -        -      -         -
Cobalt      30      .12      7       .20      6.0         -            -        -        -      -         -
Nickel      15     2.2      80       .20      3.0         -            -        -        -      -         -
Copper       6    18       700       -         -         5            30       4       24       .036      .22
Neodymium   25      .01       .6     -         -          -            -        .014     .28    .0062     .16
Silver     450      .026      .53    -         -          .034        15        -        -      -         -
All lithium-ion batteries contain lithium and most contain an equal number of lithium and cobalt atoms. Lithium-ion batteries typically contain an equal number of lithium and cobalt atoms. A cobalt atom is substantially more massive than a lithium atom and so batteries have much more cobalt mass than lithium mass. Cobalt reserves are smaller than lithium reserves and so we will run out of cobalt before we run out of lithium.
For a typical car battery, the cobalt cost is:
Energy                  =  100  MJoules
Cobalt cost per MJoule  =  6.0  $/MJoule
Cobalt cost             =  600  $
If we make 1 billion electric cars then the total cobalt mass is:
Energy                  =  100  MJoules
Cobalt mass per MJoule  =   .2  kg
Cobalt mass per car     =   20  kg
Number of cars          =    1  billion cars
Total cobalt mass       =   20  Bkg
Cobalt mining           =  .12  Bkg/year
Cobalt reserves         =    7  Bkg
The cobalt required far exceeds annual mining and it even exceeds reserves. Not all batteries will be able to have cobalt.
All lithium-ion batteries contain lithium and they can also contain cobalt, manganese, nickel, and aluminum. Only lithium (20 $/kg) and cobalt (30 $/kg) are expensive enough to matter. Batteries with high energy/mass require cobalt. The battery types are:
                      Energy/Mass  Market  Commer-
                       MJoule/kg    frac   cialized

Lithium-ion  LiS         1.44       0       Future
Lithium-ion  LiCoO2       .95       .29     1991
Lithium-ion  LiNiCoAlO2   .79       .10     1999
Lithium-ion  LiNiCoMnO2   .74       .29     2008
Lithium-ion  LiMn2O4      .54       .10     1999
Lithium-ion  LiFePO4      .47       .22     1996

Alkaline                  .40               1992
Nickel metal hydride      .34               1990
Lead acid                 .15               1881
Nickel cadmium            .14               1960
Lithium-iBatteries typically cost 100 $/MJ. "Market fraction" is for lithium-ion batteries only.
 |
|---|
 |
|---|
 |
|---|
 |
|---|
 |
|---|
 |
|---|
 |
|---|
 |
|---|
These elements are not necessarily on the Science Olympiad list.
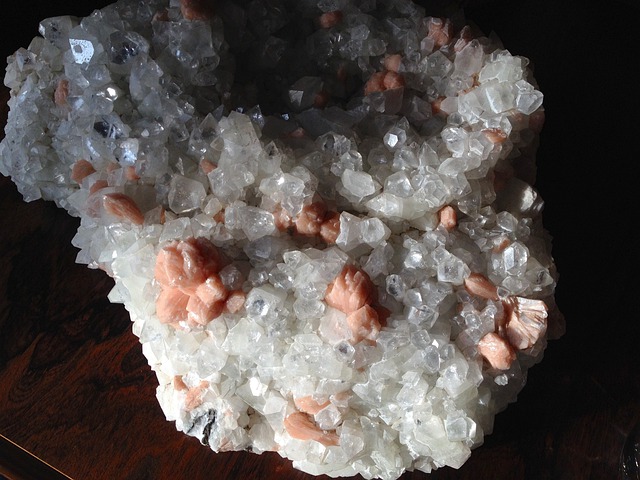
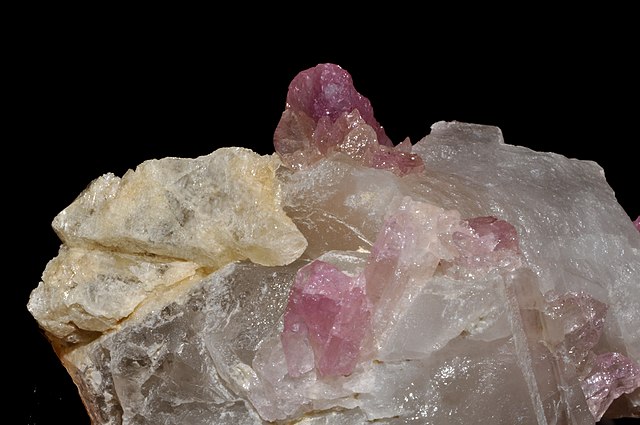
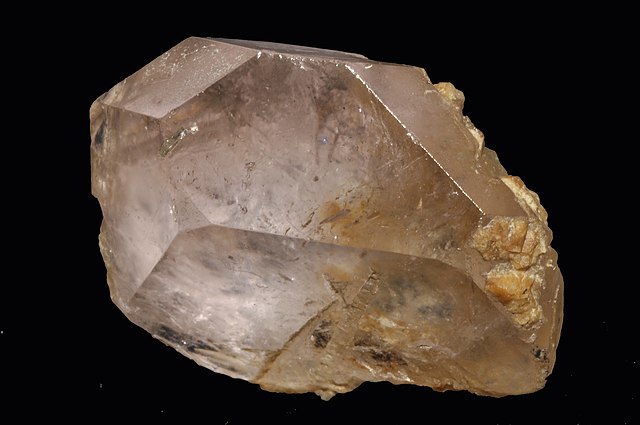
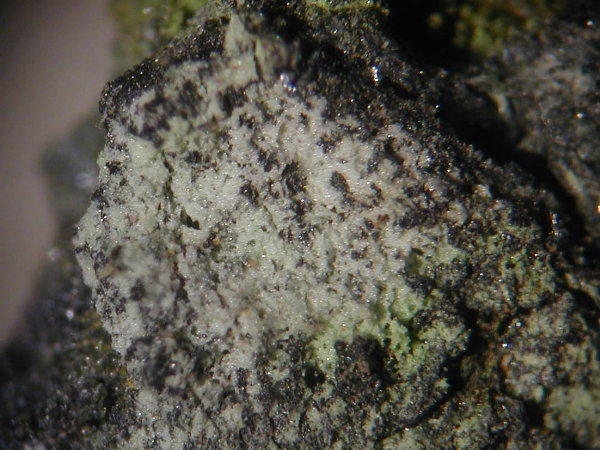
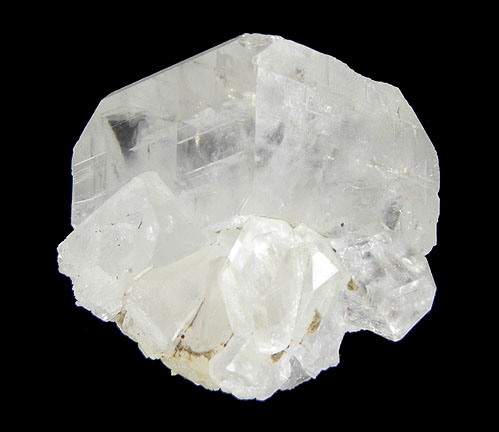
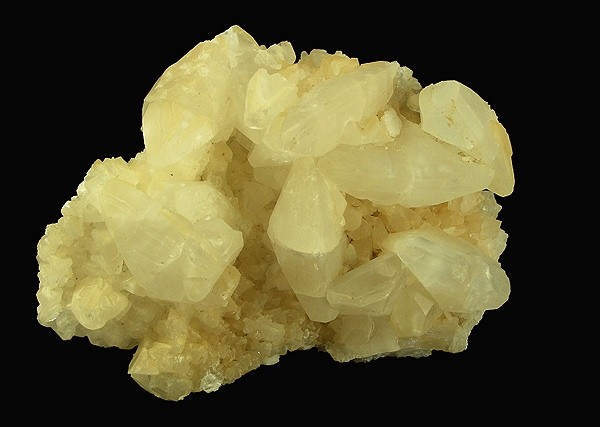
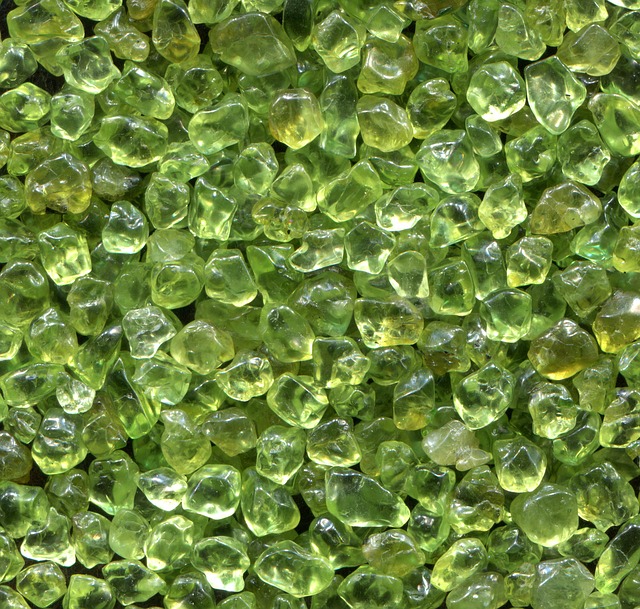
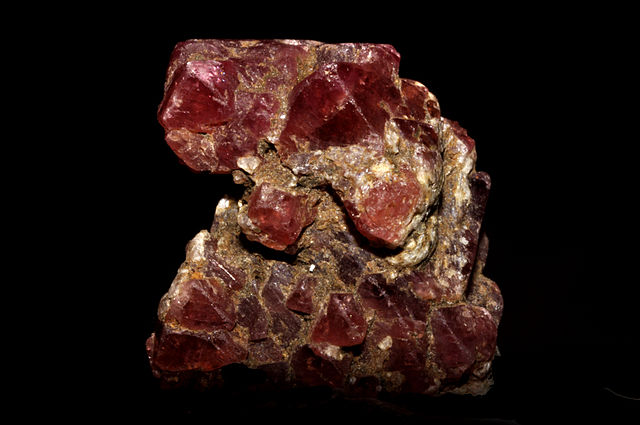
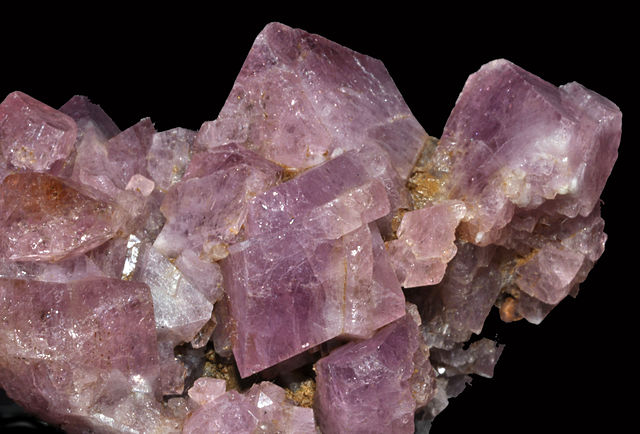
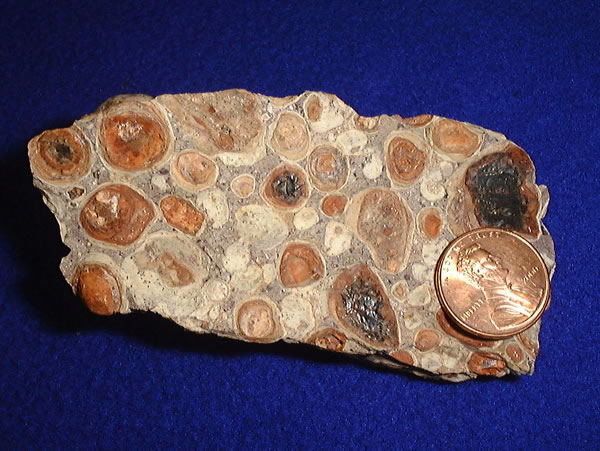
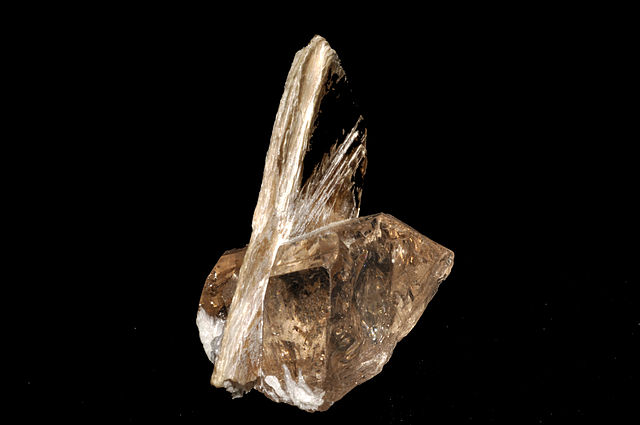
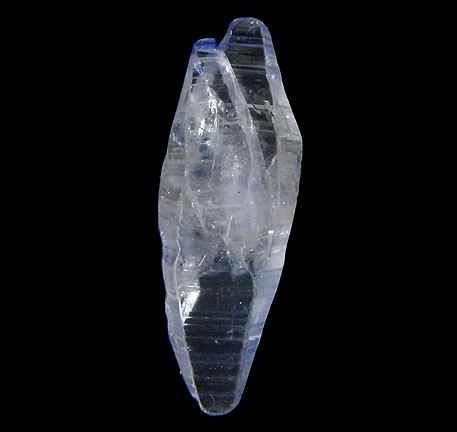
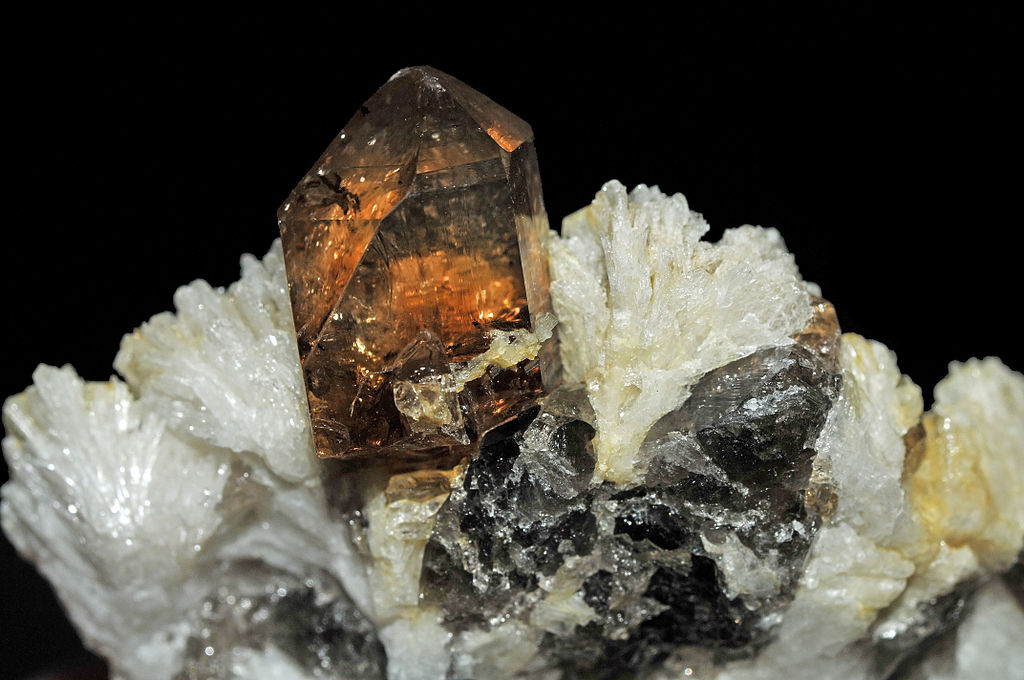
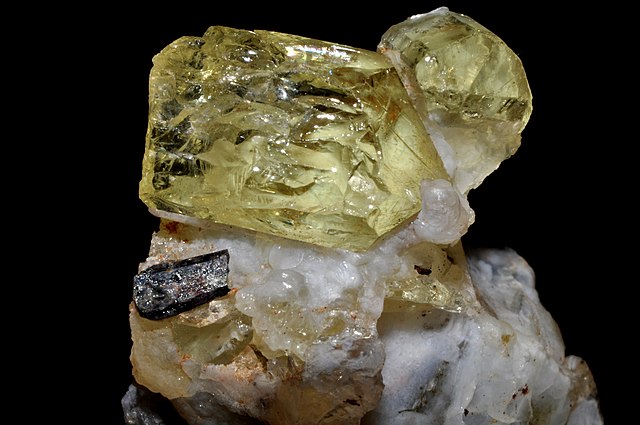
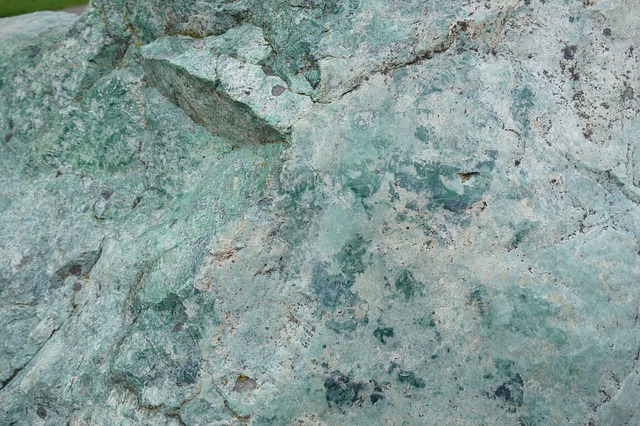
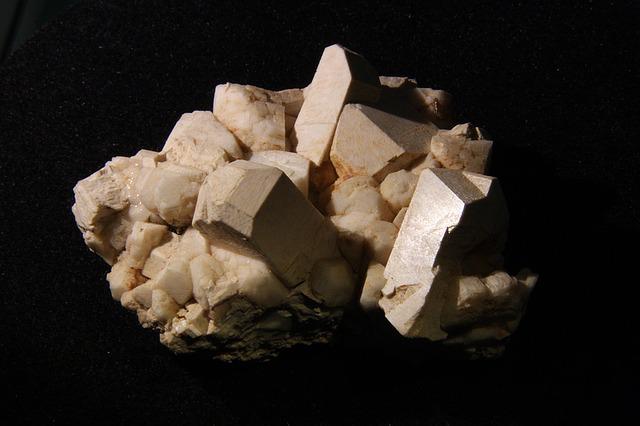
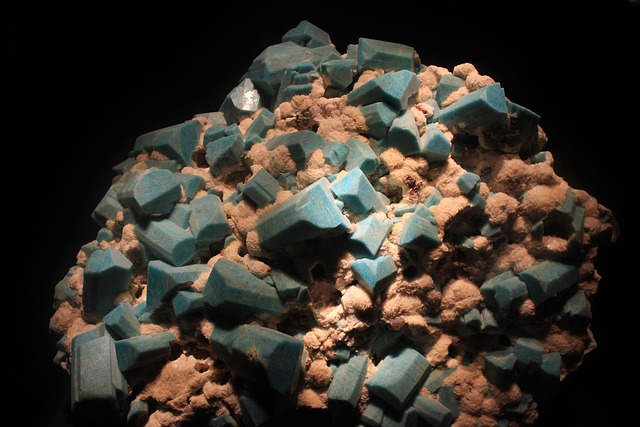
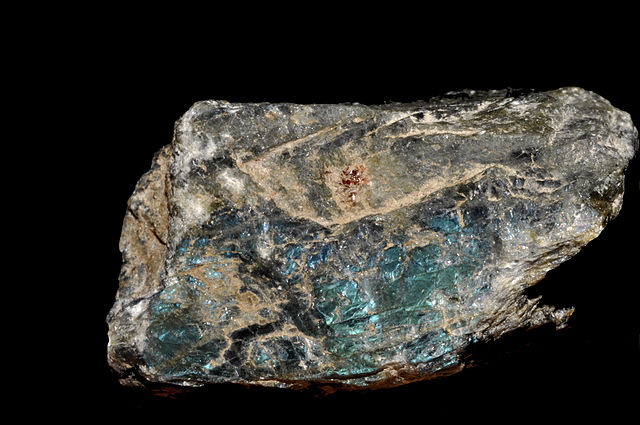
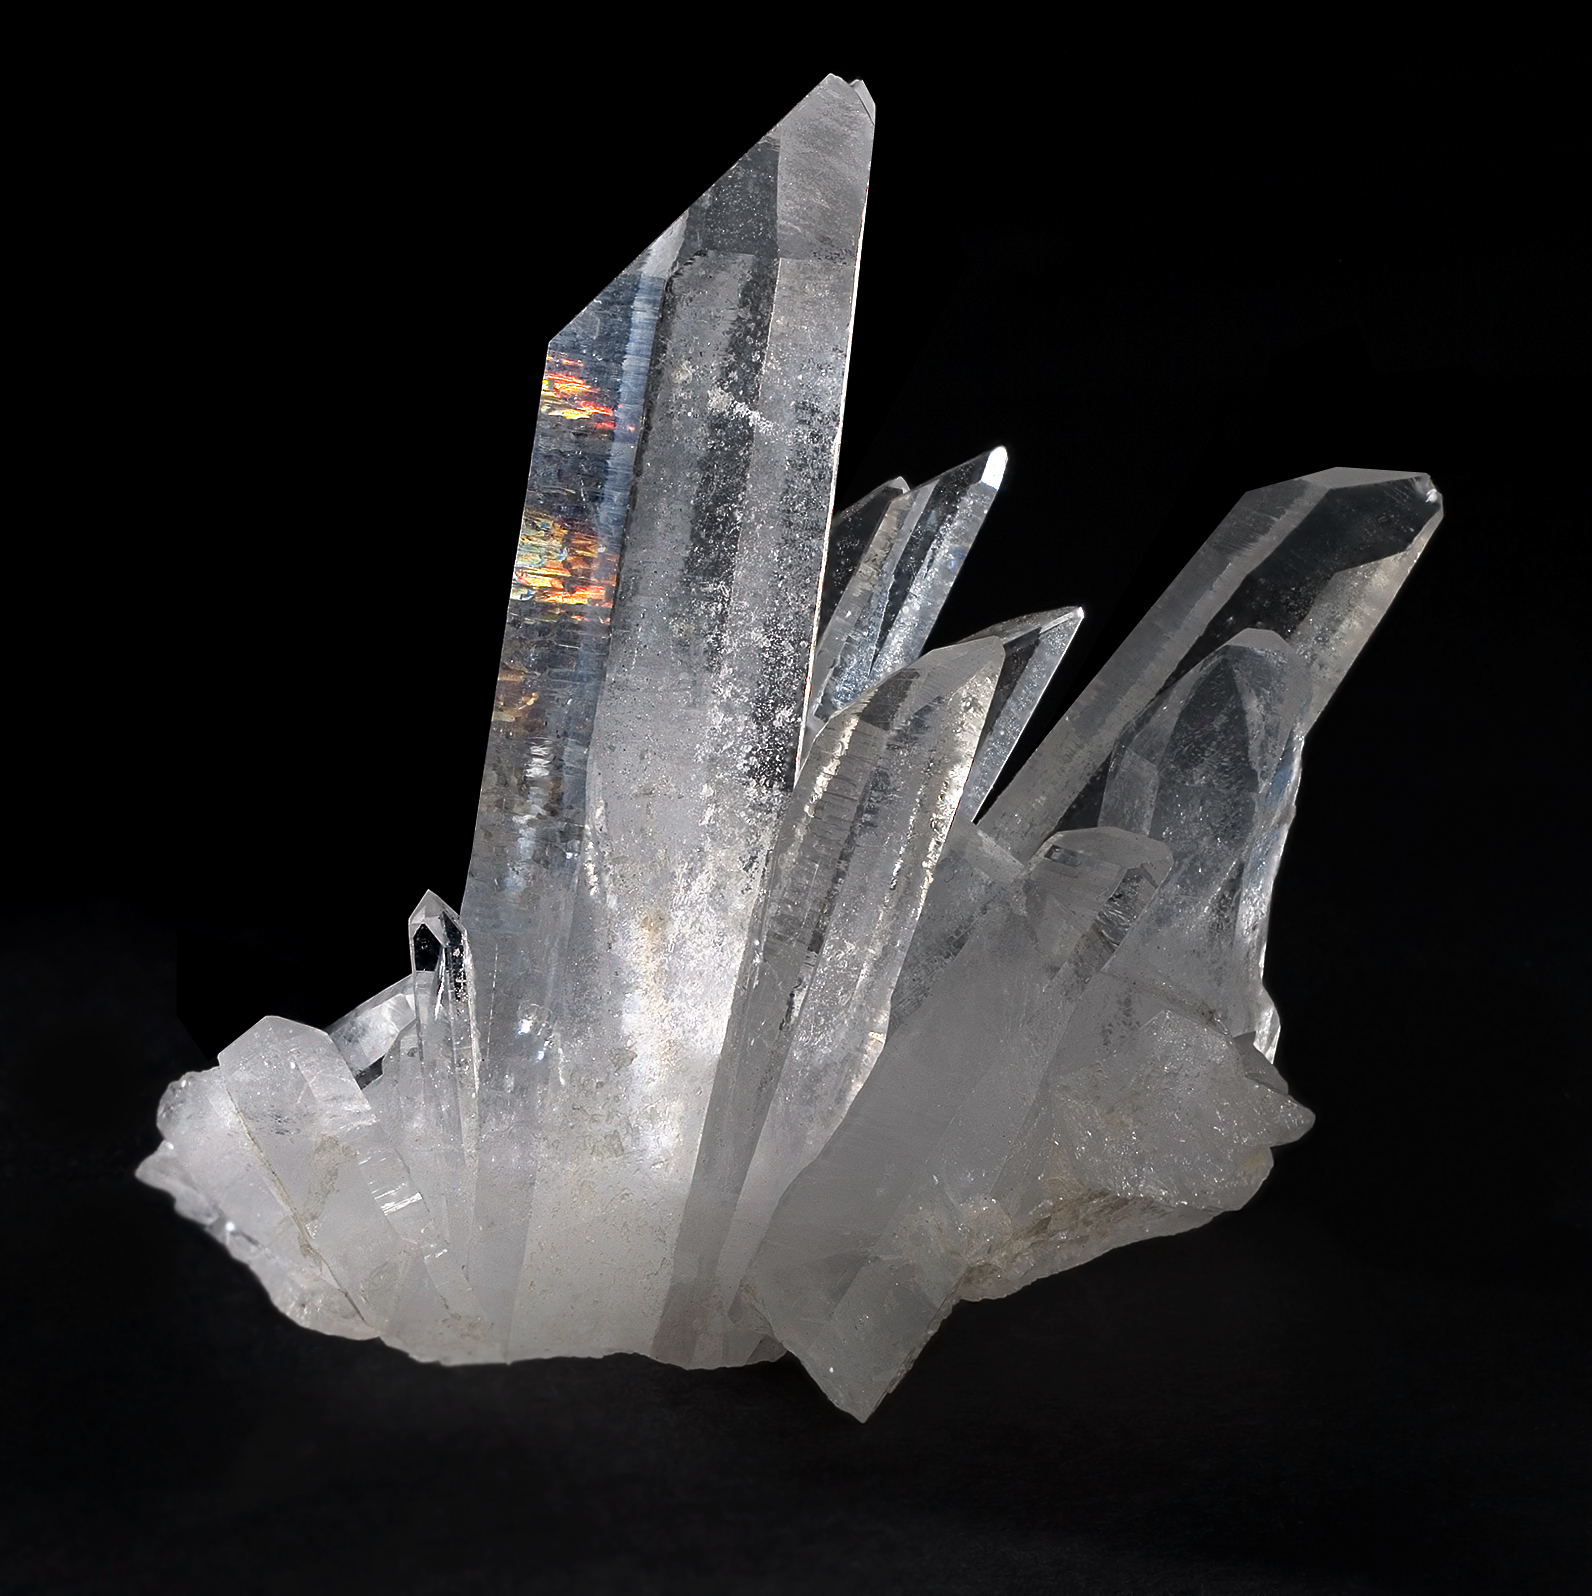
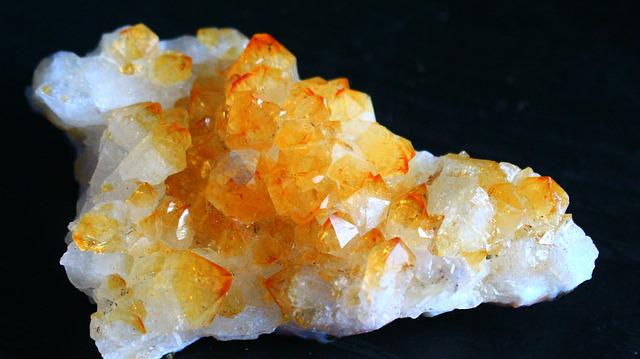
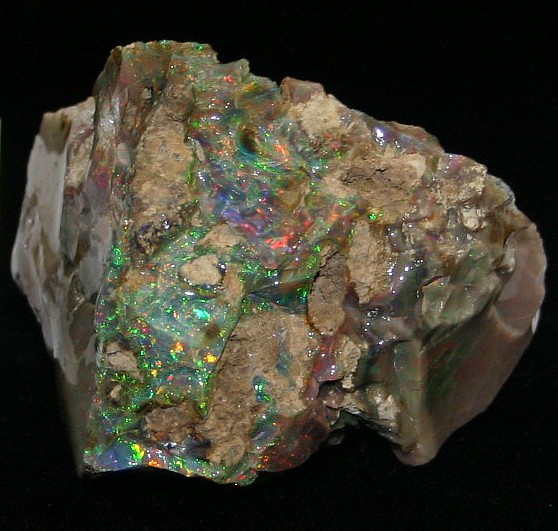
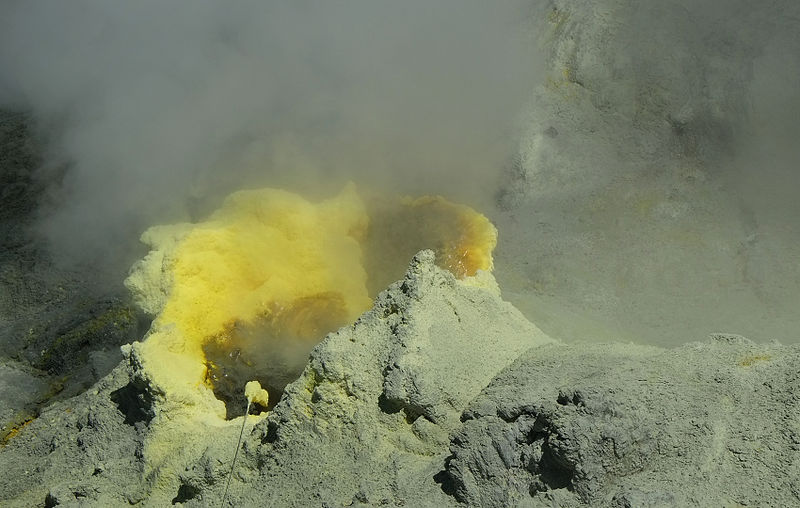
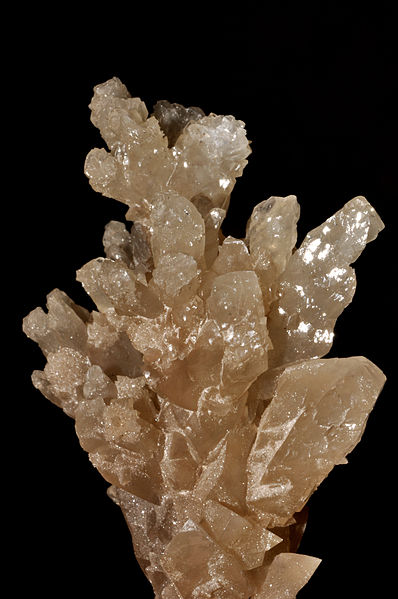
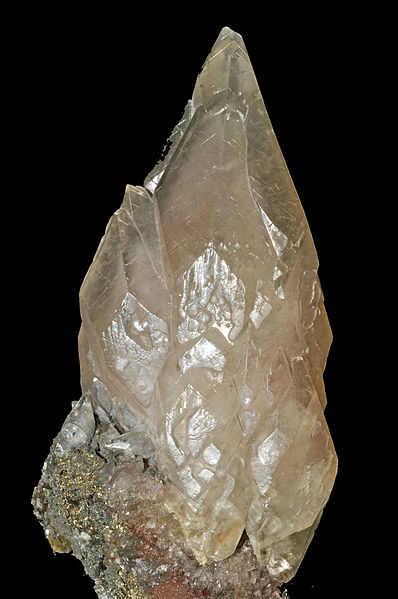
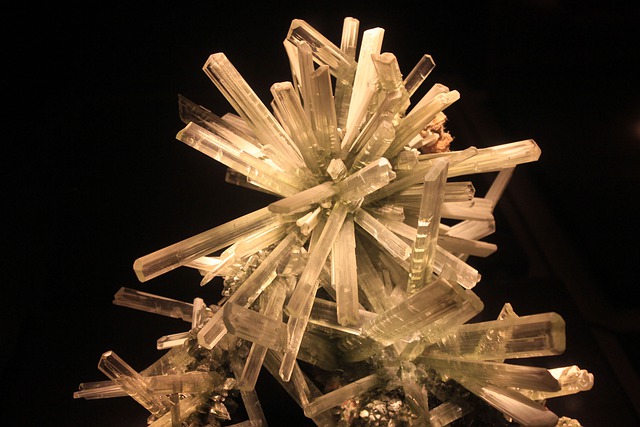
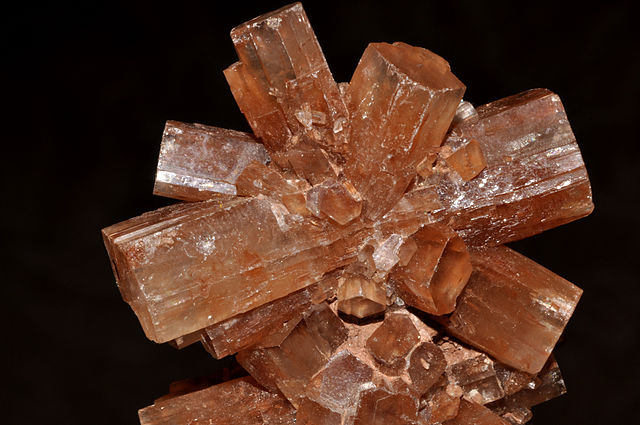
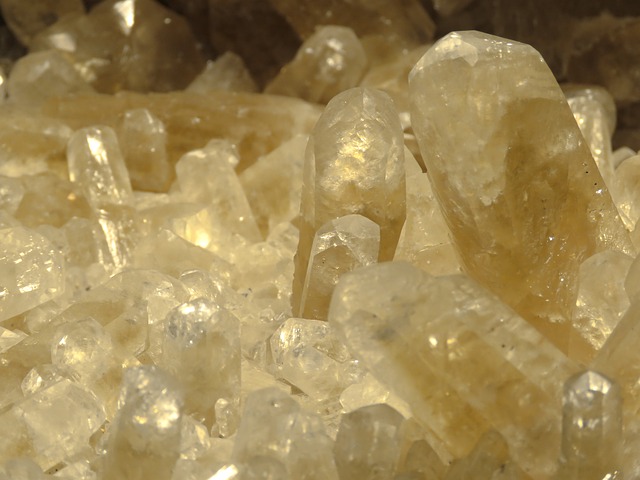
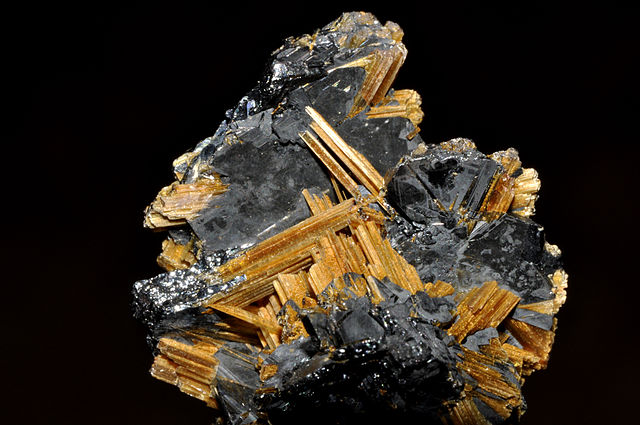
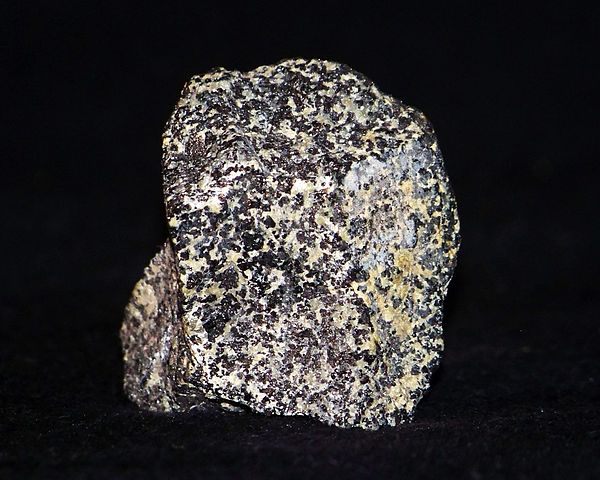
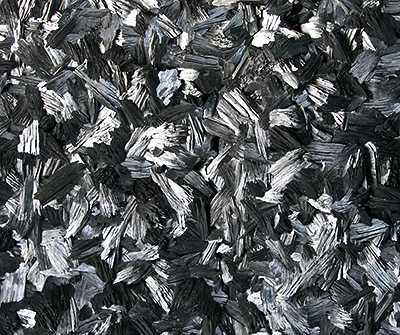
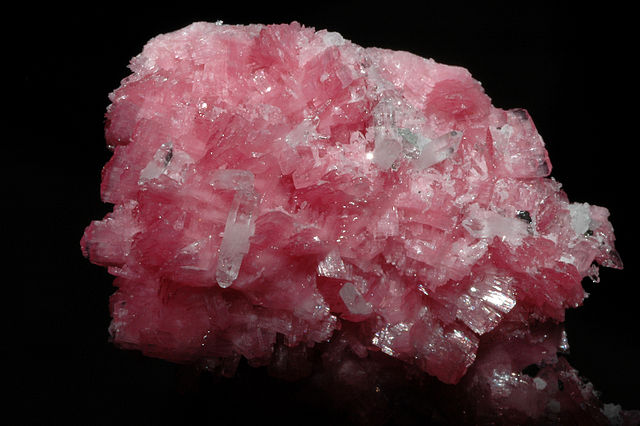
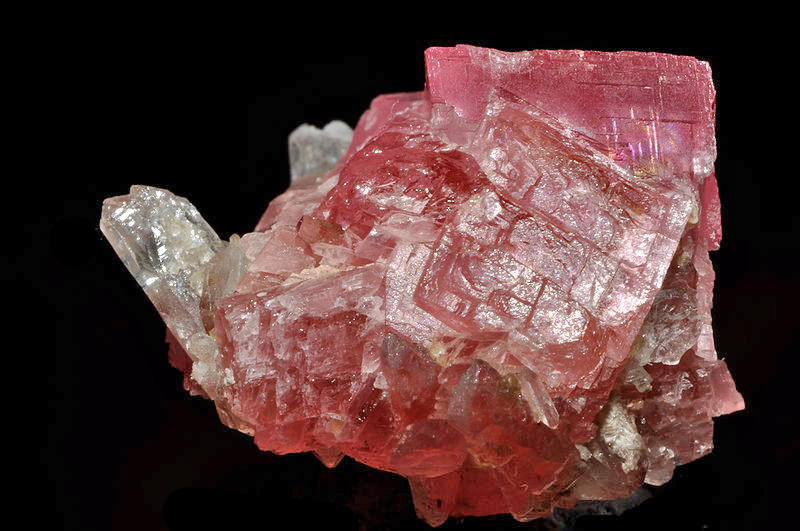
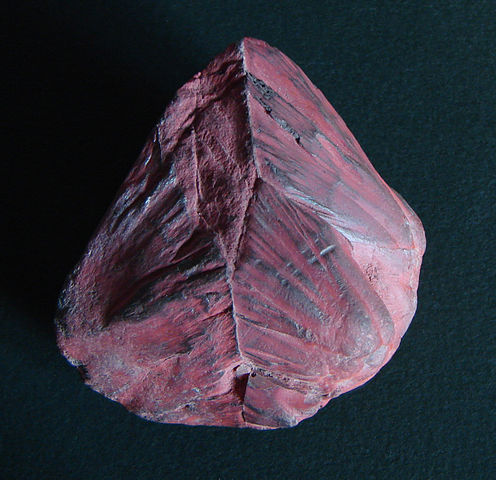
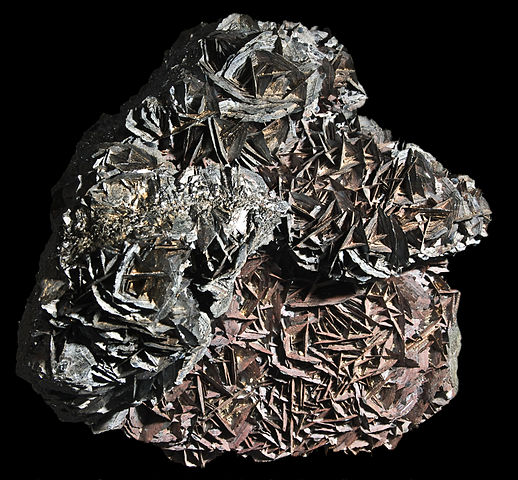
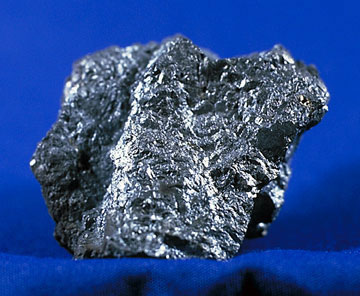
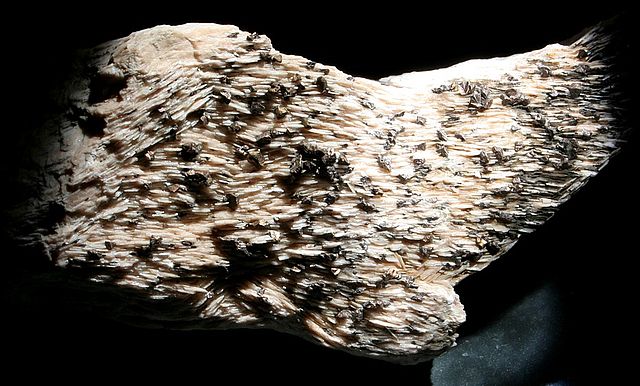
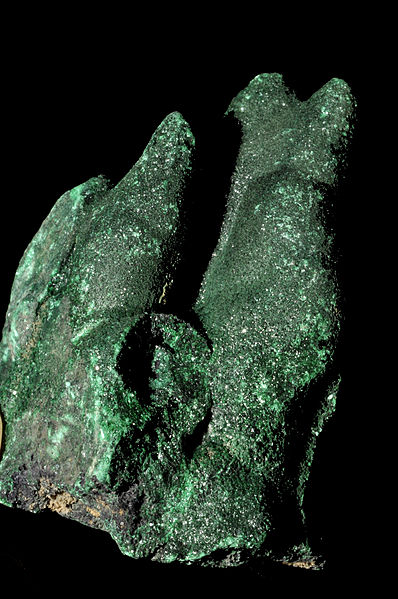
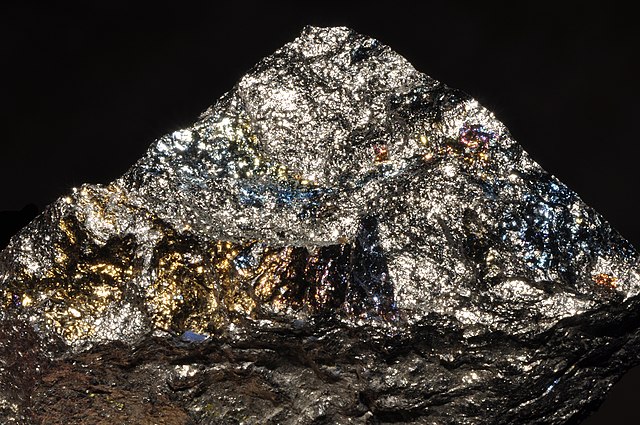
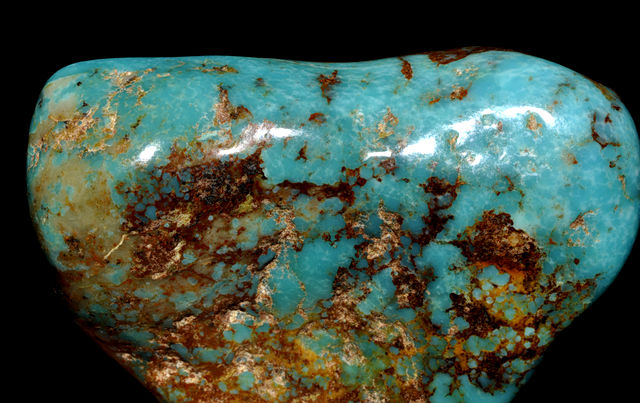
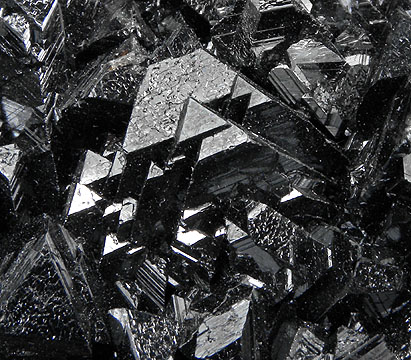
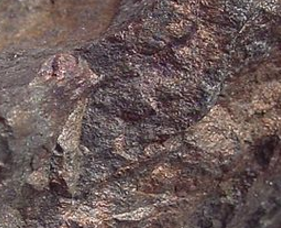
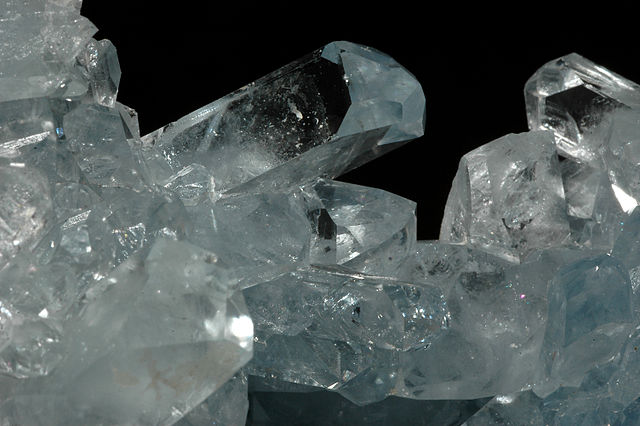
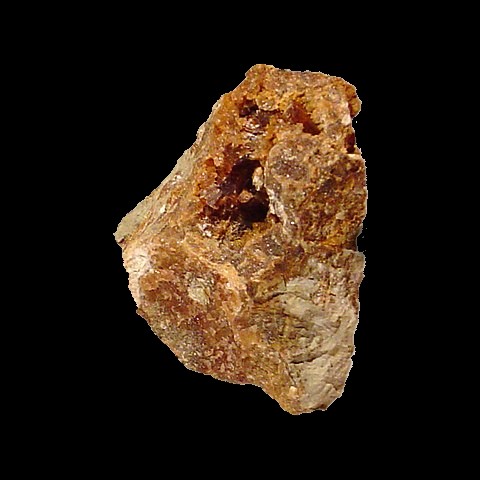
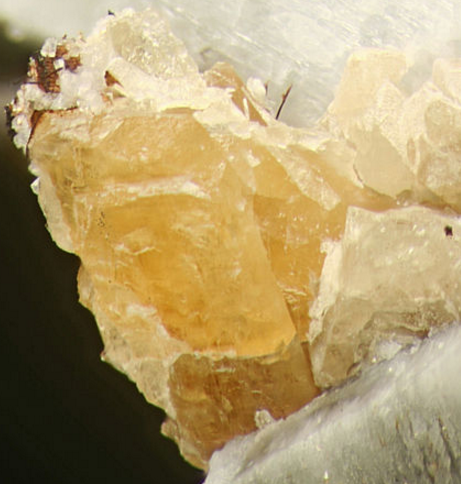
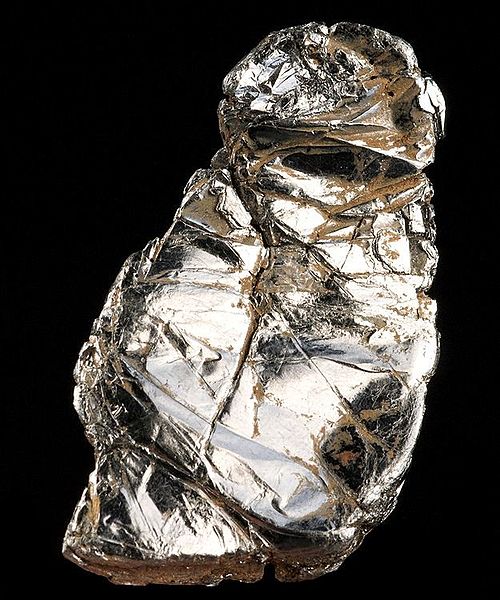
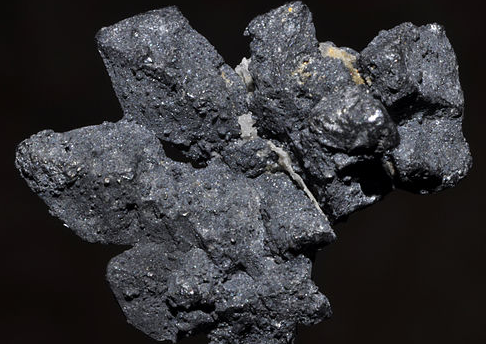
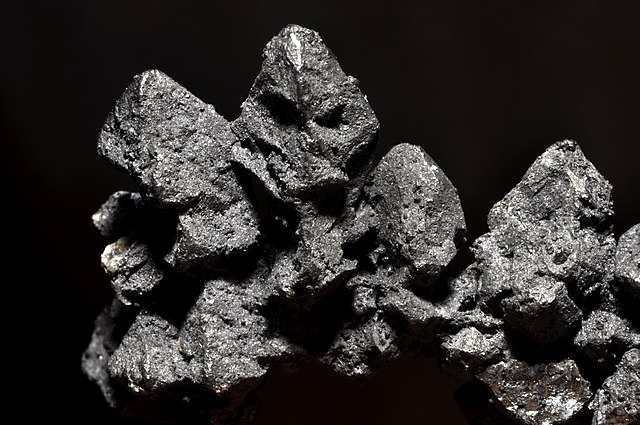
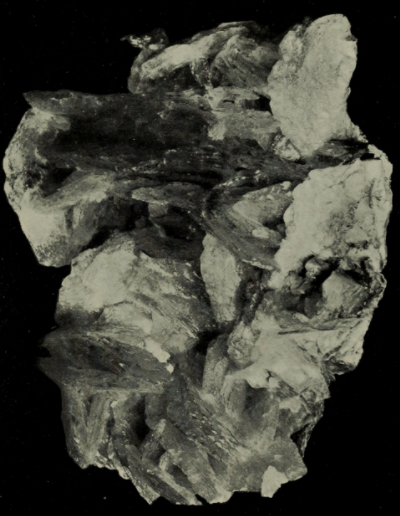
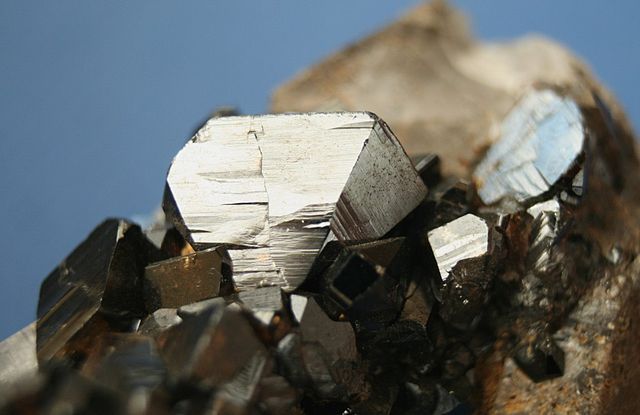
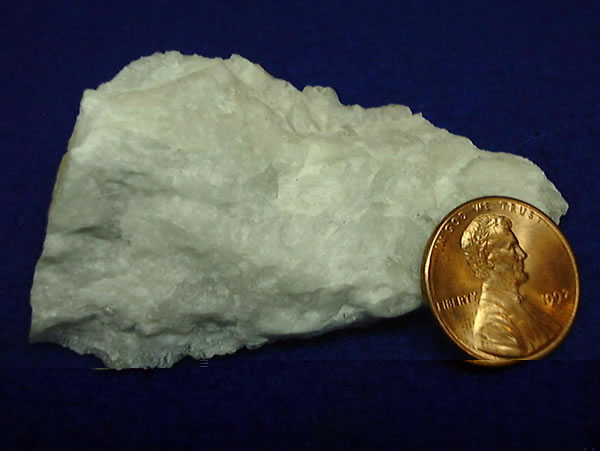
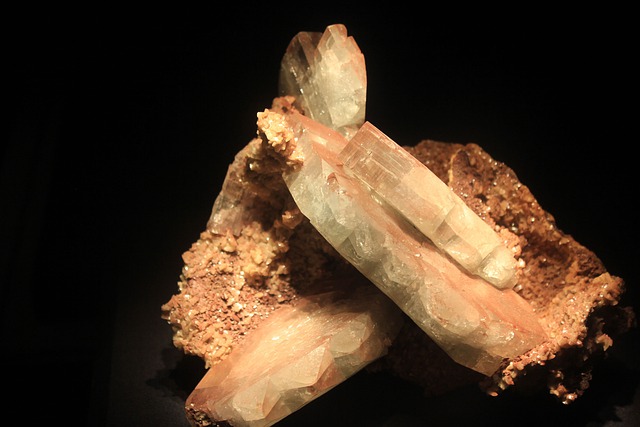
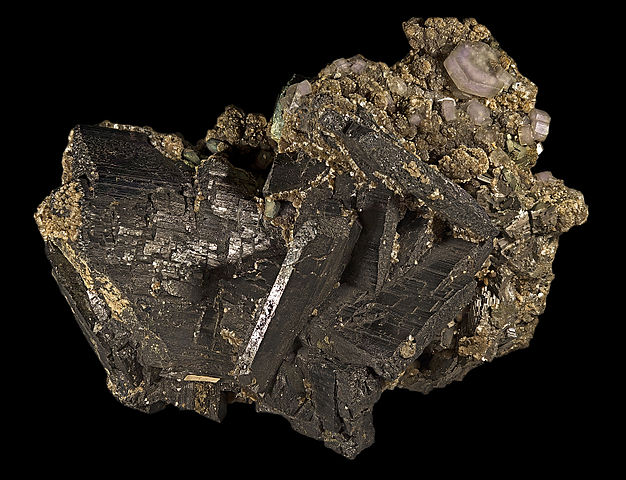
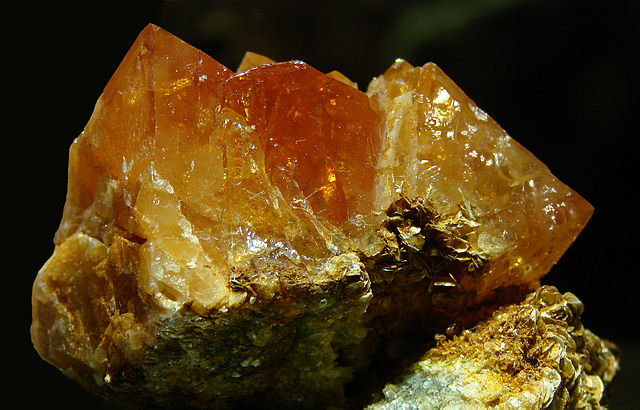
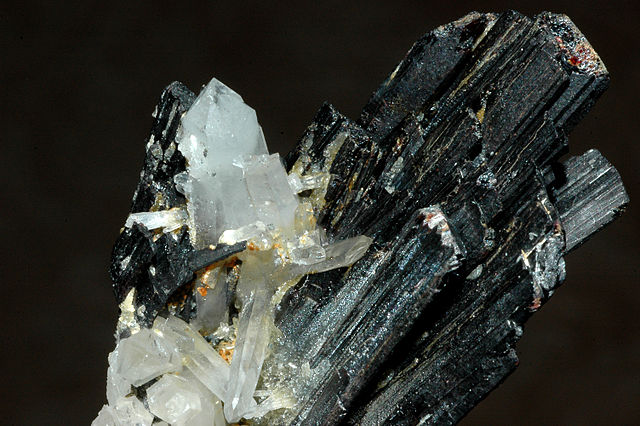
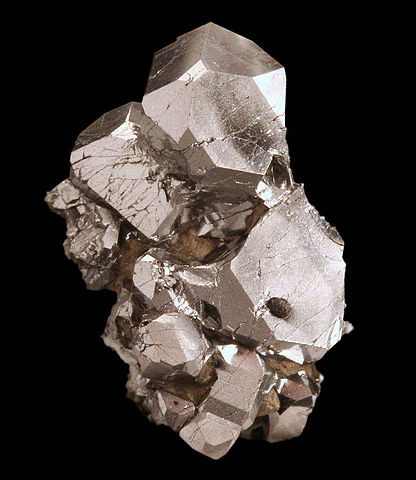
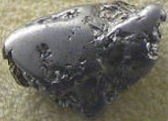
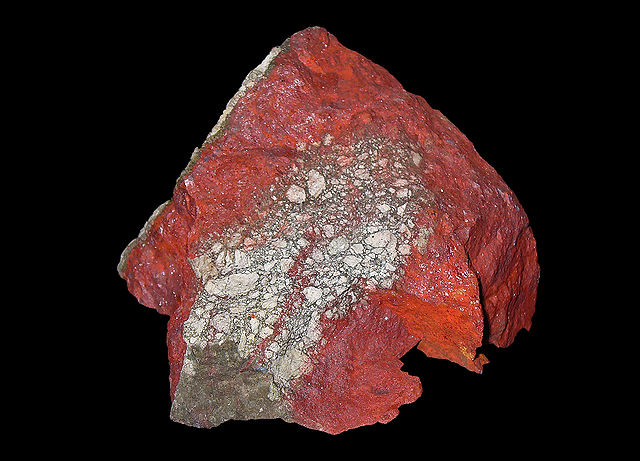
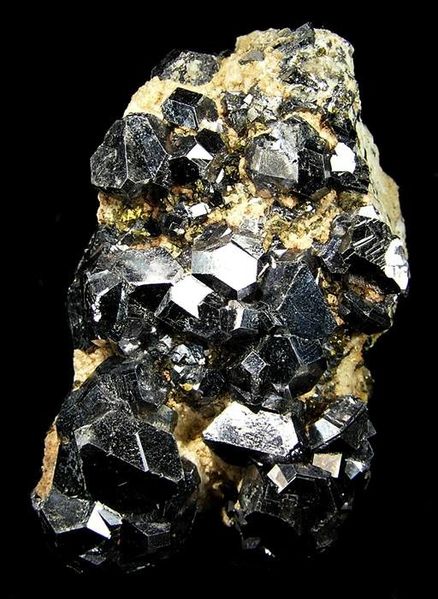
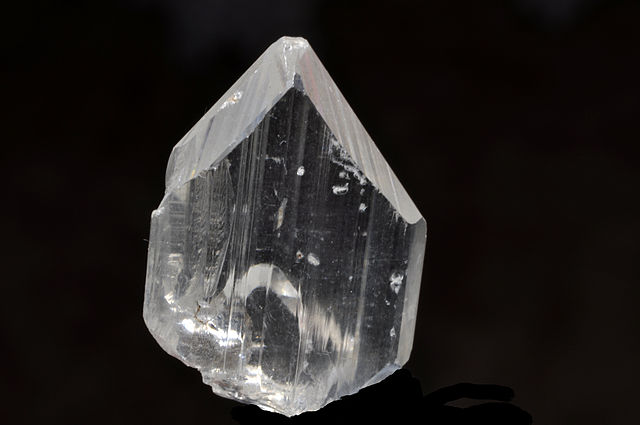
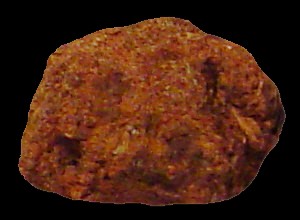
We list minerals by element, with the most abundant mineral for each element listed first.
.jpg) |
 |
 |
|---|---|---|
 |
 |
 |
|---|---|---|
 |
|---|
 |
|---|
 |
 |
 |
 |
 |
 |
|---|---|---|---|---|---|
 |
2(OH)6.jpg) |
 |
 |
 |
|---|---|---|---|---|
 |
 |
 |
 |
 |
|---|---|---|---|---|
 |
 |
 |
 |
|
|---|---|---|---|---|
 |
|---|
_.jpg) |
 |
 |
 |
 |
 |
 |
|---|---|---|---|---|---|---|
 |
.jpg) |
 |
 |
 |
 |
|---|---|---|---|---|---|
 |
 |
.jpg) |
 |
 |
|---|---|---|---|---|
 |
 |
|---|---|
 |
 |
 |
_3.jpg) |
 |
 |
|---|---|---|---|---|---|
 |
 |
|---|---|
 |
 |
 |
 |
|---|---|---|---|
 |
 |
 |
|---|---|---|
 |
|---|
 |
 |
|
|---|---|---|
 |
 |
 |
|---|---|---|
 |
 |
 |
 |
 |
 |
 |
|---|---|---|---|---|---|---|