

|
|
|
|
|
|
|---|---|---|---|---|---|
 |
 |
 |
|||
|---|---|---|---|---|---|
 |
 |
 |
 |
|---|---|---|---|
 |
 |
 |
 |
|---|---|---|---|
 |
 |
 |
 |
|---|---|---|---|
 |
 |
 |
 |
||
|---|---|---|---|---|---|
 |
 |
|
|---|---|---|
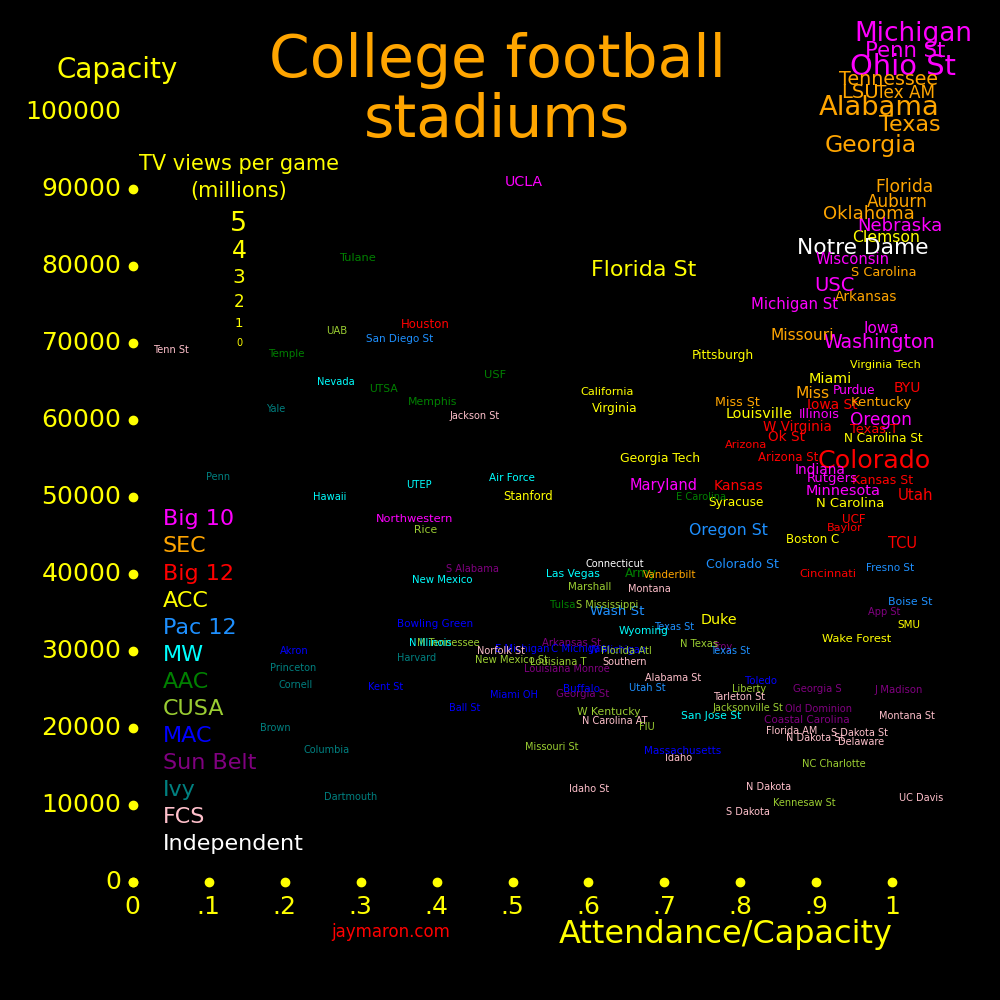
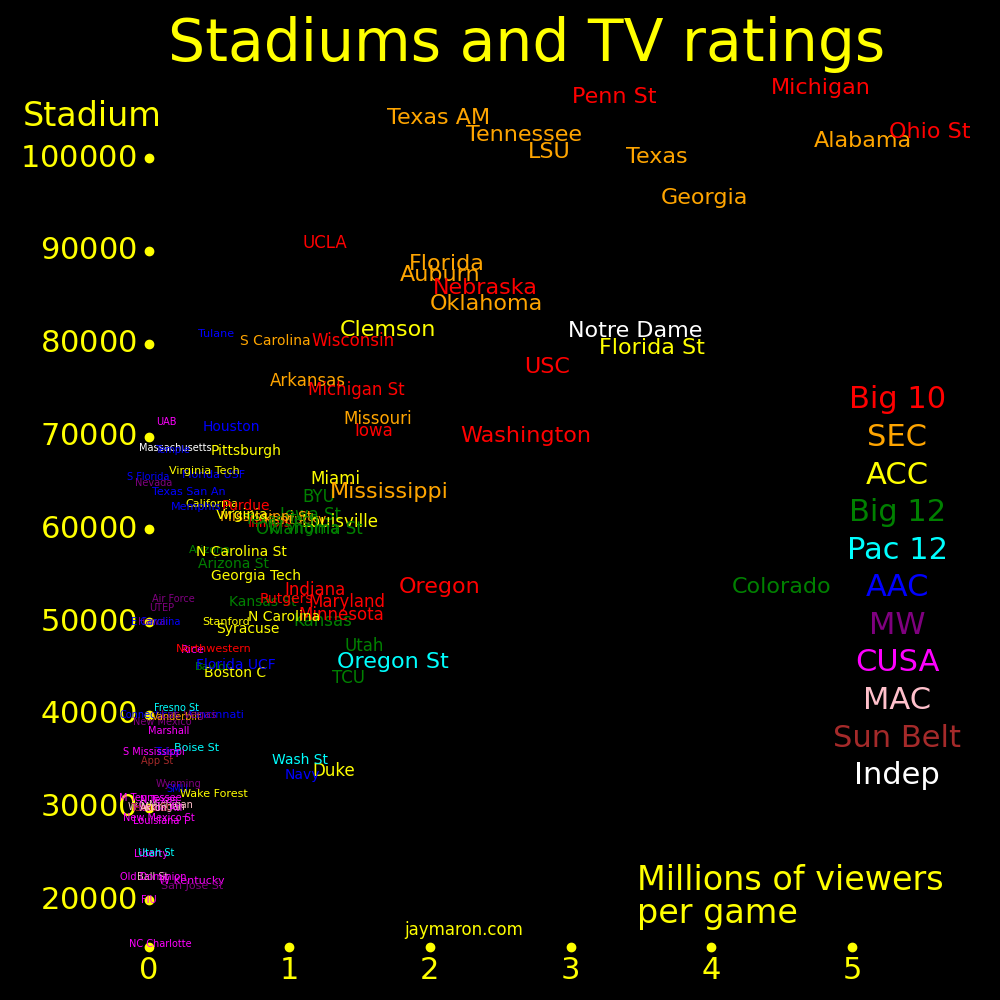
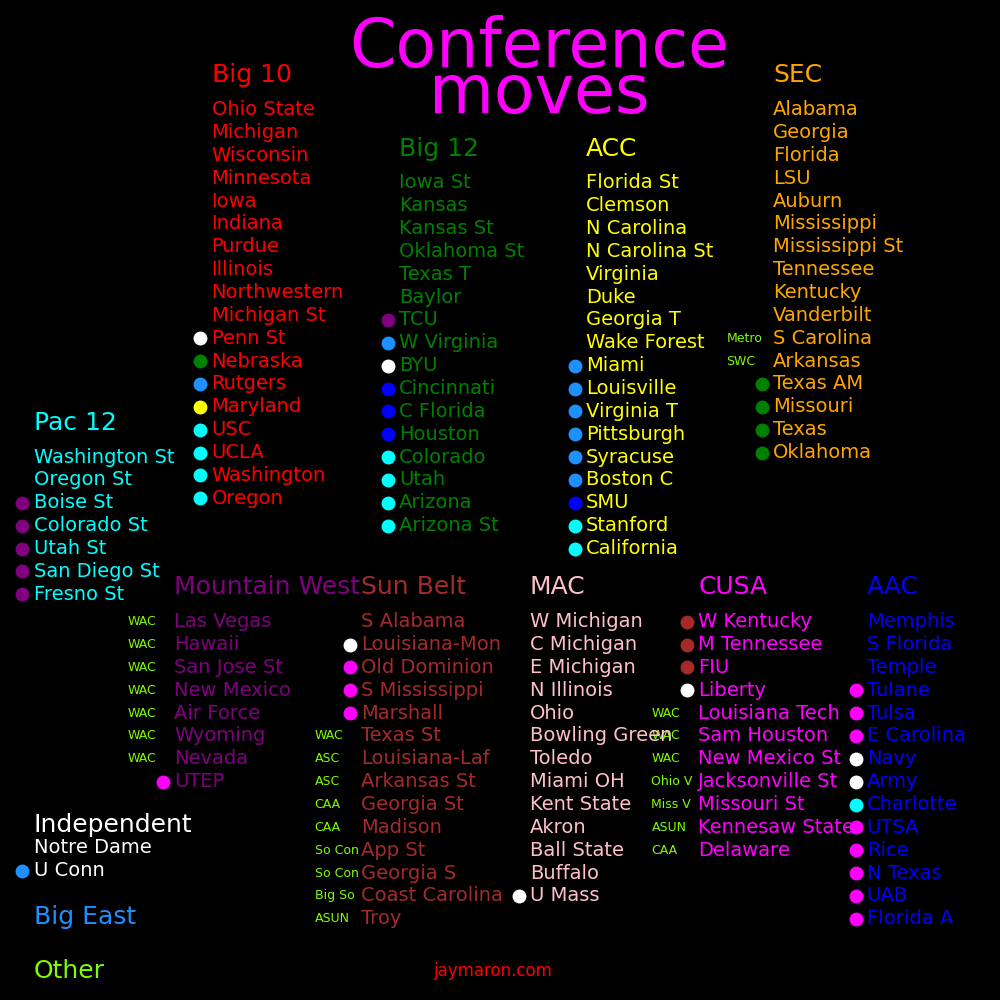
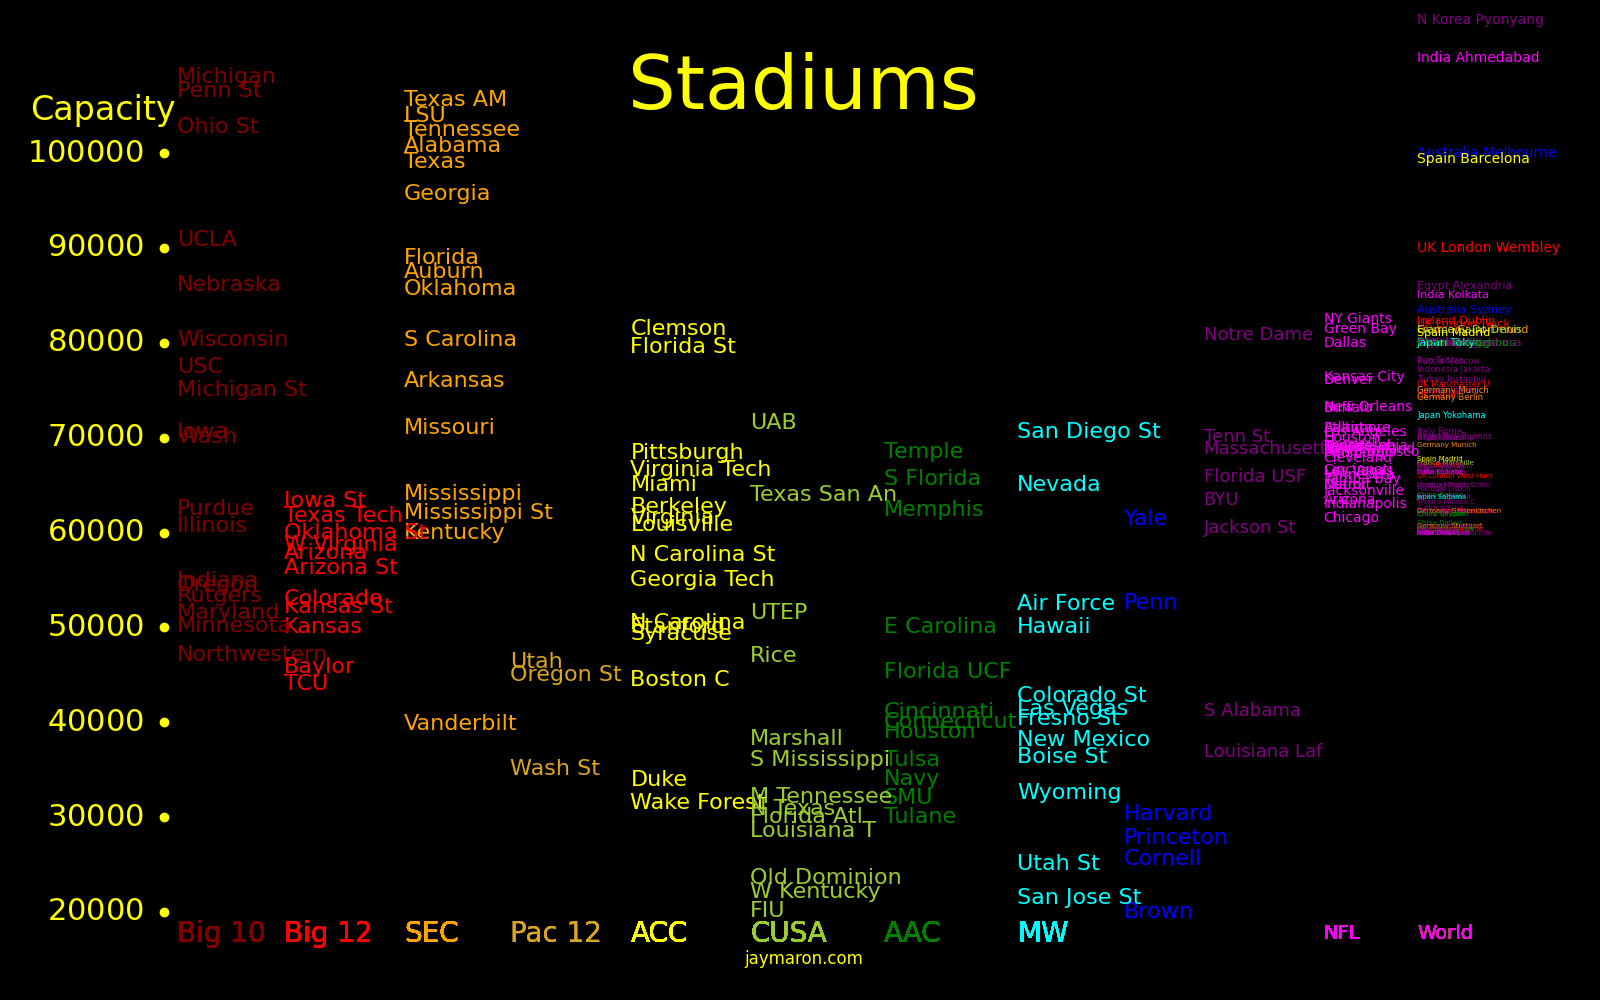
Colleges wage feudal war over TV markets, and the Big Ten and SEC won. For football, they're far stronger than other conferences.
The Big Ten and SEC have supremacy for stadiums and TV ratings. Outside the Big 10 and SEC, the biggest stadiums are Clemson, Florida State, and Notre Dame, and the biggest TV ratings are Notre Dame, Florida State, and Colorado.
Conference runts include Northwestern, Vanderbilt, Stanford, Duke, and Houston.
 |
 |
|---|---|
Almost all 5-star recruits go to the Power 2.
Almost all 4-star recruits go to the Power 4.
Almost all top-8 quarterback recruits go to the Power 2.
Almost all top-32 quarterback recruits go to the Power 4.
Some schools have more 4-star recruits than 3-star recruits. The SEC has 12 such schools and the Big 10 has 6.
For 2025:
         5-star    4-star   Top-8  Top-32  Top-16   Top-64
        recruits  recruits   QBs    QBs    classes  classes

Notre Dame   1      14               1       1        1
SEC         21     199        3     11       9       15
Big 10       9     125        5     11       5       16
ACC          1      66               4       1       15
Big 12              37               3               14
Pac 12               1               1                1
AAC                  1               1                2
Sun Belt             1
TV revenue drives conference realignment.
         Teams  States  Stadium   TV views   TV revenue   Conf rev  NIL 2024  Exit fee  Bowl 2024   5-star   4-star    3-star   TV contract  Fans
                       Thou/team  Mil/game   M$/yr/team  M$/yr/team M$/team  M$/team    M$/team   recruits recruits  recruits    end year    mil

Notre Dame    1   1       81       3.46        67            22.1      20             32             1        14          9       2029       8.2
SEC          16  12       83       2.14        21            51        16       30     5.40         21       199        148       2034      54.1
Big 10       18  12       72       2.02        21            60.5      11        0     5.99          9       125        260       2030      44.6
Big 12       16  10       55       1.27        12.5          46         6       50     3.13          0        37        304       2031      11.6
ACC          17   9       57       1.01        12.5          43.3       9      120     2.63          1        66        317       2036      23.5
Pac 12        8   6       37        .68                      34                  0     2.10          0         1        176                  5
AAC          14  11       50        .33         5             9                 17      .82          0         1        195                  3.3
MW            8   6       44        .16         4                                6      .40          0         0        178                  4
MAC          12   5       32        .072        2.5                                     .41          0         0        168       2027        .7
CUSA          9   8       32        .099         .8                              1.75   .52          0         0        136       2027       1.1
Sun Belt     14  10       13        .085        2                                5      .52          0         1        240       2030       1.8

Big Sky      12                                                                                      0         0        113
MVC          11                                                                                      0         0         64
UAC           9                                                                                      0         0         31
Southern      9                                                                                      0         0         29
Ivy           8                                                                                      0         0         28
SWAC         12                                                                                      0         0         15
SLC           9                                                                                      0         0         13
CAA          16                                                                                      0         0         13
Patriot       7                                                                                      0         0         12
MEAC          6                                                                                      0         0         12
NEC           8                                                                                      0         0          9
Pioneer      11                                                                                      0         0          5
Big South     9                                                                                      0         0          3

Tier 1 tot   68                                                                                     32       441       1029             Big10, SEC, Big12, ACC, Notre Dame
Tier 2 tot   66                                                                                      0         3       1113             Pac 12, AAC, MW, MAC, CUSA, Sun
Div II tot  162                                                                  5                   0         0
Div III tot 240                                                                                      0         0
The table is for 2025.
There are around 2000 3-star recruits per year.
2/3 of NIL money goes to football.
The playoffs generate $470 million and total TV revenue is $2250 million. The Pac 12 doesn't yet have a long-term TV contract.
The ACC exit fee applies to teams that want to leave before 2036.
It costs $5 million to move from FCS to FBS. Prior to 2024, it cost $5 thousand.
The revenue totaled over all sports and over all Power 5 schools, for 2022, is:
A conference is a rare instance where power is shared equally. This may change. The ACC contract expires in 2030 and the new contract may share revenue unequally.
       Million $    %

TV        4227     42
Donors    2206     22
Tickets   1647     16.5
Other     1257     12.6
Bowls      621      6.2
 |
|---|
 |
|---|
Food chains:
Big 10 ← Pac 12 ← Mountain West ← CUSA ← Sun Belt ← FCS

SEC    ← Big 12 ← AAC           ← CUSA ← Sun Belt ← FCS
Conference tiers:
Tier 1    Big 10   SEC    Notre Dame
Tier 2    Big 12   ACC
Tier 3    Pac 12   Mountain West   MAC    AAC    CUSA    Sun Belt
Tier 4    FCS
Tier 5    Division 3
 |
 |
 |
|---|---|---|
The collapse of the Pac 12 was triggered by the departure of UCLA and USC. 8 more teams left shortly after. This triggered an avalanche that cascaded to lower conferences.
Conference moves:
1990  Indep  → Big 10   Penn State
2004  Big E  → ACC      Miami       Virginia T
2005  Big E  → ACC      Boston C
2010  M West → Big 12   TCU
2011  Big 12 → Big 10   Nebraska
2011  Big 12 → Pac 12   Colorado
2011  M West → Pac 12   Utah
2012  Big 12 → SEC      Texas AM    Missouri
2012  Big E  → Big 12   W Virginia
2013  Big E  → ACC      Syracuse    Pittsburgh
2013  Big E  → AAC      Temple
2014  ACC    → Big 10   Maryland
2014  Big E  → Big 10   Rutgers
2014  Big E  → ACC      Louisville
2023  AAC    → Big 12   Houston     UCF       Cincinnati
2023  Indep  → Big 12   BYU
2023  CUSA   → AAC      UAB         Rice      N Texas   Florida Atl   UTSA   Carolina Charleston
2023  Indep  → CUSA     Liberty     New Mex St
2023  Ohio V → CUSA     Jacksonville St
2023  WAC    → CUSA     Sam Houston St
2024  Big 12 → SEC      Texas       Oklahoma
2024  Pac 12 → Big 10   UCLA        USC       Oregon    Washington
2024  Pac 12 → Big 12   Colorado    Utah      Arizona   Arizona St
2024  Pac 12 → ACC      Stanford    California
2024  ASUN   → CUSA     Kennesaw St
2024  AAC    → ACC      SMU
2026  M West → Pac 12   Boise St    Utah      Utah St   Colorado St   San Diego St   Fresno St
2026  Sun    → Pac 12   Texas St
2026  CUSA   → MW       UTEP
2026  MAC    → MW       N Illinois
2026  BigWest→ MW       UC Davis
2026  Missour→ MW       N Dakota St
2026  CUSA   → Sun      Louisiana Tech
2026  Big Sky→ MAC      Sacramento St
2026  ASUN   → UAC      Austin Peay    C Arkansas   N Alabama   E Kentucky   W Georgia
2026  OVC    → UAC      Little Rock
2026  D-II   → UAC      W Florida
2026  WAC    → Big West California Baptist   Utah Valley
2026  Summit → WCC      Denver
2026  FCS Ind→ CAA      Sacred Heart
2026  WAC    → Big Sky  S Utah         Utah T
2026  OVC    → SoCon    Tennessee T
2026  CAA    → Patriot  Villanova      William & Mary
2026  No team→ FCS Ind  Chicago St
2027  FCS Ind→ NEC      Chicago St
2027  BigWest→ WCC      UC Santa Barbara   UC San Diego
In 2026, the Western Athletic Conference changed its name to the United Athletic Conference.
 |
|
|---|---|
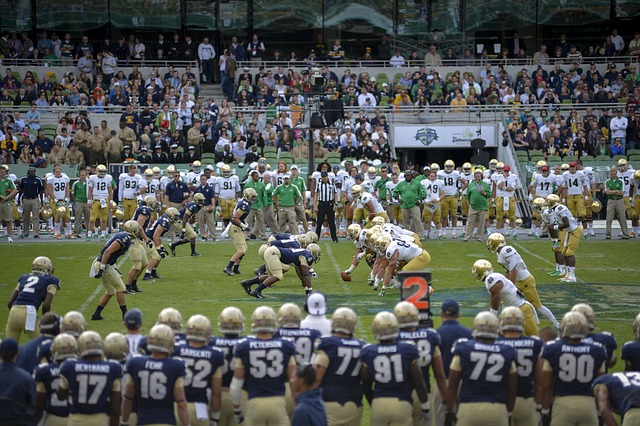
Notre Dame plays 5 ACC teams per year. One could imagine Notre Dame switching to Big 10 teams for bigger TV revenue. Playing Big 10 teams also helps if you're a national championship contender, and it gives the Big 10 an edge over the SEC. Notre Dame is at the geographic center of the Big 10 with 6 teams within a 4-hour drive. Notre Dame's schedule in games/year is:
Conference   Average   2024  2025  2026  2027 28 29 30 31 32 33 34 35 36 37

ACC             6        5     5     4     4  4  4  4  5  4  4  4  4  4  4
Big 10          2.5      2     2     4     1  1     1  1     1  1           Always USC
AAC             1.5      2     1     1     1  1  2  1  2  1                 Always Navy
SEC              .5      1     2              1  1  1  1  1
MAC             1        2
Big 12           .5                  1     1
Mtn West         .5
Pacific         0              1
Sun Belt        0
South           0
Total                   12    11    10     7  8  8  8 10  7  6  6  5  5  5
"Games/year" is averaged over 2016-2024. We regard USC as always having been in the Big 10, and Stanford and Cal as always having been in the ACC.
Notre Dame's future schedule has space. They play Navy through 2032. Big games include Michigan St in 2027, Alabama in 2030, and Michigan in 2033 and 2034.
Notre Dame is often involved in big non-conference games. Decades ago, there were never enough big non-conference games to properly decide bowls, and Notre Dame was a big help. Today, the Big 10 and SEC dominate, so the bowl picture will be more clear.
The Big 10 teams that Notre Dame plays frequently are USC, Purdue, Michigan State, and Michigan. Notre Dame could potentially join the Big 10. The schedule would be 9 Big 10 teams, Stanford, Navy, and one free game.
Notre Dame plays ACC teams on a rotating schedule. Notre Dame has long-standing rivalries with Pittsburgh and Georgia Tech, but these teams don't get special favoratism today. Notre Dame also has long-standing rivalries with Army and Air Force but rarely plays these teams today.
Notre Dame's rivalries are:
                 Games   W   L   T

Navy         AAC   95   81  13   1
USC          B10   91   49  37   5
Purdue       B10   85   57  26   2
Michigan St  B10   77   47  29   1
Pittsburgh   ACC   72   50  21   1
Army         AAC   51   39   8   4
Michigan     B10   43   17  25   1
Georgia T    ACC   37   30   6   1
Stanford     ACC   36   22  14
Air Force    MW    30   24   6
Miami        ACC   26   17   8   1
N Carolina   ACC   23   21   2
Boston C     ACC   20   17   3
Penn St      B10   19    9   9   1
Nebraska     B10   16    7   8   1
Florida St   ACC   11    5   6
Clemson      ACC    8    3   5
|
|---|
Stanford failed. It has the biggest endowment of private FBS colleges and it failed to get into the Big Ten.
The Ivy League has vast money and could be football powers. It was powerful in the early age of football.
Endowments of FBS private schools in billions of dollars. A "*" indicates a religious college.
Stanford     38
Notre Dame   19     *  Catholic. Congregation of Holy Cross
Northwestern 14.2
Duke         11.9      Nonsectarian. Historically Methodist
Vanderbilt   10.2
USC           8.1      Nonsectarian. Historically Methodist
Rice          8.1
BYU           6.9   *  Mormon
Boston C      3.8   *  Catholic. Jesuit
TCU           2.7   *  Christian. Disciples of Christ
Tulane        2.27
SMU           2.12  *  Methodist
Syracuse      2.10
Baylor        2.10  *  Baptist
Wake Forest   2.0      Nonsectarian. Historically Baptist
Liberty       1.8   *  Southern Baptist
Miami         1.59
Endowments of FCS private colleges:
Harvard      52
Yale         41
Princeton    34
Penn         22.3
Columbia     15
Cornell      10.7
Dartmouth     8.3
Brown         6.7

Boston U      3.54  *  Methodist
Georgetown    3.6
Villanova     1.33  *  Catholic. Augustinian

J Hopkins    13.1
Wash U St L  12.0
Emory        11.0
Chicago      10.1
NYU           6.5
Caltech       4.1
Carnegie Mel  4.0
Williams      3.7
Amherst       3.55
Endowments of Division II and III colleges:
MIT 24.6
 |
|---|
The Pac-12 Conference collapsed and then poached from the Mountain West, namely Boise St, Colorado St, Utah State, San Diego St, and Fresno St. It also added Texas State, which helps to get games with Texas schools. Texas is good for November games.
The Mountain West gave UNLV a payout to stay in the conference. UNLV is in a big city, it's the strongest school in the state, it has a big stadium, and Vegas has tourism.
The Pac 12 could try to add San Antonio, which is in a big city and has a big stadium.
The Pac 12 leaves week 13 open. Every team plays every other team previous to week 13. Other conferences have the opportunity to leave week 13 open, enabling big non-conference games.
The Mountain West added El Paso, Northern Illinois, and North Dakota State. It gave bonuses to Las Vegas and Air Force. Air Force was being courted by the AAC where it could join Army and Navy.
The Mountain West recruited North Dakota State from the FCS. Other FCS teams under consideration include Idaho, Montana, Montana St, and South Dakota St.
The Pac 12 and the AAC are in a strong position for the playoff spot reserved for non-Power4.
The table compares teams outside the Power 4.
The top group is teams with big potential.
The middle group is in big cities but has weak TV ratings.
The bottom group is in small cities and has weak TV ratings.
          Metro  State  Students    Stadium      TV
           mil    mil   thousands  thousands  mil/game

Oregon St      .10   4.3    36         46      1.74    Pac 12   Good TV ratings
Washington St  .05   8.0    22         35      1.08    Pac 12   Good TV ratings
Colorado St    .40   6.0    33         41       .814   Pac 12   Good TV ratings
Boise St       .80   2.0    37         36       .338   Pac 12   Strongest school in the state   Big airport
San Diego St  3.3   39      25         35       .192   Pac 12   Big city   Stadium expandable to 55k
Navy           .041  6.3    40         38      1.09    AAC      Good TV ratings   National fan base
Army           .007 20.0    27         40       .68    AAC      Good TV ratings   National fan base
Tulane        3.8    4.6    24         81       .480   AAC      Big city   Big stadium   New Orleans Saints   Tourism
S Florida     3.2   23.5    31         66       .464   AAC      Big city   Big Stadium   Tampa Bay Buccaneers
Memphis       1.3    7.1    22         58       .336   AAC      Big city   Big stadium   Liberty Bowl
San Antonio   2.8   30      35         64       .288   AAC      Big city   Big stadium   Alamodome
UNLV          2.4    3.2    31         65       .287   MW       Big city   Big stadium   Las Vegas Raiders    Tourism   Strongest school in the state

Rice          7.1   30      18         47       .316   AAC      Big city     Weak TV ratings   Eclipsed by U Houston
Sacramento St 2.5   39      30         21       .2     MAC      Big city     Weak TV ratings
Temple        5.9   13.1    14         69       .173   AAC      Big city     Weak TV ratings   Big stadium   Philadelphia Eagles
Texas St      2.6   30      24         33       .134   Pac 12   Big city     Weak TV ratings   Eclipsed by U Texas
Georgia St    6.4   11.3    14         24       .112   Sun      Big city     Weak TV ratings   Eclipsed by Georgia Tech
Charlotte     2.9   11.2    14         15       .086   AAC      Big city     Weak TV ratings
N Texas       7.6   30      23         31       .071   AAC      Big city     Weak TV ratings   Eclipsed by TCU and SMU

Fresno St     1.2   39      41         41       .196   Pac 12   Small city   Weak TV ratings
Air Force     1.1    6.0    26         52       .178   MW       Small city   Weak TV ratings
N Dakota St    .26    .80   17         19       .16    MW       Small city   Weak TV ratings   Small state   Strongest school in the state
Tulsa         1.0    4.1    20         36       .132   AAC      Small city   Weak TV ratings                 Eclipsed by Oklahoma and Oklahoma St
J Madison      .1    8.9    25         25       .123   Sun      Small city   Weak TV ratings
New Mexico     .96   2.1    16         39       .101   MW       Small city   Weak TV ratings   Small state   Strongest school in the state
UTEP           .88  30      19         52       .097   MW       Small city   Weak TV ratings
N Illinois     .4   12.7    12         31       .097   MW       Small city   Weak TV ratings
Utah St        .05   3.5    17         25       .055   Pac 12   Small city   Weak TV ratings                 Eclipsed by BYU and Utah
Hawaii        1.02   1.4    13         50       .040   MW       Small city   Weak TV ratings   Small state   Strongest school in the state   Tourism
Buffalo       1.1   20.0    17         65       .035   MAC      Small city   Weak TV ratings   Big stadium   Buffalo Bills
Liberty        .26   8.9    97         25       .021   CUSA     Small city   Weak TV ratings
Connecticut    .016  3.7    25         40              Sun      Small city   Weak TV ratings
Delaware       .031  1.1    17         18              CUSA     Small city   Weak TV ratings
Conference realignment saw 5 teams relegated from power conferences and 6 teams promoted to power conferences. The promoted teams are all in the Big 12 and these are TCU, BYU, Utah, Cincinnati, Houston, and UCF. The relegated teams were from the Big East and are Connecticut, Temple, and South Florida.
In 2004, there were 6 power football conferences, one of which was the Big East. The Big East had 12 schools, 9 of which defected to other power conferences. The 3 that didn't were relegated and are now minnows. We went from the Power6 to the Power5.
The Pac 12 once had 12 teams. 10 left for other power conferences, leaving 2 behind. Relegation. We're now down to the Power 4.
Texas Christian University achieved upward mobility by winning the Rose Bowl in the 2010 season, and in 2012 they moved from the Mountain West to the Big 12. They made the national championship bracket in 2022.
The Big Ten and SEC deserve their own tier. We could call them "superpowers". The non-superpowers need to adjust. Some might declare independence. We might see an alliance of independents, and independents might form their own version of a conference championship. They could keep an open week on the schedule for spontaneous games.
The Big Ten and the SEC don't need the NCAA. They could secede from the NCAA and go pro. Other conferences will be forced to follow.
The bowl system needs reform. There will be teams from the Big Ten and SEC that have losing records but are worthy of bowls. The problem can be solved by letting everyone play bowls.
Traditionally, bowl games are between teams that are equally-matched in strength. College football will adopt a 12-team bracket in 2026, and the first two rounds will typically be mismatches. The college football postseason will look like the college basketball postseason.
In the 12-team bracket, many teams will play multiple postseason games. Teams outside the bracket might demand to do so as well.
To decide bowl matchups, there is rarely enough information from interconfence games to properly compare conferences, suggesting that we need more than 1 round of bowls. Notre Dame is often a vital benchmark for interconference strength. It would be nice to have more independents.
The future may see future expansion of the playoffs. There will be fights between conferences over playoff spots.
Number of playoff teams     Years

         0                    <1998
         2                1998-2013     BCS era
         4                2014-2023     Playoff era
        12                2024-
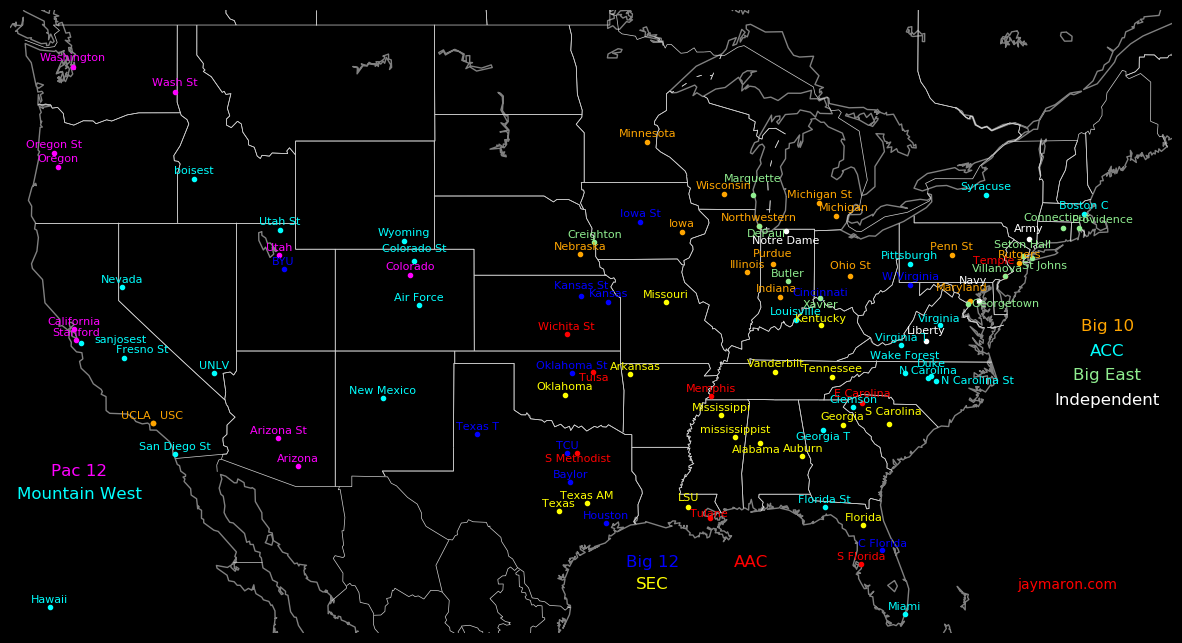
Texas has the most FBS teams and New York is weak.
State    Power 4   FBS   Population (mil)    FBS/Pop

Texas        7      13        30              .43
California   4       7        39              .18
Florida      4       7        22              .32
N Carolina   4       7        11              .64
Ohio         1       8        12              .67
Alabama      2       6         5.1           1.18
Virginia     2       5         8.7            .57
Michigan     2       5        10              .50
Georgia      2       5        11              .45
Louisiana    1       5         4.6           1.09
Indiana      3       4         6.8            .59     Notre Dame is included in the Power 4
Illinois     2       3        13              .23
Pennsylvania 1       3        13              .23
Mississippi  2       3         2.9           1.03
Arizona      2       2         7.4            .27
Arkansas     1       2         3.4            .59
New York     1       3        20              .15
The table shows the last possible day for each event.
Football week 0         Aug 29
First day of class      Aug 31   Monday before Labor Day
Regular season week 1   Sep  5   Saturday before Labor Day
Labor day               Sep  7   1st Monday of September
Thanksgiving            Nov 28   4th Thursday of November
Regular season week 13  Nov 30   Saturday after Thanksgiving
Conf champion day       Dec  7
Bowl week 1             Dec 14
Bowl week 2             Dec 21
Bowl week 3             Dec 28
Bowl week 4             Jan  4
College football could change week 0 to week 1 to give players another rest week, and to increase revenue.
Bowl week 1 should have more games.
On conference championship week, all teams could play.
The conference championship game could be flexible. Sometimes it's strategic to have a conference championship game and sometimes not. Sometimes the conference championship is already decided before the championship game, in which case it's strategic for the top teams to play teams from other conferences. A pre-bowl game. For teams that aren't in the championship game, have them decide amongst themselves who to play. It could be conference games or non-conference games.
In the 2020 covid season, during conference championship week, the Big Ten had all teams play a game. The idea wasn't continued the next season.
In the 2020 season, the game between Liberty and Coastal Carolina was canceled, and Liberty scheduled a game with BYU on 3 day's notice.
The Big Ten has 18 teams and the SEC has 16, forcing them to adjust their scheduling systems. Divisions will be scrapped, and the new systems will favor local games and traditional rivalries.
The Pac 12 is now the Pac 2. Washington State and Oregon State need to make a move. An option is to go independent and dare more teams to follow. Another option is to invite the best of the Mountain West, and this would consist of San Jose State, San Diego State, UNLV, Utah State, Colorado State, Boise State, and Hawaii. Another option is to join the Mountain West.
Yale once had the biggest football stadium. It's simple. A hole in the ground was dug and the dirt became a rim. It's a crater. It had a capcity of 60k. The first game was against Harvard and it sold out.
The Yale bowl inspired more crater-style stadiums, such as at USC and Michigan.
                Capacity   Year

Circus Maximus    300000   -600
Delphi              6500   -350
Roman Colosseum    75000     80
Panatheniac        50000    144
Yale               61446   1914
Manchester, UK     76962   1910   Old Trafford
Glasgow, Scotland 125000   1910   Hampden Park
Ohio State         66210   1922
USC                77500   1923
UCLA               90000   1923   Rose Bowl
Michigan          107601   1927
Some schools have more 4-star recruits than 3-star recruits. The SEC has 11 such schools and the Big 10 has 6.
       5-star  4-star  3-star

Notre Dame  1  14   9

Georgia     5  20   2
Texas AM    1  20   4
LSU         2  19   2
Auburn      1  17   8
Alabama     3  16   2
Florida     1  16  10
Tenn        1  16   8
Texas       5  14   6
S Carolina     13  13
Oklahoma    1  11   6
Missouri       11   6
Miss           10  12
Kentucky        7  14
Miss St         4  24
Arkansas        3  20
Vanderbilt      2  11

Penn St        20   8
Ohio St     3  18   5
Oregon      3  15   1
Michigan    2  15   7
Nebraska       12   8
USC         1  12  12
Washington      8  19
Wisconsin       7  16
Maryland        6  15
Rutgers         4  25
Iowa            4  12
Minnesota       3  19
UCLA            2  20
Michigan St     1  17
Illinois        1  21
Indiana         1  22
Purdue          1  13
Northwestern    0  20

Miami          16   5
Florida St     13  10
Clemson     1   6   8
In college football, the regular season matters. The postseason consists of only one bowl game.
Home field advantage matters more for the NFL than for the NBA, hence the NFL regular season is more important than the NBA regular season.
For any given sport, the fewer teams in the playoffs, the more important the regular season. MLB has only 12 postseason teams.
The English Premier League has no postseason. The winner is decided purely by the regular season.
     Playoff   Total
      teams    teams

MLB     12     30
NFL     14     32
NHL     16     32
NBA     16     30
 |
|---|
In the NFL, each regular season win tends to increase the playoff seed by 1.
The following table gives the average number of regular season wins for each seed, using data from 2007-2016. The regular season has 16 games.
Seed   Wins   Privilege

  1    13.3   Home field for the quarterfinal and semifinal.  Wildcard bye
  2    12.1   Home field for the quarterfinal.                Wildcard bye
  3    10.9   Home field for the wildcard game.
  4     9.2   Home field for the wildcard game.
  5    11.0
  6    10.0
Seeds 1-4 go to division winners and seeds 5-6 go to the best records among the remaining teams.
 |
|---|
Home field advanage can be especially important for cold-weather teams like the Packers.
 |
|---|
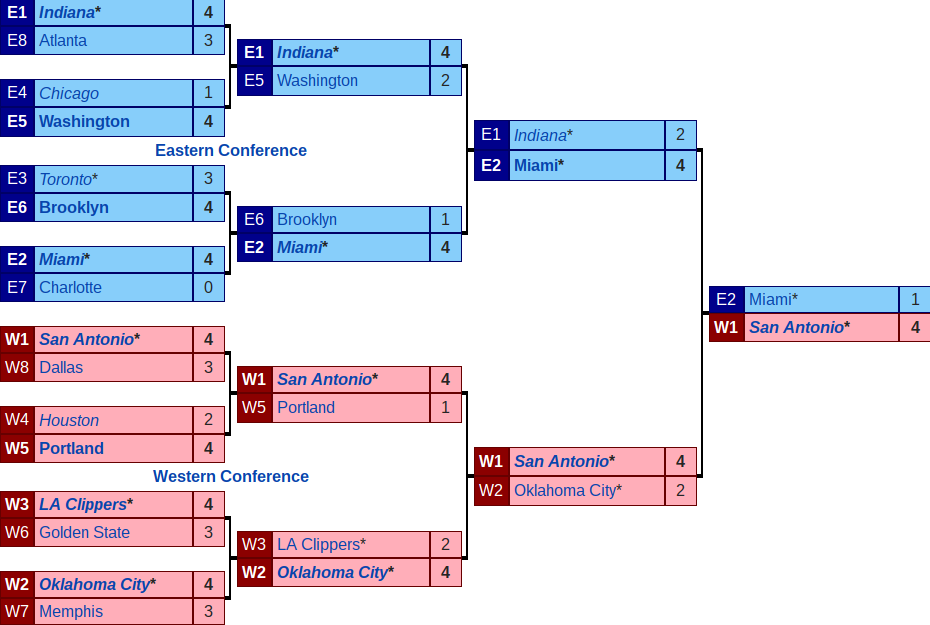
In the NBA, the regular season has little impact on the playoffs. For example, suppose the Milwaukee Bucks are the best team and they win the conference and gain the #1 seed. In the conference playoffs they can expect to face the 8th, 4th, and 2nd seeds. If the Bucks decide to slack and place 8th, they can expect to face the 1st, 2nd, and 3rd seeds in the playoffs. But since the Bucks are the best team, the 1st seed is the 2nd best team, the 2nd seed is the 3rd best team, etc.
                                                      Rank of teams played in playoffs

If the Bucks play hard and place 1st in the conference:   2nd, 4th, and 8th
If the Bucks slack and place 8th in the conference:       2nd, 4rd, and 3rd
No matter what, the Bucks will face the 2nd and 4th ranked team. The only difference
between playing hard and slacking is that they have to play the 3rd ranked team
instead of the 8th ranked team.
The following table gives the average number of games won by each seed, using data from 2009-2016. The regular season has 82 games. The difference between the 1st and 8th seeds is typically 20 games. That's a lot of slack.
Seed   Wins

  1    60.8
  2    55.9
  3    52.2
  4    49.9
  5    47.6
  6    45.2
  7    43.7
  8    41.9
                     Regular  Post-   Regular  Post-   Oligarch  Postseason       Oligarch
                     season   season  season   season  leagues   format           leagues
                     games    games   teams    teams

Football    Pro           17    4       32     14       -      Knockout
Football    College       12    4     Many     12       4      Knockout           Big10, SEC, Big12, ACC
Football    High School    9    5       64     32       -      Knockout
Basketball  Pro           82   24       30     16       1      Knockout           NBA
Basketball  College       30    6     Many     64      10      Knockout           Big10, Big12, Pac10, SEC, ACC, East, AAC, MW, WC, A10
Soccer      England Pro   38    -       20      -       1      None               Premiere League
Soccer      England Cup    -             -    763       -      Knockout
Soccer      World Cup      -    7        -     48       2      Group, knockout    Europe, South America
Soccer      Euro Champ L   -   14        -     76       6      Group, knockout    England, Germany, Italy, Spain, France, Portugal
Baseball    Pro          162            30     12       1      Knockout           MLB
Hockey      Pro           82            32     16       1      Knockout           NHL
Hockey      College       35          Many     16       2      Knockout           Big10, National Collegiate Hockey Conf
Rugby       Eng Pro Men   18    2       10      4       1      Knockout           Premiership Rugby
Rugby       Eng Pro Women 16    2        9      4
Rugby       World Cup                 Many     20       2      Group, knockout    4-Nations, 6-Nations
Rugby       College             4     Many     16       2      Knockout           Division 1A, Varsity Club
Wrestling   College       24    5     Many     32       2      Knockout           Big10, Big12
Golf        PGA           43    3      100     70       1      Overall score      PGA
Tennis      ATP           70    5     Many      8       1      Group, knockout    20 tournaments/player
UFC                        2.5  0      600      -       1      Champ vs challenger
Formula-1                 24    ?       24      -       -
Indy Car                  17    ?
NASCAR                    36    ?       59     16       -
Chess                     75   14     Many      8       -      Candidates tournament
LoL         College                   Many      8       -      Knockout
Golf        PGA          100   12      250     70       2      Overall score      PGA, LIV
The Rugby Championship is a double round robin between New Zealand, Australia, S. Africa, and Argentina.
6 Nations Rugby is a round robin between England, France, Wales, Scotland, Ireland, and Italy.
The Rugby Pacific Nations Cup is a round robin between Fiji, Japan, Samoa, and Tonga.
The three rugby leagues are rare examples where there is no postseason.
 |
|---|
College players get 5 years of eligibility and unlimited transfers. This expands the importance of lower-tier schools because elite players may decide to go to such schools as underclassmen. This means less red-shirting.
More college playing time helps build stars before they enter the NFL.
The NFL is saturated. Expansion can only come from a minor league.
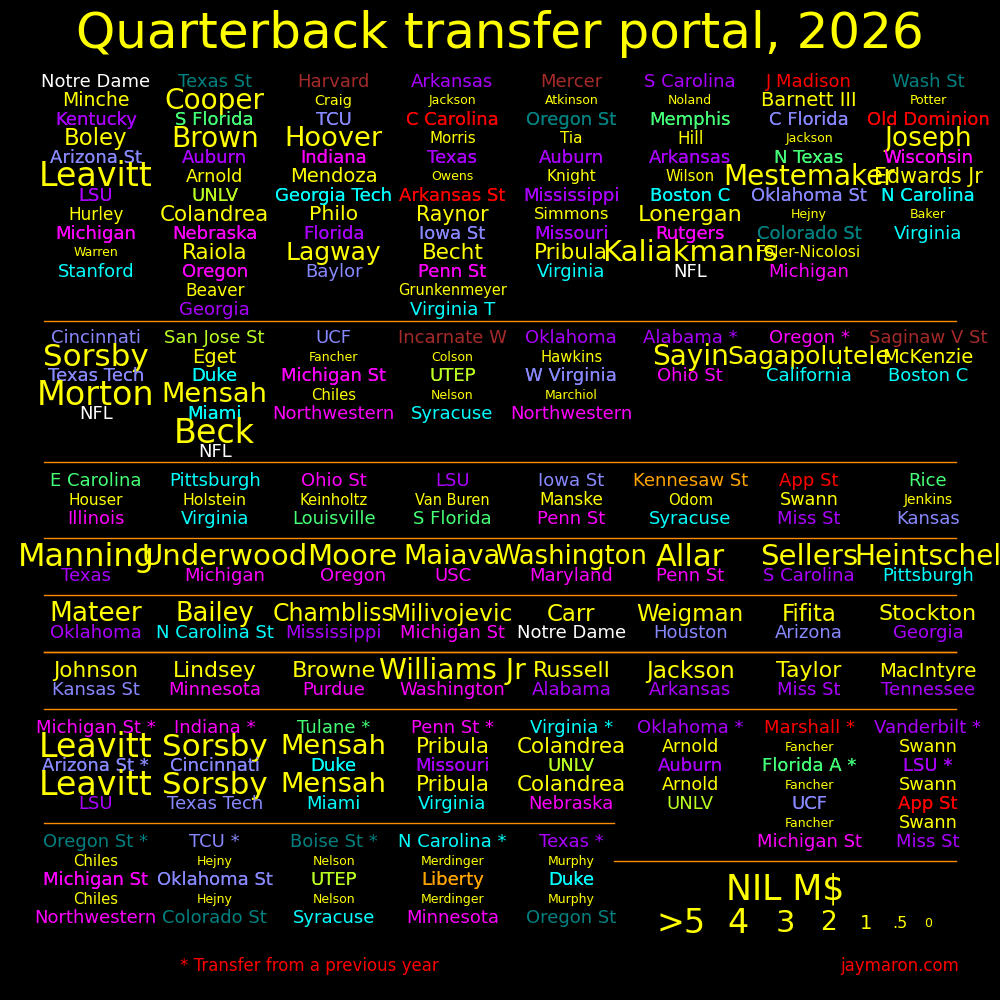
Transfers often have fallout. A transferring player leaves a hole that's often filled by a transfer. A transfering player often triggers a player on the destination team to transfer.
Quarterback transfers are especially prone to fallout. There are transfer chains that involve multiple players with big NIL value.
Round  #        NFL draft 2026                   NFL 2027 draft rank from Sports Illustrated

  1    1  Indiana     Mendoza      B1G           1  Moore       Oregon       B1G
  1   13  Alabama     Simpson      SEC           2  Manning     Texas        SEC
  3    1  Miami       Beck         ACC           3  Sellers     S Carolina   SEC
  4   10  Clemson     Klubnik      ACC           4  Mestemaker  Oklahoma St  B12
  5   38  N Dakota St Payton       MV            5  Sorsby      Texas T      B12
  6    1  Arkansas    Green        SEC           6  Hoover      Indiana      B1G
  7    7  Rutgers     Kaliakmanis  B1G           7  Carr        Notre Dame   Ind
  7   18  Texas T     Morton       B12           8  Maiava      USC          B1G
  7   33  LSU         Nussmeier    SECSayin      9  Sayin       Ohio St      B1G
                                                10  Leavitt     LSU          SEC
ESPN:
           2025  B1G SEC B12 ACC  Other
 1  Ohio State    2    *
 2  Oregon        5    *
 3  Georgia       3        *
 4  Notre Dame   11                    Independent
 5  Texas        13        *
 6  Indiana       1    *
 7  Miami        10                *
 8  Texas Tech    4            *
 9  Mississippi   6        *
10  Texas AM      7        *
11  LSU                    *
12  BYU          12            *
13  Oklahoma      8        *
14  Michigan     18    *
15  Penn St            *
16  Alabama       9        *
17  Washington         *
18  Utah         15            *
19  Iowa               *
20  USC          16    *
21  Louisville                     *
22  SMU                            *
23  TCU                        *
24  Houston      21            *
25  Tennessee              *
39  Boise St                           Pac 12
59  UNLV                               MW
63  Navy                               ACC
68  N Mexico                           MW
70  Memphis                            ACC
71  S Dakota St                        Missouri Valley
72  N Dakota St                        MW
73  UTSA                               ACC
76  E Carolina                         ACC
77  J Madison                          Sun
78  Fresno St                          Pac 12
79  Air Force                          MW
80  USF                                ACC
81  Miami Ohio                         MAC
83  Army                               ACC
84  Hawaii                             MW
85  Washington St                      Pac 12

 -  Vanderbilt   14
 -  Arizona      17
 -  Virginia     19
 -  Tulane       20
 -  Georgia T    22
 -  Iowa         23
 -  J Madison    24
 -  N Texas      25
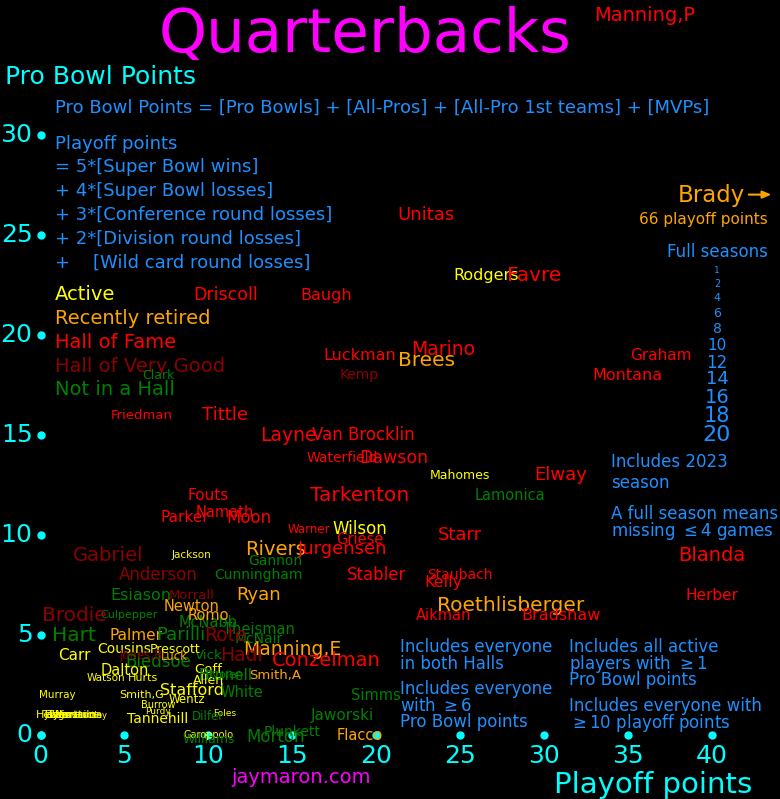
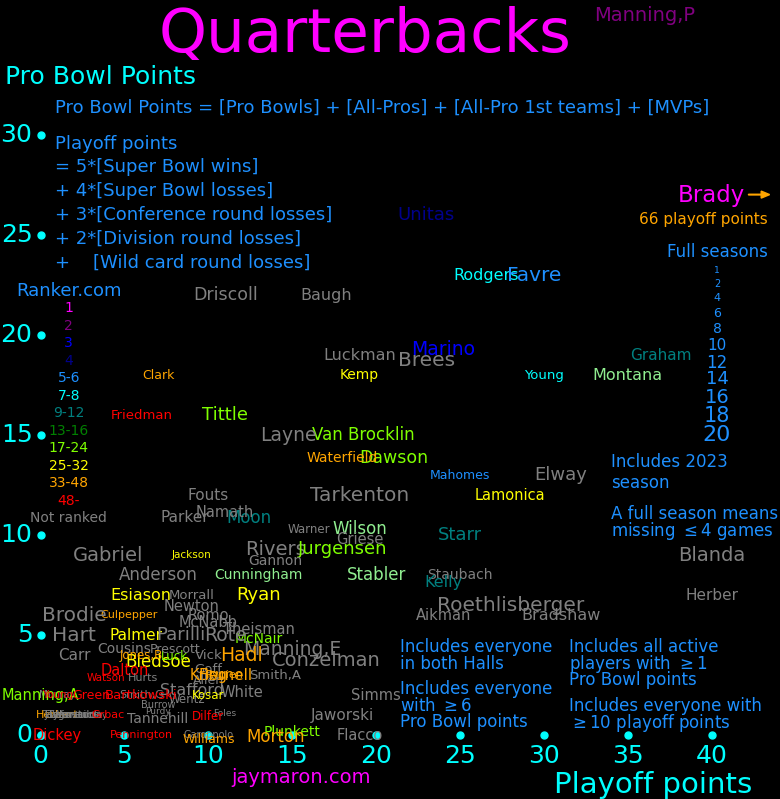
The contenders for quarterback GOAT are Manning, Unitas, and Rodgers. Brady has retired and may be eclipsed by Rodgers.
To quantify quarterbacks, we use Pro Bowls and playoff success.
 |
|---|
Everyone with at least 10 Pro Bowl points is in the Hall of Fame.
Among quarterbacks that are active or recently retired, the ones guaranteed the Hall are Brady, Rodgers, Brees, Roethlisberger, and Mahomes, and Wilson. Rivers is on the bubble.
There are Hall of Famers with few Pro Bowl points but big postseason success, such as Bradshaw and Aikman.
Kemp, Lamonica, and Clark should be in the Hall of Fame. They have overwhelmingly enough points.
Roethlisberger will make the Hall because of postseason success.
Young quarterbacks have won MVPs in recent years, such as Mahones, Newton, and Jackson. Many young playes make the Pro Bowl.
Ranker.com has a quarterback ranking, which reflects the public's feelings. The public tends to favor playoff points over pro bowl points.
 |
|---|
It has happened only once that a quarterback was MVP but not all-pro 1st team, and the quarterback is Elway.
The MVP is a quarterback 2/3 of the time.
The NFL MVP award began in 1957, and the first Pro Bowl was 1951. The NFC and AFC each designae 3 pro bowl quarterbacks. The NFL selects a quarterback as all-pro 1st team, and another as 2nd team.
Rodgers outclasses Brady head-to-head. For the years in which they both played the full season:
       Rodgers      Brady

2009   Pro Bowl     Pro Bowl
2010   -            MVP
2011   MVP          Pro Bowl
2012   All-Pro #1   Pro Bowl
2014   MVP          Pro Bowl
2015   Pro Bowl     Pro Bowl
2016   Pro Bowl     All-Pro #2
2018   Pro Bowl     -
2019   Pro Bowl     -
2020   MVP          -
2021   MVP          All-Pro #2
During this time, Rodgers has 4 MVPs and Brady has 1. Rodgers has 10 pro bowl appearances and Brady has 8.
Manning outclasses Rodgers head-to-head, but by a small margin. For the years in which they both played the full season:
       Rodgers       Manning

2008   -             MVP
2009   Pro Bowl      MVP
2010   -             Pro Bowl
2011   MVP           -
2012   Pro Bowl #2   Pro Bowl #1
2013   -             MVP
2014   MVP           Pro Bowl
2015   Pro Bowl      -
Manning has 3 MVPs and Rodgers has 2. Manning has 6 Pro Bowls and Rodgers has 5.
Timeline:
1920       NFL begins
1939-1942  All-Star games
1951       First Pro Bowl
1960       AFL begins
1966       First Super Bowl, between the NFL and the AFL
1969       AFL final season
1970       First season with the NFC-AFC format
1983-1985  United States Football League
1994       NFL salary cap starts
2024       First season of the United Football League
 |
|---|
The official world golf rankings are decided by the OWGR, a board with 7 members. The OWGR is a smoke-filled room whose methodology isn't public. The board consists of:
Board member                        Tournaments

The PGA Tour                        The Tour Championship, The Player's Championship
The PGA European Tour
International Golf Federation
The US Golf Association             U.S. Open
The PGA of America                  PGA Championship
Augusta National                    Masters
R&A Golf Club of St. Andrews        British Open
Two board seats go to the largest tours, which are the PGA Tour and the PGA European Tour. Another seat goes to the International Golf Federation, which administers amateur golf plus a set of pro golf tours. Four seats go to the owners of the Majors, which are The U.S. Open, The PGA Championship, The Masters Tournament, and the British Open.
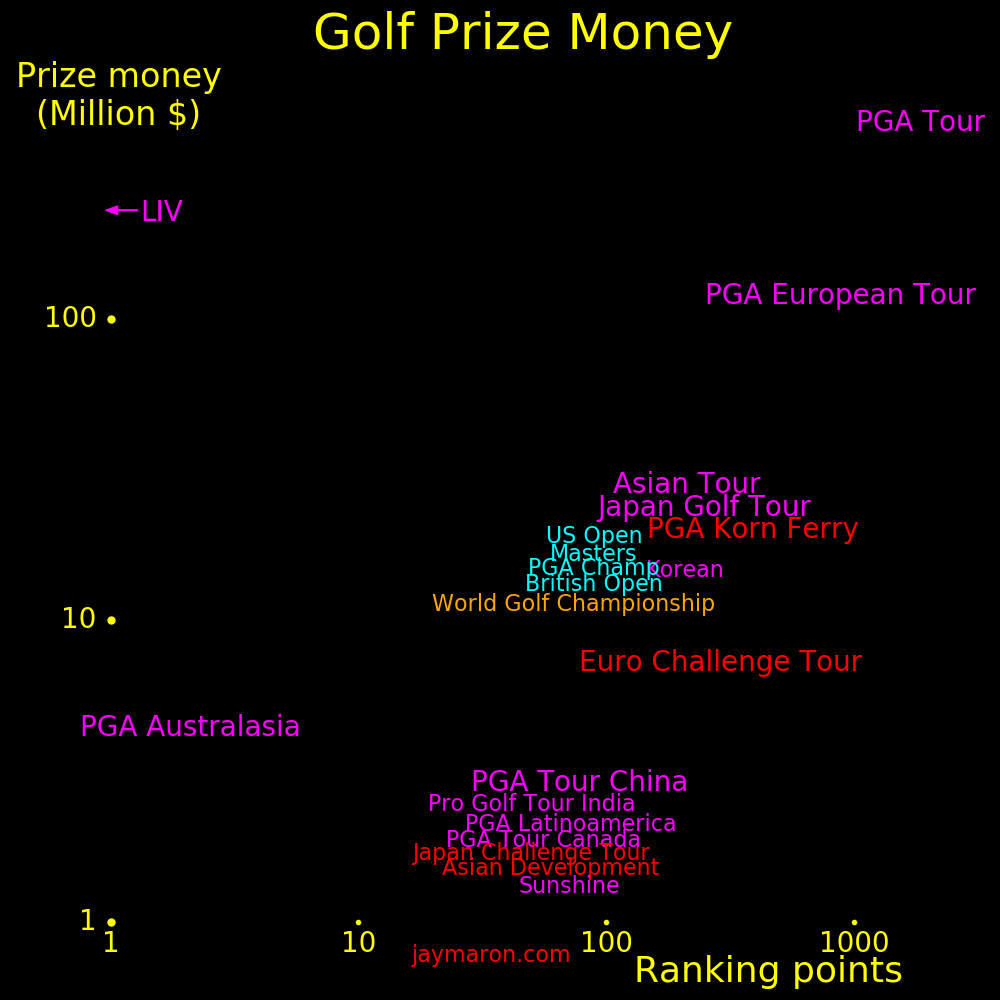
Each tour has a season prize money total and a season ranking points total. The LIV is the second largest tour by money and gets no ranking points.
The PGA Tour bans players that play LIV. Nevertheless, many PGA Tour players joined LIV. PGA Tour members are holding conferences to discuss the matter, and there will likely be antitrust lawsuits.
The OWGR is generous to small tours. The smaller the tour, the larger the ratio of points/money tends to be.
Many 2nd tier tours are funded by a 1st tier tour, such as the PGA Korn Ferry Tour.
The European Tour has a set of premier events called the "Rolex Series", namely The Scottish Open, The BMW PGA Championship, The Abu Dhabi Golf Championship, and the Dubai Desert Classic. Each has a purse of $8 million. The European Tour final event is the DP World Tour Championship Dubai, with a purse of $10 million.
Season totals:
                 Money   Points  Points/Money
                  M$              Points/M$

PGA Tour           428   1786     4.2
LIV                225      0     0
PGA European Tour  119    886     7.4
Asian Tour          25    211     8.4
Japan Golf Tour     21    249    11.9
PGA Korn Ferry      20    364    18.2       USA
Korean Tour         14.6  145     9.9
Euro Challenge Tour  7.2  290    40.3
PGA Austalasia       4.4    2.1    .5
PGA Tour China       2.7   78    28.9
Pro Golf Tour India  2.3   50    21.7
PGA Latinoamerica    2.10  72    34.3
PGA Tour Canada      1.53  56    36.6
Japan Challenge Tour 1.53  50    32.7
Asian Development    1.5   60    40.0
Sunshine             1.42  71    50.0       Africa

U.S. Open           17.5  100     5.7     Major
Masters             15    100     6.7     Major
PGA Championship    15    100     6.7     Major
The Open Champ      14    100     7.1     Major. British Open

Player's Champ      20     80     4.0
The Tour Champ       -     39     -       Final PGA tournament
World Golf Champ    12     74     6.2
"PGA Tour" includes all tour events except the majors and The Tour Championship.
 |
|
|
|---|---|---|
The Hall snubs steroid cheaters, including Bonds, Clemens, Rodriguez, Sheffield, Ramirez, McGwire, Sosa, and Pettitte.
Admission to the Hall requires 75% of the vote, and if you don't make it after 10 years of voting, you're removed from the ballot. The votes are:
               2022  2023  2024  2025  2026   Years   Steroids  Homers  OBS+  ERA  In Hall
                %     %     %     %         on ballot                              of Fame

Ichiro Suzuki                    100                             117   .757          *
CC Sabathia                       87                                         3.74    *
Adrian Beltre               95                                   477                 *
Joe Mauer                   76                                   143                 *
David Ortiz     78                                               541   .931          *
Todd Helton     52    72    80                                   369   .953          *
Scott Rolen     63    76                                         316   .855          *
Billy Wagner    51    68    74    82                                         2.31    *
Carlos Beltran        46    57    70    84                       435   .837          *   Cheated at the World Series by stealing signs
Andruw Jones    41    58    62    66    78                       434                 *
Chase Utley                 29    40    59     3                 259
Andy Pettitte   11    17    14    28    48     8         *                   3.85
Felix Hernandez                   21    46     2
Alex Rodriguez  34    36    35    37    40     5         *       696   .930
Bobby Abreu      9    15    15    20    31     7                 288   .870
Jimmy Rollins    9    13    15    18    25     5                 231
Cole Hamels                             24     1
Dustin Pedroia                          21     2
Mark Buehrle     6    11     8    11    20     6                             3.81
Omar Vizquel    24    20    18    18    18     9                  80
Franc. Rodriguez      11     8    10    12     4
Torii Hunter     5     7     7     5     9     6                 353
David Wright                 6     8    15     3

Barry Bonds     66                           Out         *       762  1.051
Mark McGwire                                 Out         *       583   .982              Highest percentage was 24%
Sammy Sosa      18                           Out         *       609   .878
Roger Clemens   65                           Out         *                   3.12
Gary Sheffield  41    55    64               Out         *       509   .907
Rafael Palmeiro                              Out         *       569   .885              Highest percentage was 4%
Manny Ramirez   29    33    32    34    39   Out         *       555   .996


Babe Ruth                                                        714  1.164          *
Ted Williams                                                          1.116          *
Lou Gherig                                                            1.080

Aaron Judge                                                           1.028              Active
Mike Trout                                                             .976              Active
Shohei Ohtani                                                          .957              Active
Juan Soto                                                              .948              Active
"Years on ballot" is the number of years they've been on the ballot as of 2025.
Each elector gets 7 votes.
Jim Devlin was a pitcher with an ERA of 1.90, but was banned from baseball for colluding with gamblers.
All retired players with at least 493 home runs made the Hall of Fame, except for steroid cheats.
              Homers   Steroids  In Hall of Fame   OBS+

Barry Bonds      762      *                       1.051
Hank Aaron       755                *
Babe Ruth        714                *                       2.277 ERA
Albert Pujols    703                               .918     Retired in 2022
Alex Rodriguez   696      *                        .930
Willie Mays      660                *
Ken Griffey Jr.  630                *
Jim Thome        612                *
Sammy Sosa       609      *                        .878
Frank Robinon    586                *
Mark McGwire     583      *
Harmon Killebrew 573                *
Rafael Palmeiro  569      *
Reggie Jackson   563                *
Manny Ramirez    555      *
Mike Schmidt     548                *
...
Gary Sheffield   509      *
Miguel Cabrera   507                      Active
Nelson Cruz      459                      Active
Aaron Judge      220                      Active
Aaron Judge holds the single-season home run record if you exclude steroid cheats.
                Homers   Year   Steroids

Barry Bonds       73     2001     *
Mark McGwire      70     1998     *
Sammy Sosa        68     1998     *
Aaron Judge       62     2022
Roger Maris       61     1961
Babe Ruth         60     1927
Babe Ruth         59     1921
Giancarlo Stanton 59     2017
Jimmy Foxx        58     1932
Hank Greenberg    58     1938
Ryan Howard       58     2006
Mark McGwire      58     1997     *
Luis Gonzalez     57     2001
Alex Rodriguez    57     2002     *
 |
|---|
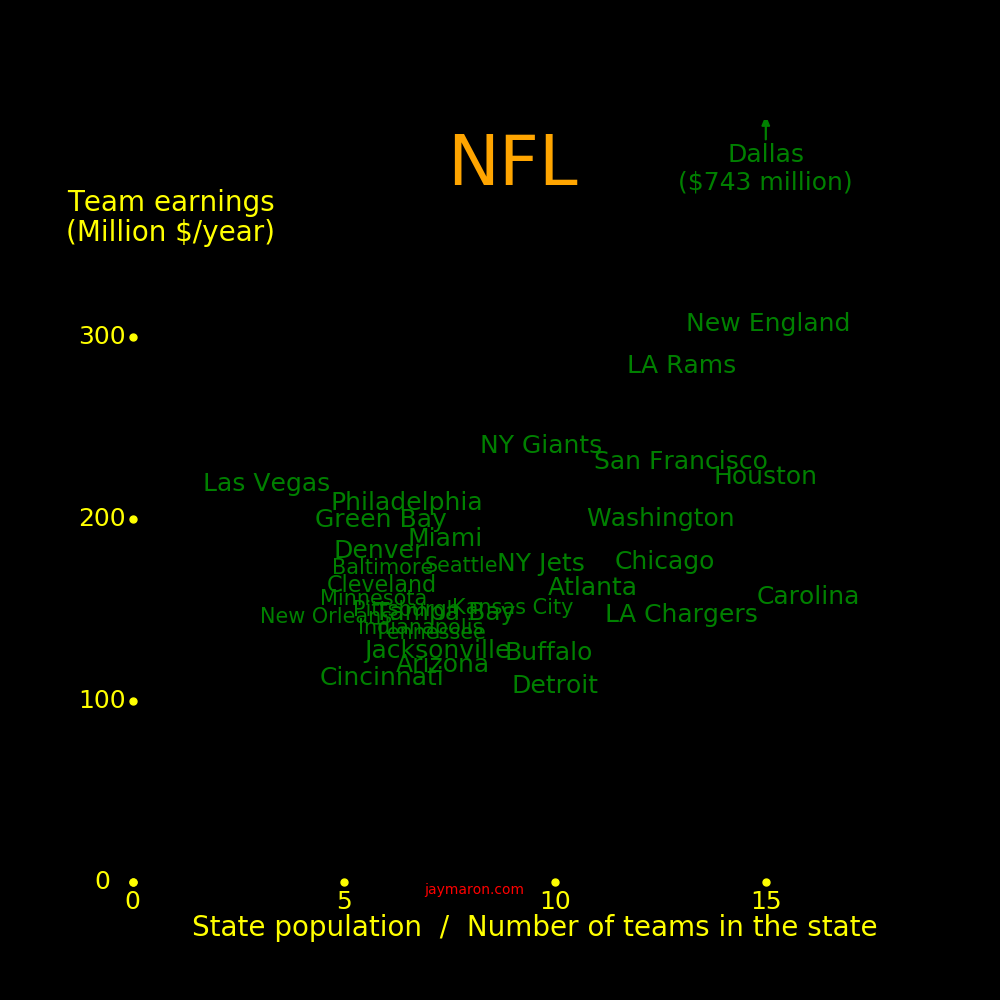
The NFL gets revenue from TV and merchandise and shares it equally between teams. League revenue is $344 million/team/year, 52% of which goes to players and the rest goes to owners. Teams also make their own revenue from tickets and other sources that averages $190 million per team, much less than league revenue.
Teams have widely varying team revenue. Many make more than 300 million/year and many make less than 150 million/year. Owning an NFL team is a secure investment. You could have weak ticket sales and still make money from league revenue, and the league is paying the players. The NFL is a good club to be in.
 |
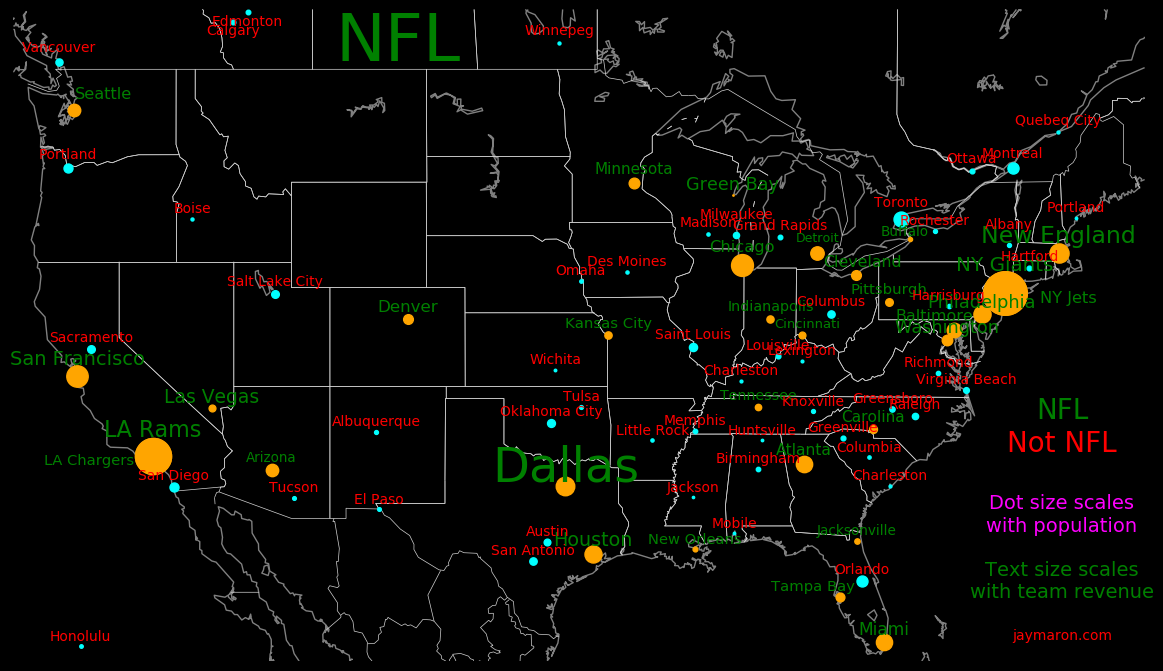
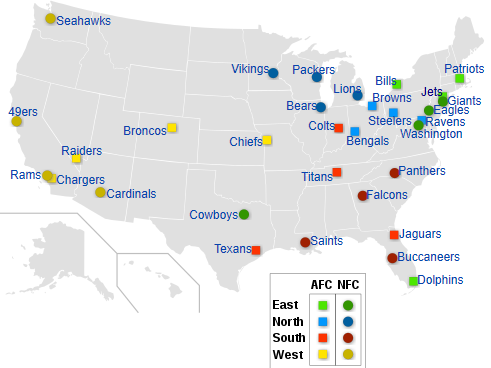
|---|
Many states don't have an NFL team but lean toward a nearby NFL team. For the Patriots' state population, we include Massachusetts, Connecticut, Rhode Island, Maine, New Hampshire, and Vermont. For the Panthers, we include North and South Carolina. For the Chiefs, we include Kansas and Missouri. For the Broncos, we include Colorado, Wyoming, Montana, and Idaho.
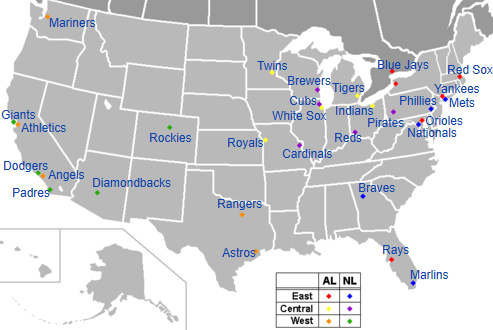
 |
 |
|---|---|
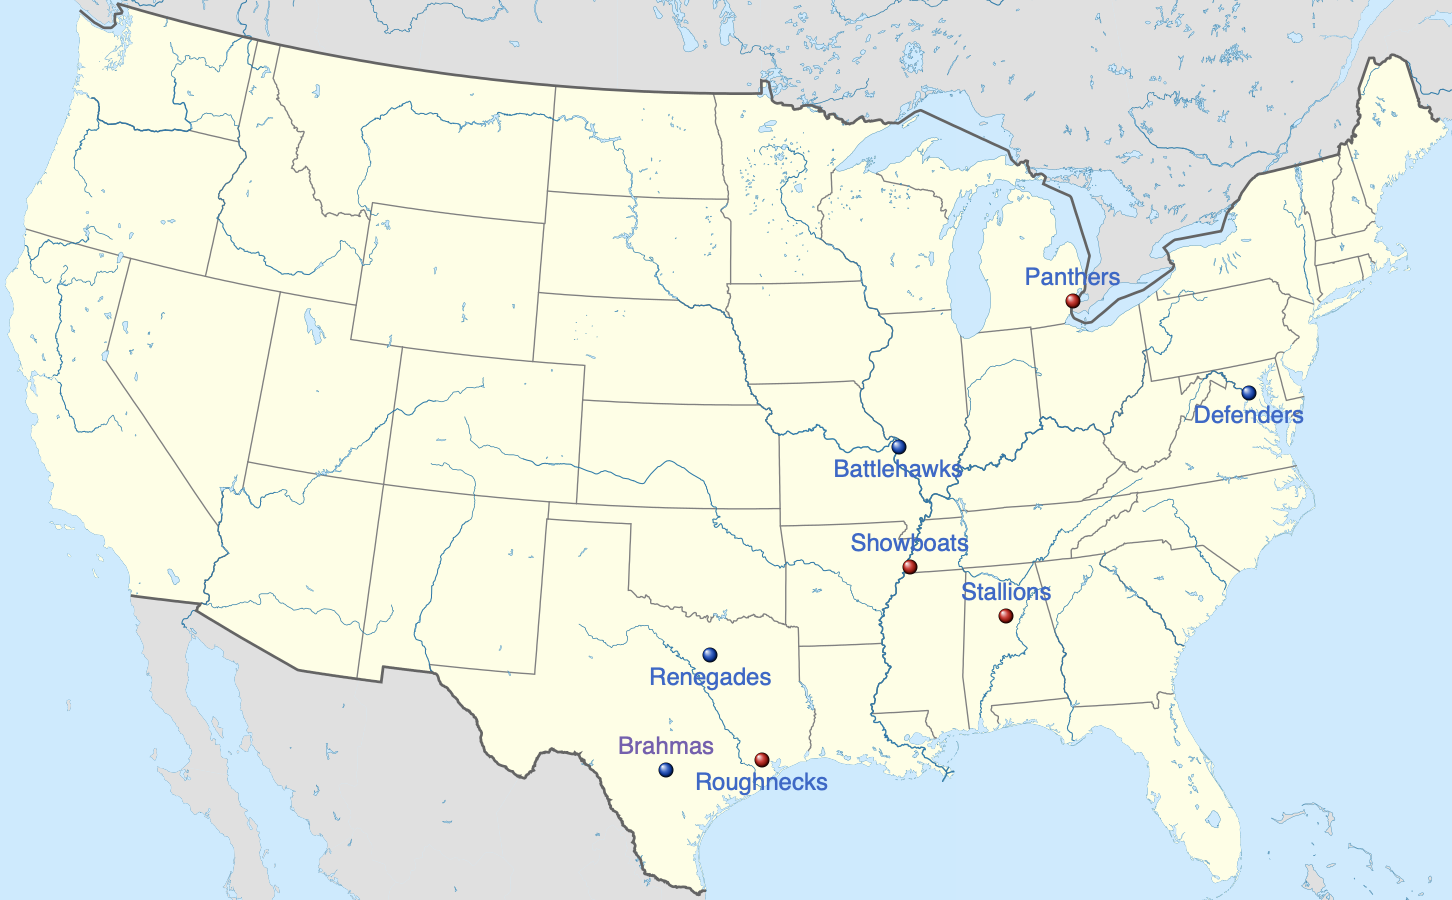
The United Football League has teams where there is no NFL team, at San Antonio, Saint Louis, Memphis, and Birmingham.
The most obvious place for a new team is San Antonio, because it's a big market, because Dallas and Houstion have big team earmings, and because Texas is the 2nd-most populous state. The states with 3 teams are California, Florida, and New York.
Oklahoma City and Salt Lake City are good places for a new team. Both have NBA teams.
San Diego and Saint Louis once had NFL teams but lost them. Portland and Sacramento are in poor economic shape. Orlando and Columbus don't deserve a team because there are nearby NFL teams and the nearby teams have weak revenue. Birmingham hosted all USFL games but the city lost money and the league had weak revenue. The XFL teams in markets without an NFL team are San Antonio, Saint Louis, and Portland.
In Canada, the big markets are Toronto, Montreal, and Vancouver.
The places that deserve a new team are San Antonio, Oklahoma City, Salt Lake City, Toronto, Montreal, Europe, and Asia. A weak team could move to a better market. A team could also play in multiple cities, bringing games to small markets.
The Bills could change its name to the Great Lakes Bills and play most of its games in Toronto, while keeping a subset of games at Buffalo.
The name "Carolina" is diplomatic because it doesn't specify a city, and because it encompases both North and South Carolina. The stadium is on the border of the 2 states.
The name "Tennessee" is diplomatic. The team is at the center of the state and it's near the north border with Kentucky. The team could have been called the Appalachia Titans, and could potentially play games in Tennessee, Kentucky, Alabama, Arkansas, and West Virginia.
The big college stadiums that are far from an NFL team are Oklahoma, Oklahoma State, Nebraska, Iowa, Iowa State, West Virginia, Arkansas, Kentucky, and Oregon. There are no big stadiums in Montana or its surrounding states. The big stadiums in Canada are in Montreal, Edmonton, and Vancouver. Toronto's stadium is small.
NFL teams are worth on average $4.5 billion and the Cowboys are worth $7.6 billion. Entering a new team in the NFL would likely cost at least $6 billion.
NFL Europe ran from 1995-2007. In the final season there were 5 teams were in Germany and 1 in Amsterdam. The German teams were Frankfurt, Rhein, Berlin, Cologne, and Hamburg. There were once teams in London, Scotland, and Barcelona, but they were replaced by German teams.
Many nations can support an NFL team, such as Canada, Mexico, England, France, Germany, Spain, Italy, Japan, South Korea, Taiwan, and India. These nations have lots of large stadiums. The NFL has played 33 games in London, 5 in Mexico City, and 1 in Germany.
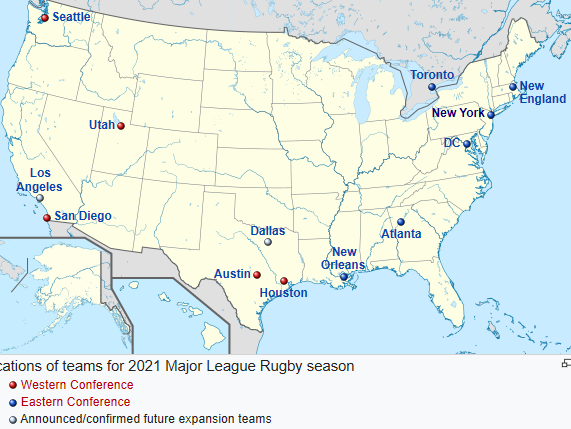
America has a pro rugby league 12 teams and an ESPN contract, and this is an opportunity for markets without an NFL team. At present, all pro rugby teams are in big markets. It costs 4 million dollars to enter a team into Major League Rugby. Most American colleges have a rugby team.
 |
|---|
Green Bay is a small town and the Packers have big team revenue.
 |
|
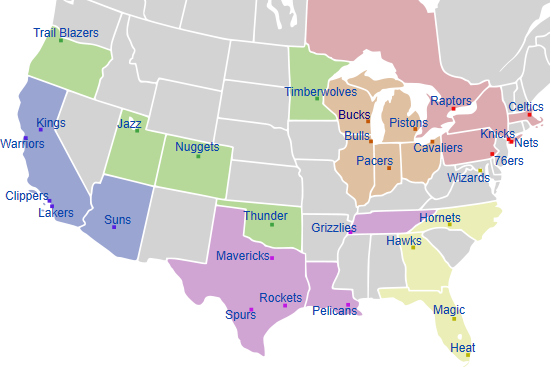
|---|---|
NFL, NBA, and MLB teams tend to be in the same places. The markets with an NBA team and no NFL team are Oklahoma, Sacramento, Portland, Salt Lake City, and Toronto. The markets with an NFL team and no NBA team are Las Vegas, Seattle, Kansas City, Tampa Bay, and Buffalo. We consider Jacksonville and Orlando to be the same market, and we consider Green Bay and Milwaukee to be the same market.
The large markets that don't have an NFL, NBA, MLB, or NHL team are Virginia and Montreal.
 |
 |
|---|---|
 |
 |
|---|---|
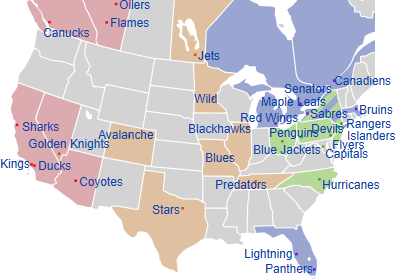
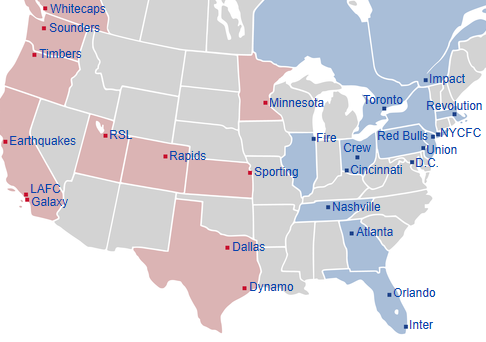
NHL and MLS teams are often in different places from NFL teams.
 |
 |
|---|---|
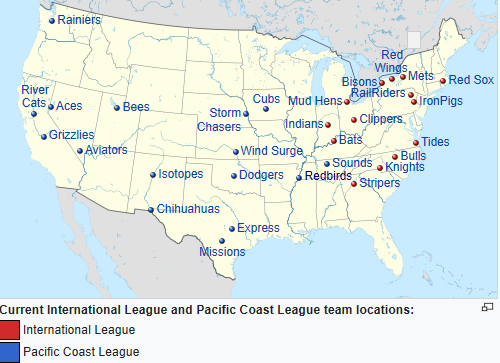
Baseball AAA teams exist in places without major league teams.
The biggest stadiums are:
 |
|---|
Teams have an average attendance of 570,000 people/year, the average ticket price is $107, and the average team ticket revenue is $61 million.
In 2022, the Packers got $344 million of league revenue and $235 million of team revenue, totaling $579 million. Expenses were $501 million and profit was $78 million. League TV revenue is $312 million and local TV and radio revenue is $92 million. The Packers' team revenue is:
                     %   Million $

Local TV & radio    39     92
Tickets             20     47
Merchandise         16     38
Property            15     35
Concessions          6     14
Luxury boxes         5     12
The Packers' team expenses are:
                     %

Players             61
Administration      14
Team expenses       12
Marketing           10
Game expenses        3
Revenue:
                         Million $

NFL                        17000
American college football   4000
Canadian Football League     180
USFL                          50
Fan Controlled Football       20
XFL                           14
Arena Football League         13
The playoffs are 10% of TV viewership. For 2022,
            Viewers/Game   Total viewers
              millions       millions

Super Bowl        112         112
Conference round   50         100
Divisional round   36         144
Wildcard round     29         174
Regular season     16.7      4540
A team needs a city and a stadium. For states without an NFL team, the candidates are:
            City      Metro pop  State pop  Stadium   Stadium site
                         Mil        Mil     capacity

Oklahoma    Oklahoma C  2.8       3.9       86112     Oklahoma U
Utah        Provo       2.7       3.4       63470     Brigham Young U
Iowa        Iowa City    .28      3.2       70586     Iowa U
Iowa        Ames         .89      3.2       61500     Iowa State U
Nebraska    Lincoln      .26      2.0       86047     Nebraska U
W Virginia  Morgantown   .11      1.8       60000     West Virginia U
The NFL could open up to interleague play by eliminating the salary cap.
Buying into a league costs money.
League            Revenue  Buy-in  Average    Crowd   Ticket   Games  Teams  Teams outside   Expansion candidates
                  B$/year    M$    pay (M$)  average  average  /team              USA

Football    NFL        19     ~4000  2.7       69000    297     17     32        0
Baseball    MLB        11     ~2000  4.2       27000     79    162     30        1     Vegas
Basketball  NBA        10.3   ~2000  7.7       18100     80     82     30        1     Vegas, Seattle, Vancouver
Hockey      NHL         5.3     650  3.2       17700    146     82     32        7     Houston, Kansas City, Quebec C, Toronto
Soccer      MLS         1.6     325   .051     22100     32     34     30        3     Vegas
Rugby       MLR         ~.4       4   .04       2200            16      8        1     Teams are folding
Golf        PGA                   -            18000    100     48

Football    NCAA        4.0           .1                        12               0
Football    CFL          .2                                             9        9
Football    UFL          .1           .1                                8        0
Football    Arena        .013                                          16        0

Basketball  WNBA         .54     50   .12      11000     35     44               0
Soccer      NWSL                 50   .038     11000     35     30     16        0     Atlanta, Austin, Cincinnati, Salt Lake, Columbus, San Francisco
Soccer      USLS                      .037                              9        0
Hockey      PWHL                      .015                              7        2
Rugby       WER                                                         6        0
Ultimate    PUL                       .001                             10        0
Ultimate    WUL                       .001                              8        0

Soccer      England 1   6.6     400            38000            38     20       20     Promotion/relegation system
Baseball    Japan 1     1.18                   31000                   12       12
Cricket     India 1     1.18                   30000                   12       12
Rugby       Australia 1  .96                   33000                   18       18
Rugby       England 1    .25                   14500                   11       11
Football    Canada 1     .18                   23000                    9        9
Formula-1                                     297200                   10

Taylor Swift concert                           68200    204      72
Las Vegas and Seattle just built NHL stadiums, which can also be basketball stadiums. A hockey sideline is 5.5 meters farther out than a basketball sideline. They just established NHL teams and they're looking to establish NBA teams.
NFL teams range in value from 3 to 8 billion dollars. English Premiere League soccer teams are worth between .5 and 5 billion dollars.
Moves and exits:
                      Old team          New team         Year

Football   NFL        Oakland Raiders   Las Vegas        2020
                      SD Chargers       LA Chargers      2017
                      St. Louis Rams    LA               2016
                      Houston Texans    Tennessee Titans 1997
                      LA Raiders        Oakland          1995
                      LA Rams           St Louis         1995
                      St Louis Cardinal Arizona          1988
                      Baltimore Colts   Indianapolis     1984
                      Oakland Raiders   LA               1982
Basketball  NBA       New Jersey        Brooklyn         2012
                      Seattle           Oklahoma City    2008
                      Charlotte         New Orleans      2002
                      Vancouver         Memphis          2001
Soccer      Women's   Utah              Kansas City      2020
                      Boston Breakers   Exit             2017
                      Kansas City       Utah             2016
                      W New York Flash  North Carolina   2016
Rugby       MLR       Austin            Exit             2023
                      Los Angeles       Exit             2023
                      Colorado          Exit             2020
Basketball  Women's   San Antonio       Las Vegas        2018
                      Tulsa             Dallas           2016
                      Detroit           Tulsa            2010
                      Sacramento        Exit             2009
                      Houston           Exit             2008
                      Charlotte         Exit             2006
                      Utah              San Antonio      2003
                      Orlando           Connecticut      2003
                      Cleveland         Exit             2003
                      Miami             Exit             2002
                      Portland          Exit             2002
Regions with lots of teams:
          Football  Basketball  Baseball  Hockey  Soccer  Rugby  Soccer  Basketball  Hockey   Rugby  Cricket  Softball
            Men        Men        Men      Men     Men     Men   Women     Women     Women    Women    Men     Women

New York City   2        2          2        3       1       1     1        1           1      1        1
Los Angeles     2        2          2        2       2       1     1        1                           1
San Francisco   1        1          2        1       1             1                           1        1
Chicago         1        1          2        1       1             1        1                  1
Philadelphia    1        1          1        1       1
DC              1        1          1        1       1       1     1        1                           1
Boston          1        1          1        1       1       1              1           1      1
Dallas          1        1          1        1       1       1              1                           1       1
Minneapolis     1        1          1        1       1       1              1           1      1
Miami           1        1          1        1       1       1
Denver          1        1          1        1       1                                         1
Phoenix         1        1          1        1                              1
Milwaukee       1        1          1                                                                                Packers included
Las Vegas       1        *          1        1       *                      1
Salt Lake City           1                           1       1     1
Houston         1        1          1        *       1       1     1                                            3
Atlanta         1        1          1                1       1              1
Detroit         1        1          1        1
North Carolina  1        1                   1                              1
Tennessee       1        1                   1       1
Seattle         1        *          1        1       1       1     1        1           *              1
Tampa Bay       1                   1        1
Indianapolis    1        1                                                  1
New Orleans     1        1                                   1
Kansas City     1        1                   *       1             1
Baltimore       1                   1
Saint Louis              1                   1       *
Toronto                  1          1        1       1       1                          1
Salt Lake City           1                           1       1     1
Oklahoma City            1
San Antonio              1                           *             1
Portland                 1                           1             1
San Diego                           1                        1     1
Montreal                                     1                                          1
Vancouver                                                                               *
Ottawa                                                                                  1
A "*" indicates that an expansion team is under consideration.
                            Court  Court  Court  Court  Court   Tier  Courts
                             #1     #2     #3     #4     #5

New York C   U.S. Open       23.8   14.0   8.1    2.8    1.7    Slam    22
London       Wimbledon       15.0   12.3   4.0    2.0    3.0    Slam
Melbourne    Australian O    14.8   10.5   7.5    5.0    3.0    Slam
Paris        French Open     15.2   10.1   5.0    2.2           Slam
Miami        Miami Masters   13.8    5.2  ~2     ~2             1000    26
Cincinnati   Cincinnati Mast 11.4    5.0   4.0    2.0           1000
Indian Wells Indian Wells    16.1    8.0   4      2             1000
Paris        Paris Masters   15.5                               1000
Rome         Italian Open    10.0    5.0   3.7                  1000
Madrid       Madrid Open                                        1000
Toronto      Canadian Open   12.5                               1000
France       Monte Carlo M                                      1000
Shanghai     Shanghai Master 13.8    5.0   2.0                  1000
Rotterdam    Rotterdam Open  15.8                                500
Beijing      China Open      15.0   10.0   4.0    2.0            500
UAE          Dubai Champ.    18.0   17.0  15.0                   500    Hamden 14
Qatar        Qatar Open      15.5   15.3                         500
Cairo                        20.0   16.9
Saudi Arabia                  5.0    2.0                                GPYW, King Abdullah
The table shows the contributons for stadium constructon.
                                 Team  Public  Private  Total  Year
                                  M$     M$      M$      M$

Buffalo Bills      Buffalo        350    850    200    1400  Future   NFL
Tennessee Titans   Nashville      840    500    760    2100  Future   NFL
Las Vegas Raiders  Las Vegas     1100    750      0    1850    2020   NFL + college football + Las Vegas Bowl
Los Angeles Rams   Los Angeles                         5500    2020   NFL + LA Bowl
Las Vegas Knights  Las Vegas       56      0    319     375    2017   NHL
Atlanta Falcons    Atlanta                             1500    2014   NFL + Peach Bowl + SEC conf champ game
Minnesota Vikings  Minneapolis                         1100    2013   NFL
San Francisco 49   San Francisco                       1300    2012   NFL + San Francisco Bowl
New York Giants    E. Rutherford                       1700    2010   NFL + XFL
Dallas Cowboys     Dallas                              1480    2009   NFL + Cotton Bowl
The sports industry has inertia that resists rules reform and the invention of news sports. Most sports have awkward rules and better sports are possible. The most glaring need is for a better tackle sport, because the rules for football and rugby are awkward.
Rules should be simple and elegant. Good examples include soccer, hockey, and tennis, and bad examples include football, rugby, baseball, and basketball.
Football has the negative that it requires many refs.
A sport should accomodate a diversity of body types. Rugby has roles for everyone, regardless of size. Basketball overemphasizes height.
A sport should minimize equipment. Football and hockey require excessive equipment, whereas soccer requires only a ball.
For football, the XFL courageously experiments with the rules.
Rugby and soccer have too many players.
Either the number of players can be reduced or the number of balls can be increased.
|
|---|
|
|---|
The Yale stadium was once the biggest football stadium. It's a simple crater carved from dirt. The USC and Michigan stadiums are craters.
                       Size    Year

Circus Maximus        300000   -600
Delphi                  6500   -350
Roman Colosseum        75000     80
Panatheniac            80000    566
Yale                   61446   1914
USC                    77500   1923
Michigan              107601   1927
Indianpolis Speedway  400000
 |
 |
 |
|---|---|---|
A new sport should have the following features:
Rules should be compact and simple. Soccer rules are compact and football rules aren't. The football rulebook is thick.
The sport should be easily refereed. Football needs too many referees.
Height and mass shouldn't be excessively important. Wrestling has the virtue of weight classes. Basketball should have height classes.
The front row seats should be close to the field.
The field shouldn't be excessively large.
The number of players needed for a team shouldn't be excessively large.
Equipment should be minimalist.
The ball should be light enough to be throwable by women.
The sport should emphasize fundamental skills, like balance, maneuverability, and hand-eye coordination.
No position should be excessively important. A football quarterback is excessively important.
Make it easier to score. Add territory behind the goal, like hockey.
Increase goal width. Don't increase height. Goal height is already appropriate for a goalie of average height.
Delete the offsides rule. It's unnatural and requires extra policing.
Decrease the number of players or increase the number of balls.
Have a net that can adjust for either tennis, pickleball, volleyball, etc. Give tennis courts lines for pickleball.
The ball is loud. Design a quieter ball. Same for foosball.
The tennis serve is too powerful. Find ways to weaken it. Perhaps a slower ball.
Probability that the server wins the game:
                   Men    Women

U.S. Open          .82     .69    Hard court
Australian Open    .82     .67    Hard court
Wimbledon          .86     .74    Grass
French Open        .77     .62    Clay
Tennis scoring has the virtue that you can make a comeback even if way behind. On the other hand, you don't know how many sets a match will have. Other sports could adopt a scoring system analogous to tennis, which eliminates trash time. For example, a football game could be played with 5 periods, with 1 point for winning a period and half a point for tying. Play overtime if necessary.
Sports should have multiple kinds of turf. Football has grass and artificial turf. It has indoor and outdoor stadiums.
Tennis has diverse surfaces.
Make the goal substantially wider and taller.
Make the goalie wear a standard jersey. Not oversized. Make the pads minimum width. Use a standard stick.
Make the puck rounded at the edges to be easier to lift.
Have a period that's 5-on-5. Or, have 7-on-7 with 2 pucks.
Eliminate the kick. It's too powerful.
Eliminate the lineout. If the ball goes out of bounds, treat it like a soccer throw-in, and require that the pass be backward.
Eliminate the scrum. It's dangerous.
Have a version of the game with 11 players.
Have more than 1 referee.
Delete rucks. If you get the ball to the ground, you get a clean restart.
You get a maximum of 4 downs before the ball turns over.
Have an overhead drone to call forward passes and knocks. Equip the ball with sensors.
The goalpost legs are at the 0 yard line. Move them back and out of the end zone, like football goalposts.
Ping pong is perfect. It fits indoors. You can be skilled even if not athletic.
Widen fairways at the range of 300 yards to reward heavy hitters.
Outlaw putters that are longer than a driver.
Rangefinders improve the speed of amateurs.
Penalize slow players.
Allow players with a weak drive to use a hot ball for drives.
A hot ball increases the skill demands for driving.
Let the crowd cheer when the player is shooting. A pro should be able to hit precisely even if there's noise.
Allow colorful attire for professional golf.
 |
|
 |
|---|---|---|
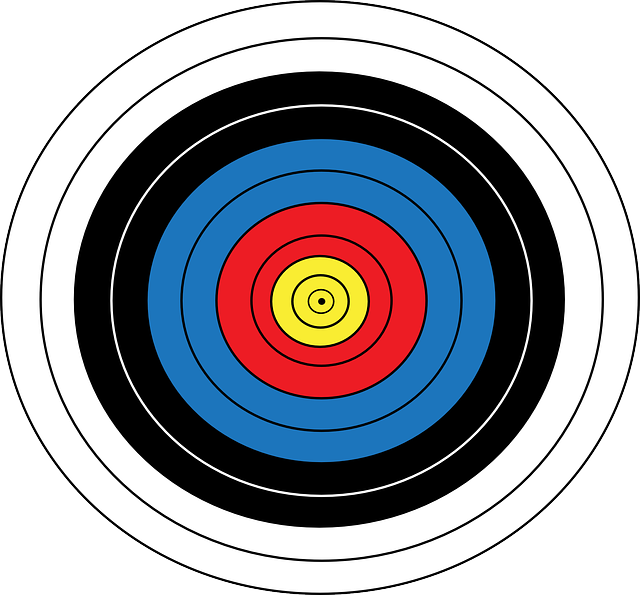
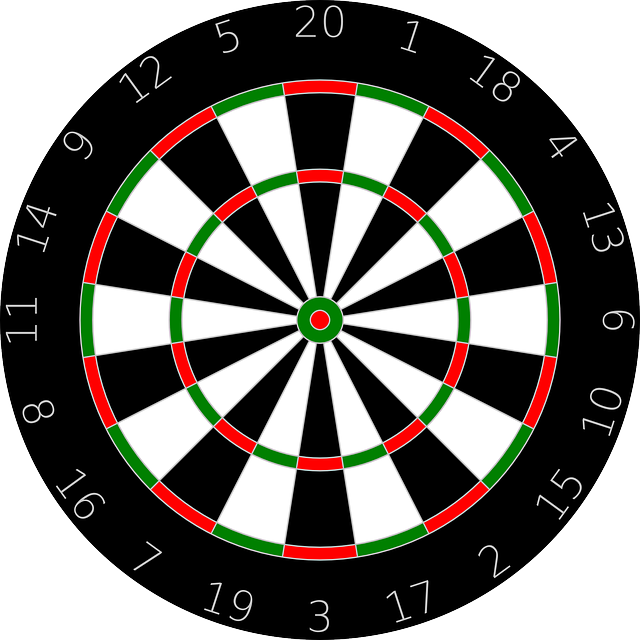
A dart board should be like archery, with concetric scoring.
Make the dart board an oval, more tall than wide, because vertical accuracy is less than horizontal accuracy.
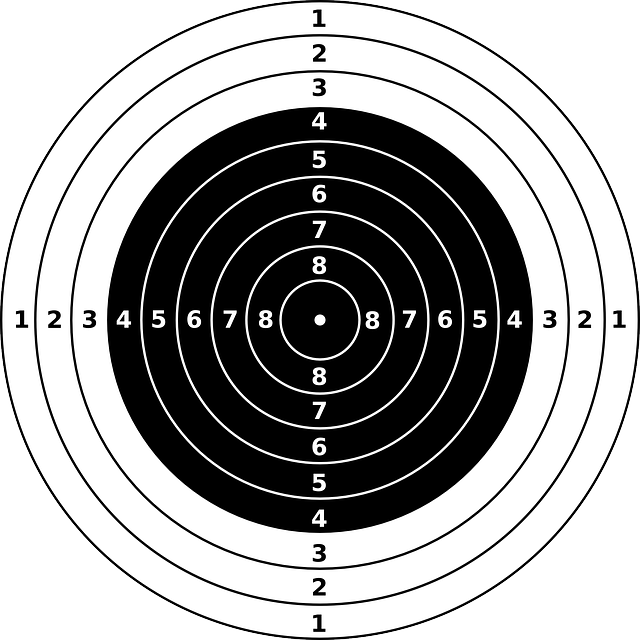
An archery target has rings that are all the same width. Rings should widen as they go out. For example:
  N    Points   Ring outer
                  radius

  1      8         1
  2      7         1.5
  3      6         2
  4      5         3
  5      4         4
  6      3         6
  7      2         8
  8      1        12
You could further make ring radii exponential, where "1.5" is replaced by "sqrt(2)". "3" is replaced by "2*sqrt(2)", etc.
Ring radius = 2(N-1)/2
Ring area   = π 2N-2   except for the ring "N=1", which has an area of pi
It may be desirable to make the inner ring smaller, to preserve the progression of ring areas. Perhaps make the inner ring radius "3/4".
If the projectile radius is a substantial fraction of ring width, it may be desirable to move ring radii inward.
Eliminate the catch rule. Be able to wantonly hurl balls at people without worry.
Use foam balls, like Nerf balls.
Use points. If you score a hit, it's a point. Don't remove the hit player. Keep the game sporting.
Delete the kickoff. It's dangerous.
Give the ball sensors that can measure its precise position, especially the positions of the ends of the football.
Give the uniforms sensors. Knee sensors can measure the instant that a knee touches the turf, and football sensors can measure where the football is at this moment.
Equip tables with sensors and mechanics to keep them level.
Have 2 cue balls, one for each player.
Have 2 black balls, one for each player.
Have more than 7 object balls per player.
Have a variation involving putting. Use large balls.
Wrestling has weight classes. Basketball should have height classes. For example, specify 5 height classes, and there must be a player on the court that satifies each class. Or, specify an overall height, and the combined height of players on the court must be less than the overall height.
Delete the 3 point rule.
Delete the paint rule.
Delete free throws. They're boring. If there's a foul, give 2 points.
Mic the players and give fans options for which mics to hear. Also mic the sidelines.
Equip balls and uniforms with electronics.
A human carries another human in the style of piggy back. The human on top has a long racquet capable of reaching the ground.
Keg throw & stone throw.
Coins can be billiard balls. Use a coin to bump another coin, or use a chopstick to bump a coin.
The bigger the coin, the better. Also good to have a variety of sizes.
Teflon has a low coefficient of friction.
You can make an object with a tuneable coefficient of friction by putting a sphere inside a ring. The sphere rolls and the ring slides.
Friction coefficients:
         Static  Sliding

Teflon       .04
Ice          .1    .02
Cotton       .3
Chromium     .41
Wood         .44   .40
Polystyrene  .5
Glass        .95   .4
Steel        .77   .52
Rubber      1.16
Copper      1.6
Gold        2.5
The "Newton length" is the distance a ball travels such that it encounters a mass of air equal to the ball mass.
The distance of the world record throw for any given ball is around 4 times the Newton length. For an average person, the distance is around 3 times the Newton length. For a ball hit by a racket, world record is around 6 times the Newton length.
A ball can be designed such that strong and tall people don't have an excessive advantage. The ball should be light enough to be throwable by a weak person, and it should be large enough to be unpalmable. The surface is smooth to make it harder to palm. The parameters are:
Ball diameter    =  D      =   240  mm        (diameter of a basketball)
Ball mass        =  M      =   150  gram      (mass of a baseball)
Air density      =  ρ      =  1.22  kg/meter3
Newton length    =  X  =  4 M / (π ρ D2)  =  2.7 meters
              Ball   Ball  Court   Court   Ball   Fastest   Max       Drag
            diameter Mass  length  width  density  shot   distance  distance
               mm    gram  meter   meter  gram/cm3  m/s    meter      meter


Ping pong        40      2.7   2.74   1.525  .081    31.2              1.8
Golf             43     46                  1.10     94.3   214.2     25.9
Superball, Med   32
Billiards        59    163     2.84   1.42  1.52     15.6             48.7
Tennis singles   67     58    23.77   8.23   .368    73.2             13.4
Cricket throw    72    160   145             .82     44.8   128.6     32.8   80 meters from batter to home run boundary
Pickleball       74     24    13.41   6.10   .151
Baseball throw   74.5  146   122             .675    46.9   135.88    27.3   Pitcher-batter distance = 19.4 m
Softball throw   97.1  188                   .39             97.
Football throw  178    420   109.73  48.76   .142    26.8    69.5     13.8
Rugby           191    435   100     70      .119    21.46            12.4   Throw
Bowling         217   7260    18.29   1.05  1.36                     160
Soccer kick     220    432   105     68      .078    35.84             9.3
Basketball      239    624    28     15      .087                     11.4
Suppose a result is binary, either success or fail. The success probability should be as close as possible to 1/2.
The more points per game, the fewer draws.
                           Scores   Points   Draw frac

Football NFL                 3.38      22.9    .005    2.07 touchdowns, 1.31 field goals
Soccer Eng. Premiere League  1.38       1.39   .26
Hockey NHL                   3.1        3.1    .22
Baseball MLB                 4.5        4.5    .95
Basketball NBA              55        115.5    .06     13.7 3-pointers, 28.5 2-pointers, 17.1 free throw successes
Rugby, English Premiership   5.1       23      .035    4.05 tries, 1.1 field goals, .05 drop goals
Tennis should weaken the serve so that the probability that the server wins the game is lowered to .5.
Information is maximized if the probability of success is .5. If the probability of success is "x", the information is
Information = -[x log2 x + (1-x) log2 (1-x)]

  x    Information

  1      0
 3/4      .81
 1/2     1
 1/4      .81
 1/8      .54
 1/16     .34
  0      0
Baseball probabilities:
Single         .175
Double         .04
Triple         .006
Home run       .025
Walk           .08
Hit by pitch   .0125
Strike out     .225
Ground out     .19
Fly out        .18
Force out      .07
Double play    .074
Error          .015

On base total  .34
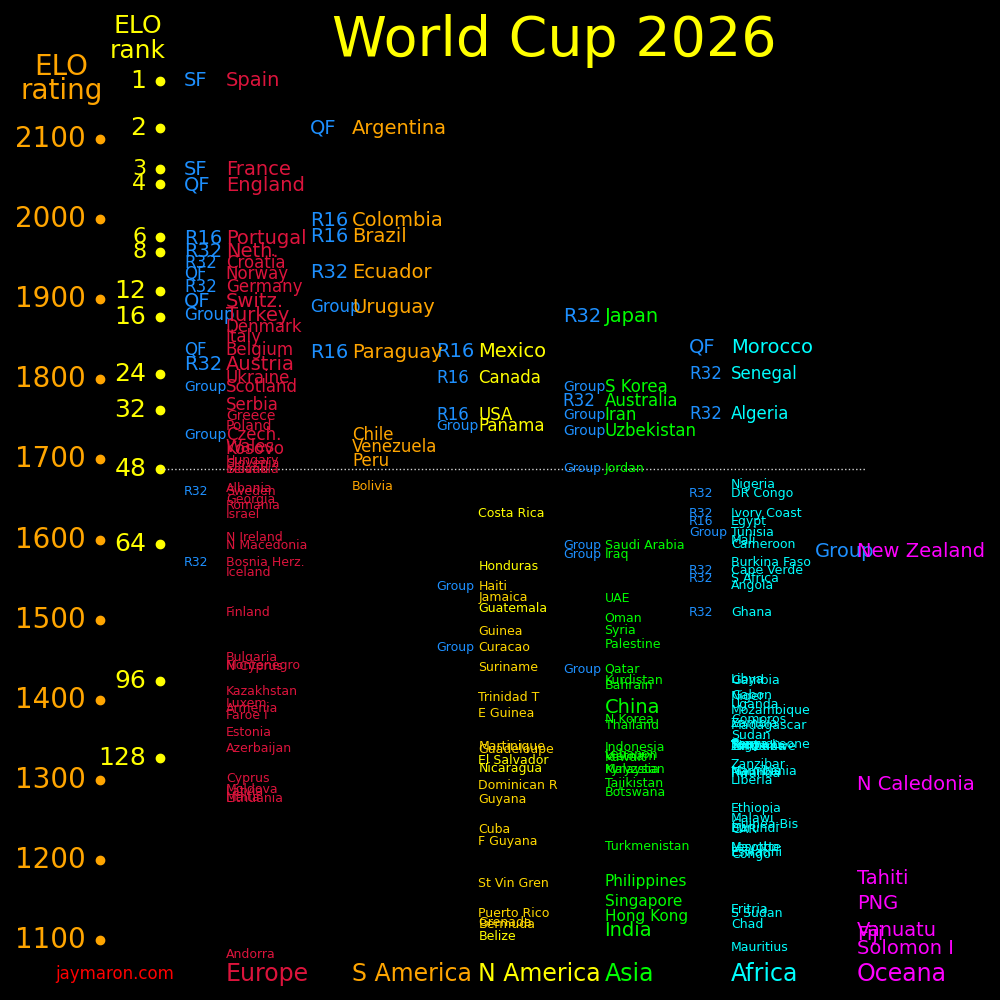
Teams from Europe and South America tend to do well and teams from Africa and Asia tend to do poorly. The number of qualifying places for each region is out of balance with the strength of the region.
The strong teams that didn't qualify in 2026 are Italy, Denmark, and Ukraine. Italy didn't qualify for the past 3 World Cups.
Many sports face the challenge of deciding bids for the postseason tournament, where bids are distributed among conferences. There is often bickering over bids. World Cup regions are like American college football conferences. The World Cup is dominated by Europe and South America, and football is dominated by the Big Ten and Southeastern Conference.
 |
|---|
In the table, results are summed over 2006-2026. A blank entry is a "0". Only one team outside Europe and South America made a semifinal.
     Teams in the   Teams ranked in   Round   QF   SF  Final  Win
    2026 World Cup  top 48 in 2026    of 16

Europe     16             26           47     32   18    9    5
S America   6              9           23     11    5    3
N America   6              4           11      2
Africa     10              3            8      3    1
Asia        9              6            7
Oceana      1              0
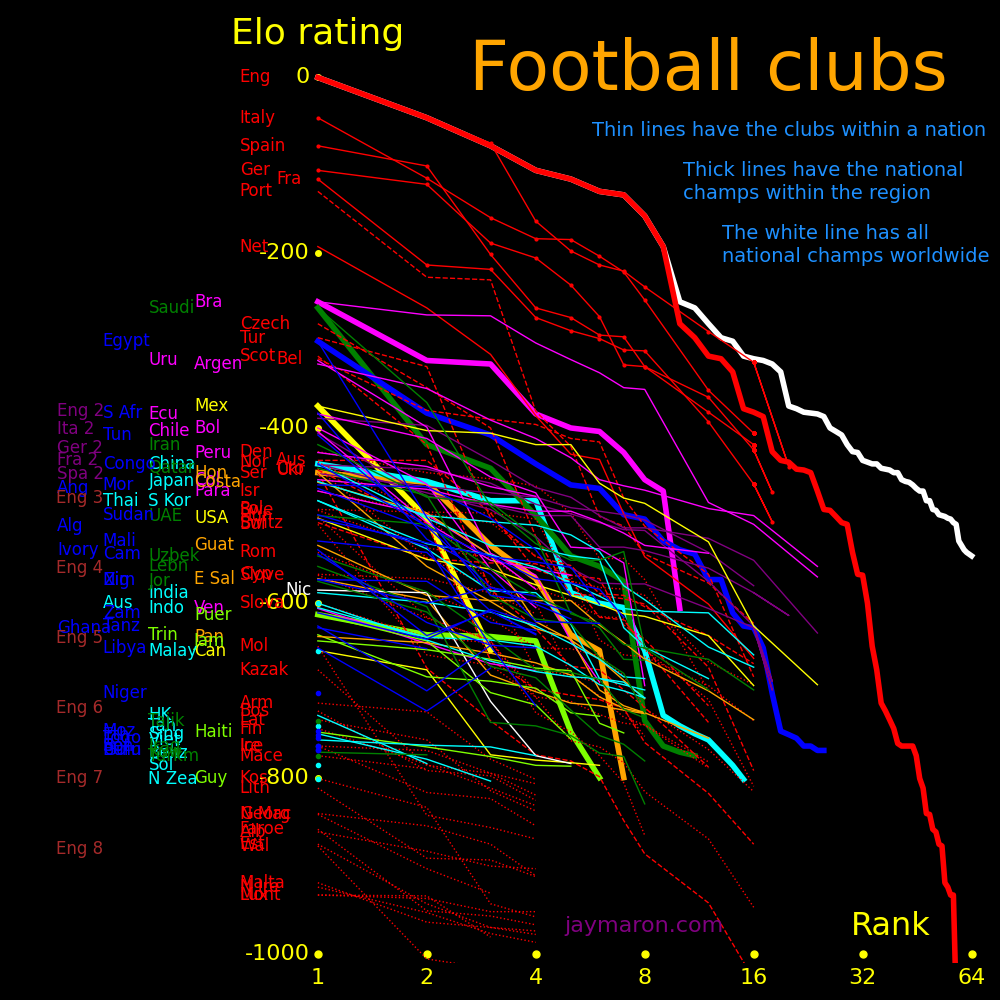
Europe has the strongest club leagues. South America is next strongest and is stronger than Asia and Africa.
 |
|---|
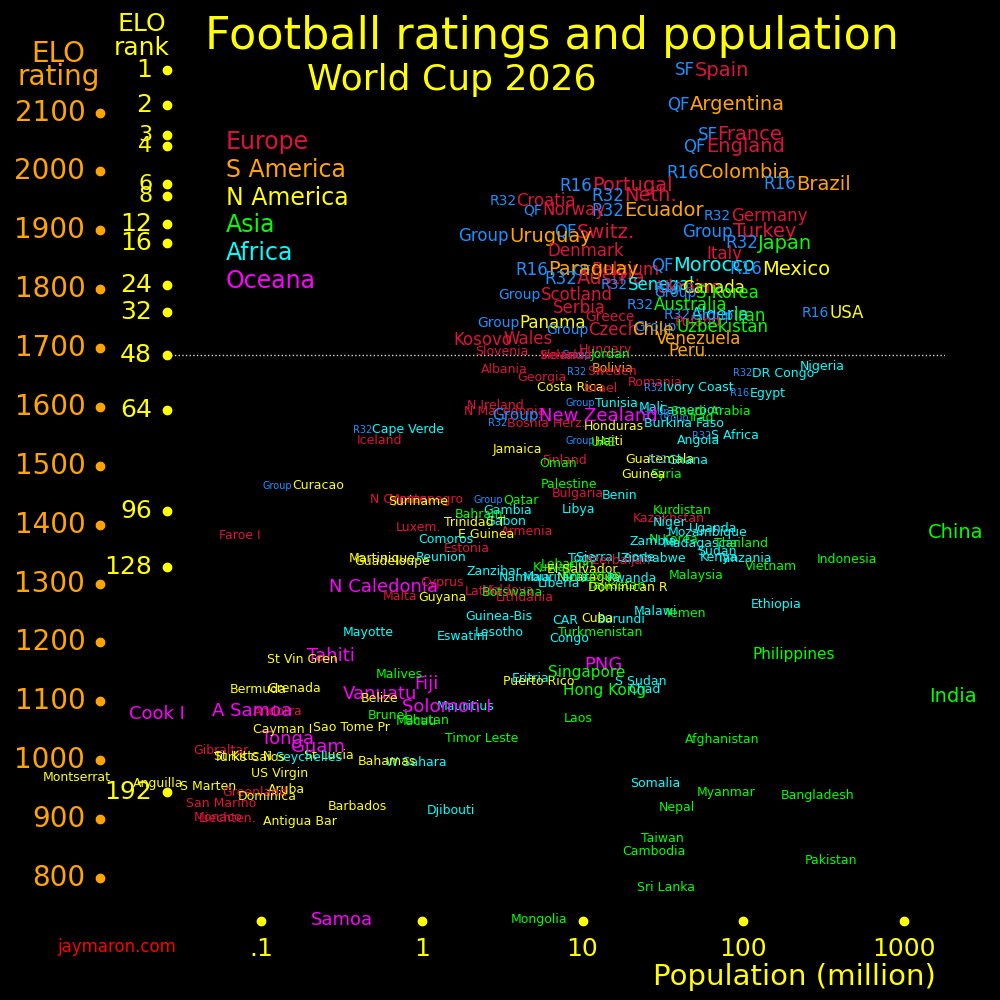
Europe and South American nations tend to be rated highly with respect to their popupulations. Asian and African nations tend to be rated low.
Standout nations with a small population include Croatia, Denmark, the Netherlands, Portugal, Norway, Switzerlan, Ecuador, Uruguay, and Paraguay, Cape Verde, Iceland, Curacao, and the Faroe Islands.
Weak nations with large populations include China and India.
 |
|---|
Messi and Mbappe are in a contest to hold the World Cup goal record after the 2026 tournament. Mbappe is 12 years younger than Messi and will likely pass Messi in the future.
Many active players have the potential to pass Messi within the next 3 World Cups, these being Kane (England), Neymar (Brazil), Lulaku (Belgium), Gakpo (Netherlands), Haaland (Norway), Junior (Brazil), Bellingham (England), and Havertz (Germany).
It helps to be on a strong team, which gives an edge to players from Brazil, Argentia, England, France, Italy, Germany, Spain, Portugal, Belgium, and the Netherlands.
The World Cup increased from 32 to 48 teams in 2026, which means more games and easier opponents, which means more goals per player per tournament. Goals in the 48-team format could have an adjustment factor to compare to the 32-team format.
In the table, the first block of players is active and the second block is retired. The table has all active players with at least 5 goals, and it has the top goal scorer for all strong teams. A "+" means that the player and team is still alive in the tournament.
                        Goals  World   Goals   Born         Age   Team place in 2026
                               Cups   in 2026

Lionel Messi     Argentina  21+  6    8+       1987 Jun 24   39   Final+
Kylian Mbappe    France     20   3    8        1998 Dec 20   27   Semifinal
Harry Kane       England    14   3    6        1993 Jul 28   32   Semifinal
C. Ronaldo       Portugal   11   6    3        1985 Feb  5   41   Round of 16
Neymar           Brazil      9   4    1        1992 Feb  5   34   Round of 16
Romelu Lukaku    Belgium     8   3    3        1993 May 13   33   Quarterfinal
Jude Bellingham  England     7   2    6        2023 Jun 29   23   Semifinal
Erling Haaland   Norway      7   1    7        2000 Jul 21   25   Quarterfinal
Ivan Perisic     Croatia     7   4    1        1989 Feb  2   37   Round of 32
Cody Gakpo       Netherlands 6   2    3        1999 May  7   27   Round of 32
James Rodriguez  Colombia    6   3    0        1991 Jul 12   34   Round of 16
Enner Valencia   Ecuador     6   3    0        1989 Nov  4   36   Round of 32
Mikel Oyarzabal  Spain       5+  1    5+       1997 Apr 21   29   Final+         Injured at the time of the 2022 World Cup
Ousmane Dembele  France      5+  3    5+       1997 May 15   29   Semifinal
Kai Havertz      Germany     5   2    3        1999 Jun 11   27   Round of 32
Venicius Junior  Brazil      5   2    4        2000 Jul 12   25   Round of 16
Ismaila Sarr     Senegal     5   3    4        1998 Feb 25   28   Round of 32
Julian Quinonas  Mexico      4   1    4        1997 Mar  4   29   Round of 16
Johan Manzambi   Switz.      3   1    3        2005 Oct 14   20   Quarterfinal
Folarin Balogun  USA         3   1    3        2001 Jul  3   24   Round of 16
Ismael Saibari   Morocco     3   1    3        2001 Jan 28   25   Quarterfinal
Elija Just       New Zealand 3   1    3        2000 May  1   26   Group stage
Jonathan David   Canada      3   2    3        2004 Jan 14   26   Round of 16
Alvaro Morata    Spain       3+  2    0+       1992 Oct 23   33   Final+
Son Hyung-Min    S Korea     3   4    0        1992 Jul  8   33   Group stage
Rahul Jimenez    Mexico      3   4    3        1991 May  5   35   Round of 16
Ayase Ueda       Japan       2   2    0        1998 Aug 28   27   Round of 32
G. de Arrascaeta Uruguay     2   2    0        1994 Jun  1   32   Group stage    Georgian de Arrascaeta
Mario Barotelli  Italy       1   4    0        1990 Aug 12   35   Did not qualify for 2026, 2022, and 2018

Miroslav Klose   Germany    16   4
Ronaldo          Brazil     15   4
Gerd Muller      W Germany  14   2
Just Fontaine    France     13   1
Pele             Brazil     12   4
Jurgen Klinsmann Germany    11   3
Sandor Kocsis    Hungary    11   1
Neymar was injured in the 2014 World Cup by a flagrant foul and missed the rest of the tournament. He deserves an extra honorary goal. Neymar announed that he's retiring from the Brazilian national team after the 2026 World Cup.
For 2026, the strongest country that didn't qualify is Italy. Germany is the strongest country that lost in the round of 32. Brazil and Mexico lost in the round of 16.
Italy didn't qualify for 2026, 2022, and 2018.
Germany   1
Paraguay  1  Paraguay  0
France    3  France    1
Sweden    0              France    2
S Africa  0              Morocco   0
Canada    1  Canada    0
Morocco   1  Morocco   3
Neth.     1
                                     France
Croatia   1                          Spain
Portugal  2  Portugal  0
Spain     3  Spain     1
Austria   0              Spain     2
Bosnia    0              Belgium   1
USA       2  USA       1
Belgium   3  Belgium   4
Senegal   2

Japan     1
Brazil    2  Brazil    1
Norway    2  Norway    2
Ivory C   1              Norway    1
Ecuador   0              England   2
Mexico    2  Mexico    2
England   2  England   3
DR Congo  1                          England
                                     Argentina
C. Verde  3
Argentina 2  Argentina 3
Egypt     1  Egypt     2
Australia 1              Argentina 3
Algeria   0              Switz.    1
Switz.    2  Switz.    0
Colombia  1  Ghana     0
Ghana     0
 |
|---|
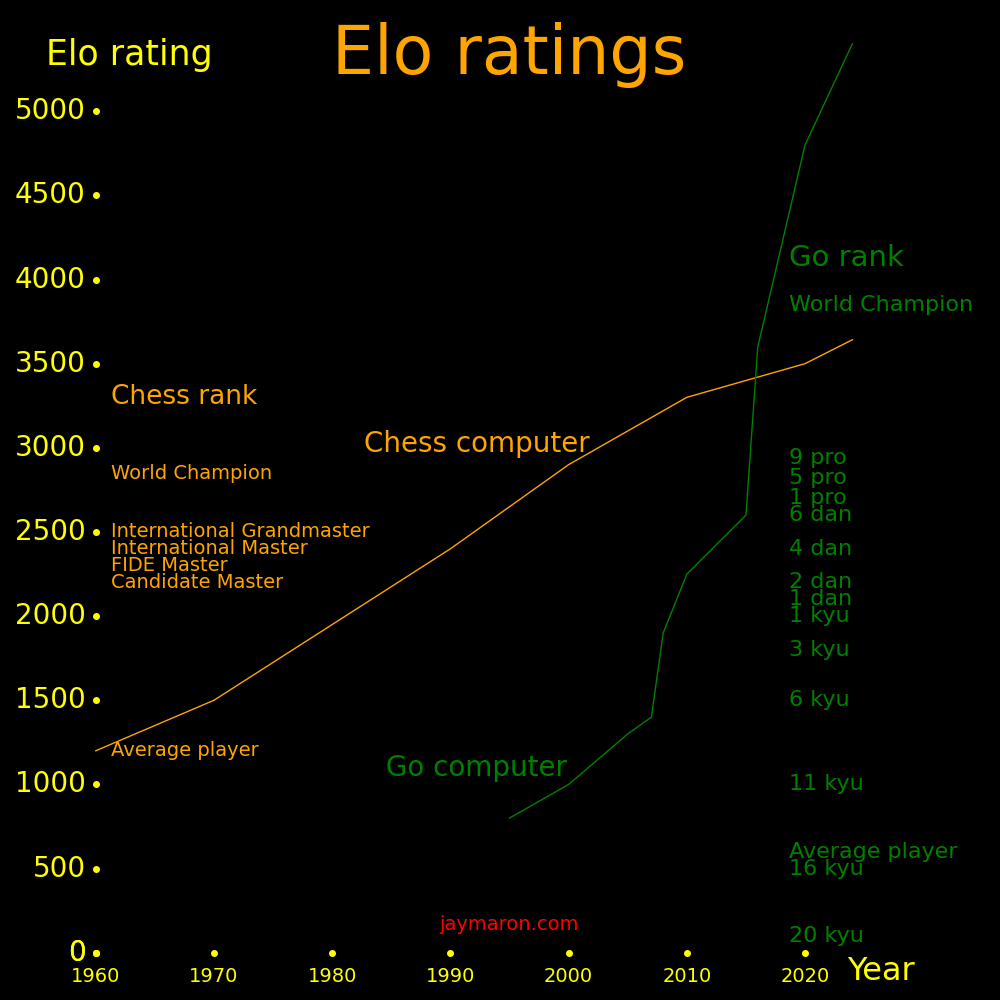
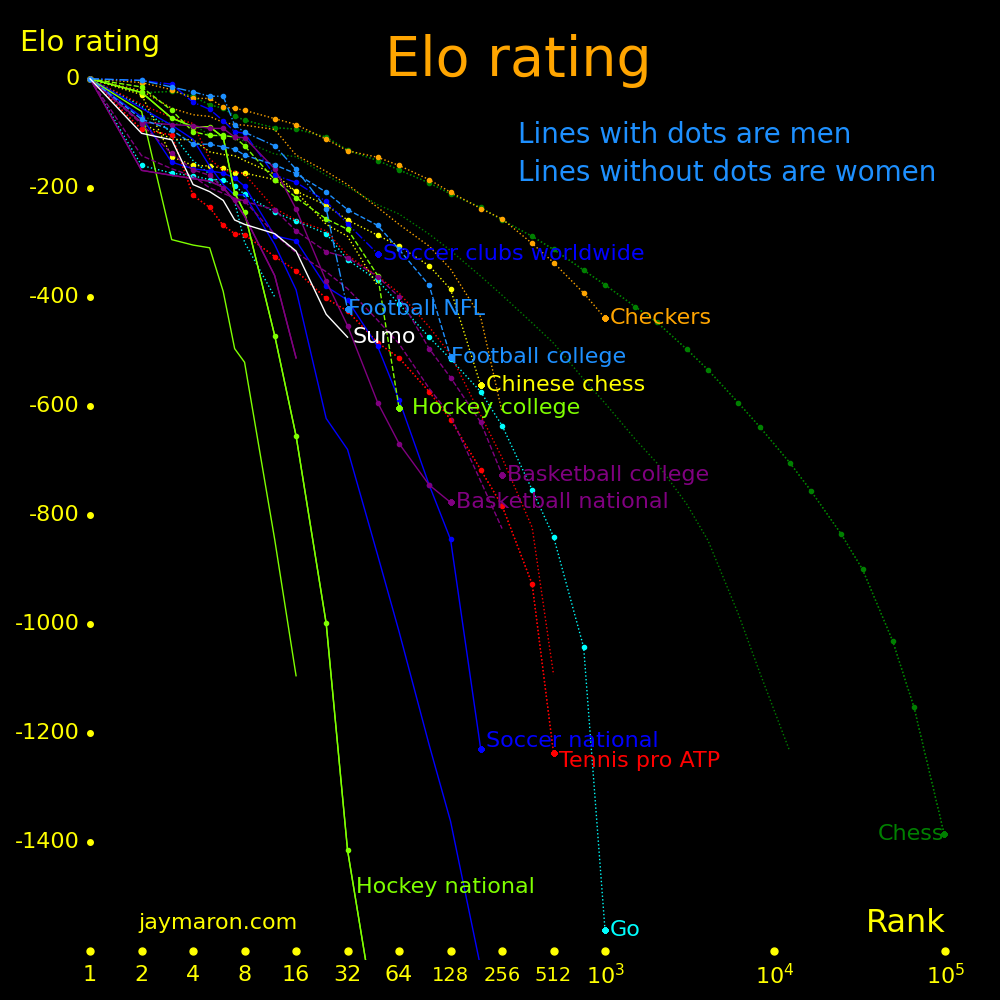
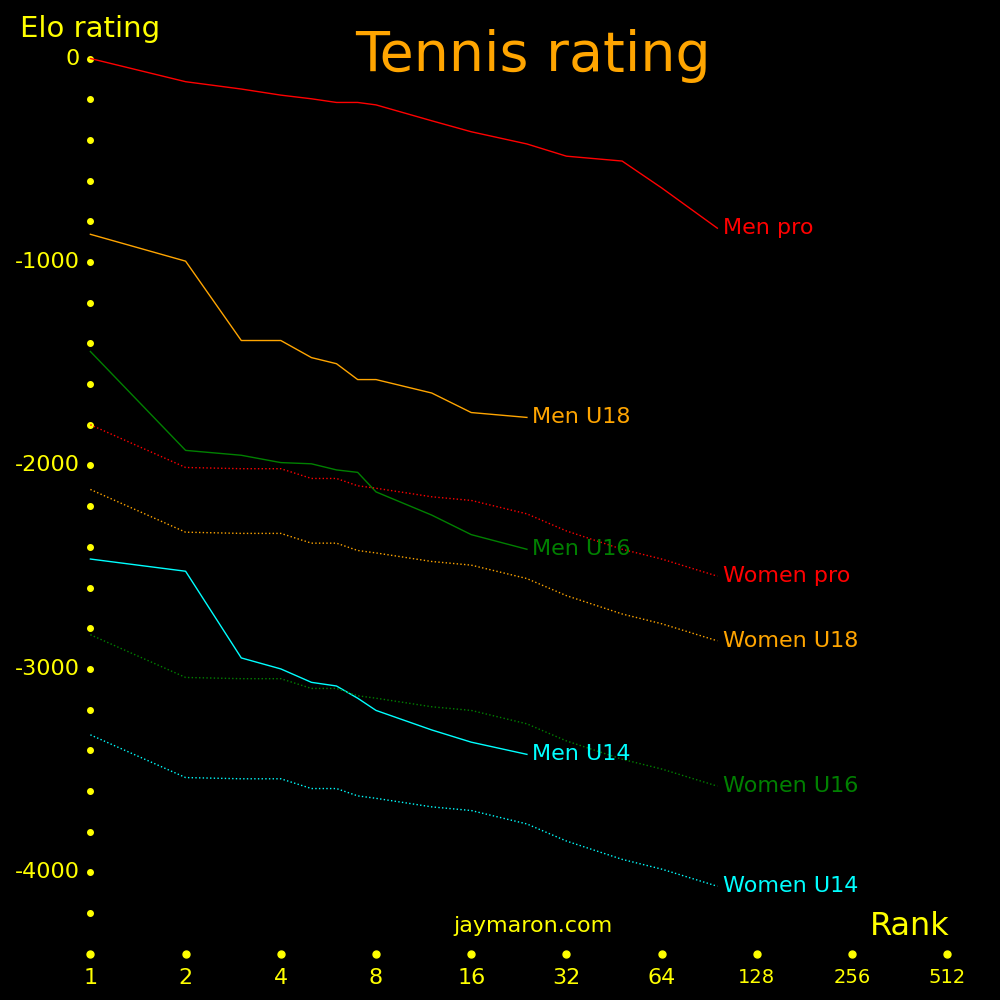
For a sport or board game, define "depth" as the difference between an average player and the world champion, using Elo ratings. For board games, define "computer depth" as the difference between an average player and an infinite computer. The current computer world champion gives a lower bound.
The goal is to design sports and board games with big depth.
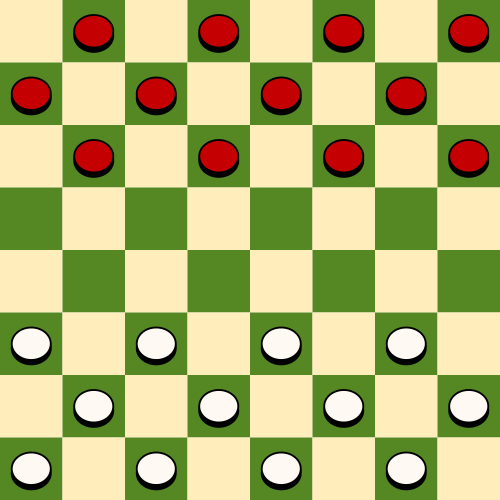
Checkers was solved by computer. A computer can force a draw in checkers. Chess, go, shogi, and Chinese chess haven't been solved. Commputers are getting stronger with no sign of topping out. Tic Tac Toe has zero depth because an average player can force a draw against an infinite computer.
Elo ratings:
            Human  Computer  Average  #1024   #128    #1   Computer   Infinite  Date that a computer
            depth   depth     human   human   human  human            computer  surpassed the #1 human

Go             3262   >5400     600    2400   3348   3862    5400      >6000       2016
Shogi          2200   >5000     600           1900   2800    4800      >5600
Chinese Chess  1983             800           2397   2783
Chess          1631   >2800    1200    2453   2620   2831    3642      >4000       1997
Checkers       1240    1600    1200    2000   2232   2440   >2814      ~3000       1994     Solved in 2007
Stratego        858   >1000     100            497    958   >1100                 <2022
Tic Tac Toe       0       0       0       0      0      0       0          0

Soccer         2600
Tennis         2400
Golf           2000
 |
 |
 |
 |
 |
 |
 |
|---|---|---|---|---|---|---|
 |
|---|
Elo ratings are rigged so that if the ratings difference is 200 points, the stronger player wins with 3/4 probability.
In the chart, ratings are normalized so that the world champion has a rating of 0.
Ratings for chess, checkers, go, and tennis have the most number of players.
Elo ratings can't bridge a gap beyond 200 directly. To compare players with a large difference in strength, you need to ladder between them. For example, if team A is 200 points strongerk than team B, and team B is 200 points stronger than team C, we say that team A is 400 points stronger than team C. You can't compare teams A and C directly.
We often normalize ratings so that a difference in strengh of unity corresponds to the stronger player winning with 3/4 probability. We divide Elo by 200.
A sport can be characterized by how upset prone it is. Sports like baseball and soccer are upset prone and sports like tennis aren't.
In the above chart, the more shallow the slope, the greater the chance of upsets. Define the "oligarchiness" of a league by the negative slope.
 |
|---|
Tennis ratings span all ages, and they link the genders.
|
|---|
European leagues are stronger than non-European leagues. The American Premier League (Major League Soccer) has the same strength as the English tier 3 league.
The table shows examples of league tiers. The deepest tier system is English soccer, with 20 tiers.
On the tennis ATP tour, there are 4 slams, 9 ATP-1000 events, 16 ATP-500 events, and 30 ATP-250 events. The top players play most of the slams, ATP-1000, and ATP-500 events, so the top tier starts at ATP-500
Tier  Baseball   Soccer England   Football USA college             Tennis    Golf
        USA                                                        World     World

 1  Major        Premiere League  Big 10, SEC, Notre Dame          ATP 500   PGA, LIV
 2  AAA          EFL Champ        Big 12, ACC                      ATP 250   European Tour
 3  AA           EFL 1            Pac 12, AAC, MW, MAC, CUSA, Sun            Korn Ferry, Asia, Korea, Japan, etc.
 4  A+           EFL 2            FCS                              ATP 125   Handicap <= 1
 5  A            Nat. League      Division 2                       ATP 100   Handicap <= 9
 6  Rookie+      Nat. League 2    Division 3                       ATP  75   Handicap <= 18
 7  Rookie       Tier 7                                            ATP  50   Handicap <= 27
 8  Am baseball  Tier 8                                            ITF       Handicap <= 36
 9               Tier 9                                            Local     Handicap >  36
League                Tiers

Soccer    England       20
          Brazil         9
          USA            4
Baseball  USA            8
Rugby     England       11
Football  USA college    6
          USA            4
Hockey    USA & Canada   3
Golf      World          9
Tennis    World          7
All are pro leagues unless otherwise specified.
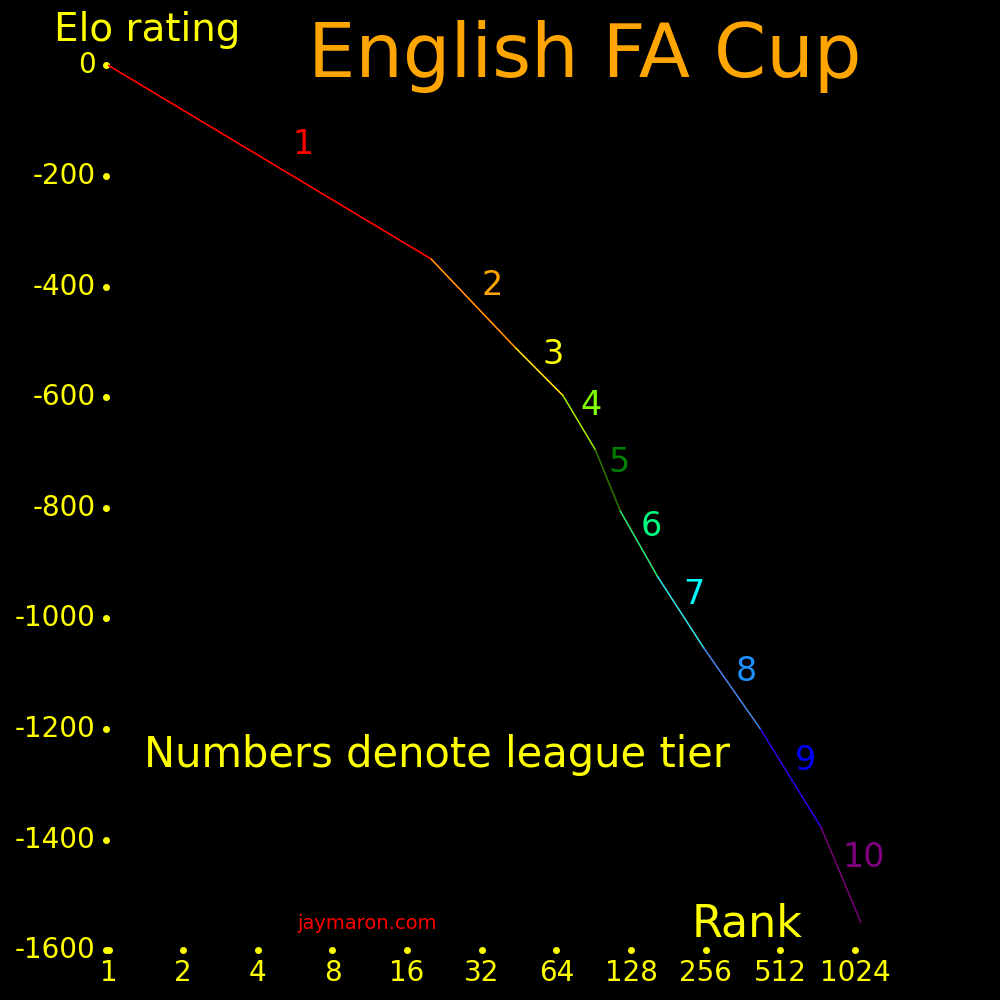
The English FA Cup includes tiers 1-9 and gives data for comparing tiers. The FA Vase compares tiers 9 and 10.
 Tier of the    Tier of the   Probability that the
stronger team   weaker team   stronger team wins

      1              2            .80
      2              3            .58
      3              4            .60
      4              5            .64
      5              6            .63
      6              7            .66
      7              8            .66
      8              9            .71
      9             10            .74
Convert to Elo:
Elo = 200 (Win_probability - .5) / .25
 |
|---|
"Rank #1" is the tier 1 champion, "Rank #20" is the tier 1 bottom team, "Rank #21" is the tier 2 champion, "Rank #44" is the tier 2 bottom team, etc.
Over the past 12 years, the winner was always tier 1.
Tiers 19 and 20 have few teams and so we exclude them and consider England to have 18 tiers.
Tiers 1-18 have 6461 teams. English has 5 million men from age 20 to 30, and if they all play soccer, its 250000 teams. England could have around 5 more tiers.
The table gives yardages for golf tees.
Tee     Player       Course  Hole  Drive  Score  Drive  Fairway  Par  Par  Par   Green  Birds  Bogeys  Par 3  Par 4  Par 5  Eagle  Hole in 1
                      yard   yard  yard           mph      %      3    4    5      %                                          %       %

Black   PGA            7344  408   300   71.1    113     61    3.05  4.02  4.60  66.7   3.84   2.51   13.5   17.4   47.3  .62     .04
Blue                   7200  400
        PGA Senior     6800  377   279   71.5    106     65.4  3.09  4.08  4.69  68.0   3.06   2.83   12.0   14.8   40.1  .47
White   Scratch man    6600  367   260   72.0
White   Average man    6600  367   216   86.2     73.4   50                                                                       .007
        LPGA           6400  356   260   72.0     94     73
Yellow                 6200  344
Red     Average woman  5800  322   148  100.7     67.5
Green                  5400  300

Gap between PGA & WPGA  944   52    40    -.9     19
The probability for a hole-in-one is for par 3s.
The algorithm is convergence style. Ratings are initialized at zero for each team. Game results are a set of forces on each team's rating. The ratings are adjusted according to the forces.
The forces depend on rating. After the adjustment, the forces change.
Repeat the cycle until convergence.
Let L be the difference in rating between a player and his opponent. If the player has a higher rating, L is positive. If the player wins, the force function for that game is:
 L     Force

 3      1/9
 2      1/9
 1      1/3
 0      1/2
-1       1
-2      3/2
-3      3/2
The force function is constant for |L| > 2. It doesn't give excessive weight to upsets.
The force function is rigged so that for L=1, the probability of the stronger player to win is 3/4.
 |
|---|
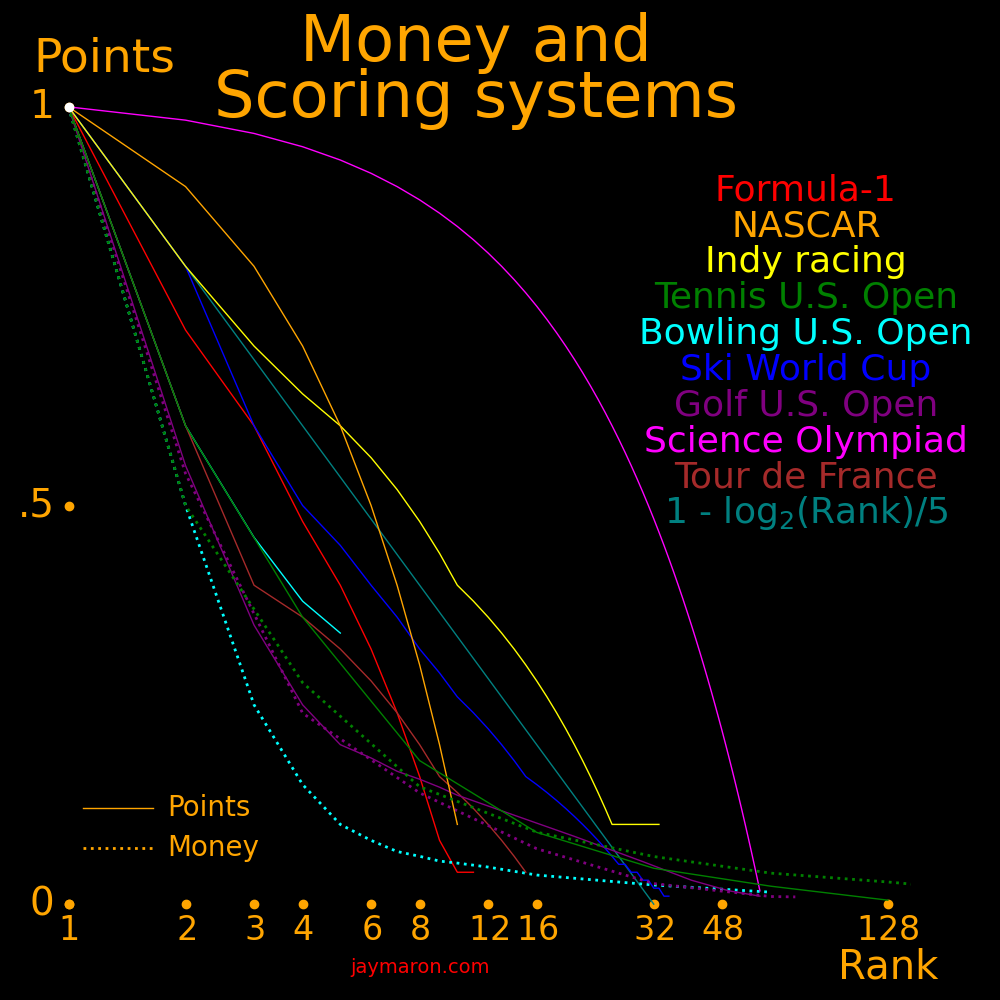
In the plot, points are normalized so that the rank #1 team gets 1 point. The un-normalized point systems are:
Rank  World  F-1  Indy  NASCAR  Tennis  Golf  Bowling  Tour de  Science
     Cup ski                     ATP    PGA     PBA    France   Olympiad

  1    100   25    50     10    2000     600   7500      50       60
  2     80   18    40      9    1200     330   4500      30       59
  3     60   15    35      8     720     210   3450      20       58
  4     50   12    32      7     720     150   2850      18       57
  5     45   10    30      6     360     120   2550      16       56
  6     40    8    28      5     360     110             14       55
  7     36    6    26      4     360     100             12       54
  8     32    4    24      3     360      94             10       53
  9     29    2    22      2     180      88              8       52
 10     26    1    20      1     180      82              7       51
 11     24    1    19            180      77              6       50
 12     22         18            180      72              5       49
 13     20         17            180      68              4       48
 14     18         16            180      64              3       47
 15     16         15            180      61              2       46
 16     15         14            180      59                      45
 32      2          5             90      28                      29
 64                               45       4.76
128                               10
For the Tour de France, points are awarded for each stage, and at the end of the tour, the points winner is honored as the sprint champion.
The NASCAR and Science Olympiad functions are goofy because they give too little emphasis to top finishers. The tennis and golf functions give too much emphasis to top finishers.
The Science Olympiad function is for 2001 and after. Before 2001, the Science Olympiad used NASCAR scoring.
Ideally, the score function should have a linear shape in a plot where the X axis is logarithmic. Sports with a sensible scoring function include Formula-1, Indy racing, and World Cup skiing.
Suppose there are 64 players. A point function that gives a linear shape in the plot is:
Rank  Points

  1     6
  2     5
  4     4
  8     3
 16     2
 32     1
 64     0
In a single-elimination tournament with 64 players, points corresponds to the number of games won.
This can be expressed as
Points = -log2(Rank/64)
 |
|---|
A team's rating is calculated from its scores from events (event = tournament). For each event, a team has a rank, and the score is:
Rank     Score

  1        6
  2        5
  4        4
  8        3
 16        2
 32        1
 64        0
128        0
In general,
Score = -log2(Rank/64)
The score has a floor. If the score is less than zero, it's set to zero.
Rating for team t                 =  Tt
Rank of team t in event e         =  Rte
Team constant                     =  r  =  64
Number of events per team         =  N  =  5          Use a team's best 5 results
A team's overall score is the average of scores from their best 5 tournaments.
Tt = N-1 ∑e -log2(Rte/r)
Terms in the sum have a floor of zero.
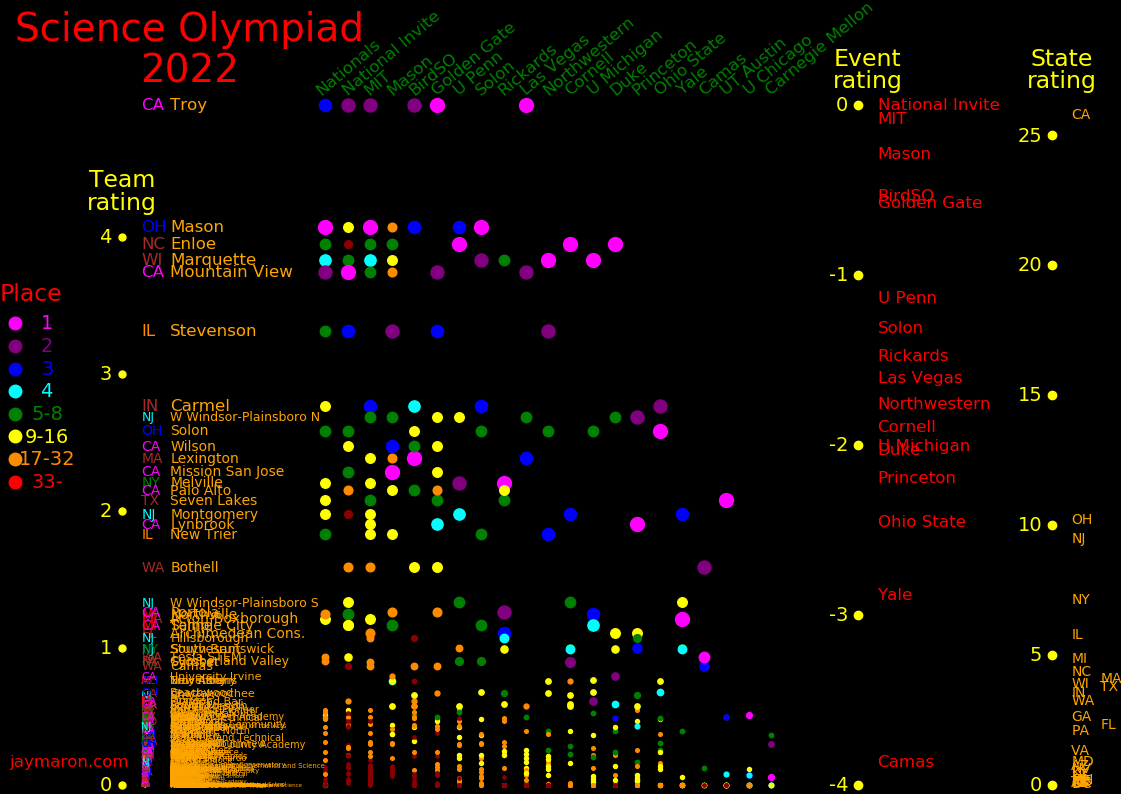
The team rating can be refined by including event rartings. An event rating is determined by the sum of the strengths of the teams participating.
Rating for event e                =  Ee
Rating of the highest-rated event =  Emax
Ee = log2[ Emax-1 ∑t Tt]
To include event ratings in the team rating,
Tt = N-1 ∑e [-log2(Rte/r) + Ee]
Terms in the sum have a floor of zero.
T and E are interdependent. They can be separated with a convergence algorithm. Initialize Ee=0 for all e and compute T. Use T to compute E. Repeat until convergence.
A state's rating is the sum of the ratings of its teams.
Ratings from invitationals correlate well with nationals results.
                Nationals  Rating
                  rank

CA  Troy               3   4.77
OH  Mason              1   3.90
WI  Marquette          4   3.89
CA  Mountain View      2   3.69
NC  Enloe              7   3.77
IL  Stevenson          6   3.22
IN  Carmel             9   2.63
OH  Solon              5   2.59
NJ  W W-P N                2.53
CA  Wilson                 2.34
MA  Lexington              2.27
CA  Mission San Jose       2.18
NY  Melville          13   2.12
TX  Seven Lakes       10   1.99
CA  Palo Alto              1.98
NJ  Montgomery        12   1.86
CA  Lynbrook               1.83
IL  New Trier          8   1.77
WA  Bothell                1.74
MI  Northville        17   1.34
MI  Saline                 1.27
NJ  W W-P S                1.22
MA  Acton-Boxborough  11   1.16
WA  Tesla STEM        24   1.16
CA  Portola                1.21
CA  Temple City            1.13
WA  Camas                  1.03
FL  Archimedean Cons.      1.01
NJ  Hillsborough           1.01
For each state, the table shows the number of teams with a rating larger than 1.
  # of   State rating   2 Nationals
  teams    for 2022        bids

CA  8      25.8             *
OH  2      10.1             *
NJ  4       9.6
NY  1       7.1             *
IL  2       5.8             *
MI  2       4.6             *
NC  1       4.4             *
MA  2       4.1
TX  1       3.9             *
WI  1       3.8
WA  3       3.7
IN  1       3.7
GA  0       2.4
FL  1       2.3             *
PA  0       2.3             *
States of Death include California, Ohio, New Jersey, New York, Illinois, Michigan, Wisconsin, Massachusetts, and Washington.
The college basketball national championship tournament inspires people to
enter bracket pools. The question is how to score a bracket. A natural scoring system is to
give 1 point for each correct entry in the bracket.
A golf tournament differs from a bracket in that the tournament yields an ordering among the
players from 1 to N. In this case, a "bracket" is a prediction of the ordering. A formula for
scoring the bracket is:
Predicted rank of team i           = Pi
Rank of team i from the tournament = Ri
Score                              = S = ∑i |ln(Pi) - ln(Ri)|
 |
 |
 |
|---|---|---|
 |
.jpg) |
.jpg) |
|---|---|---|
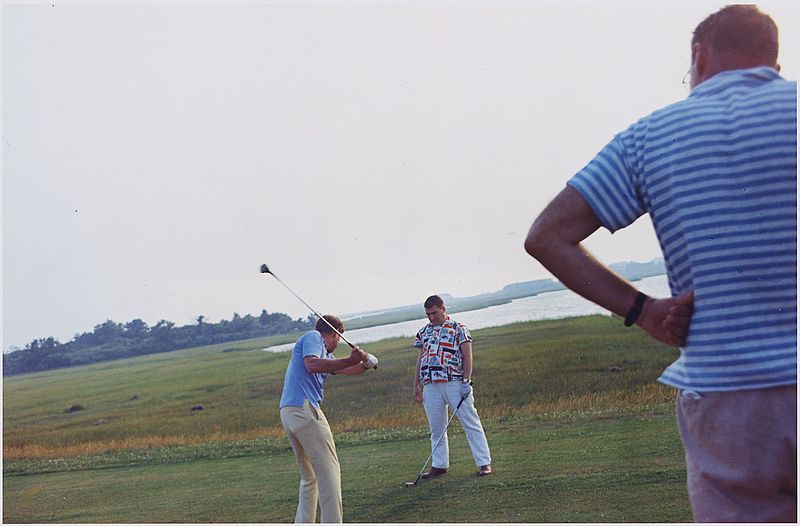
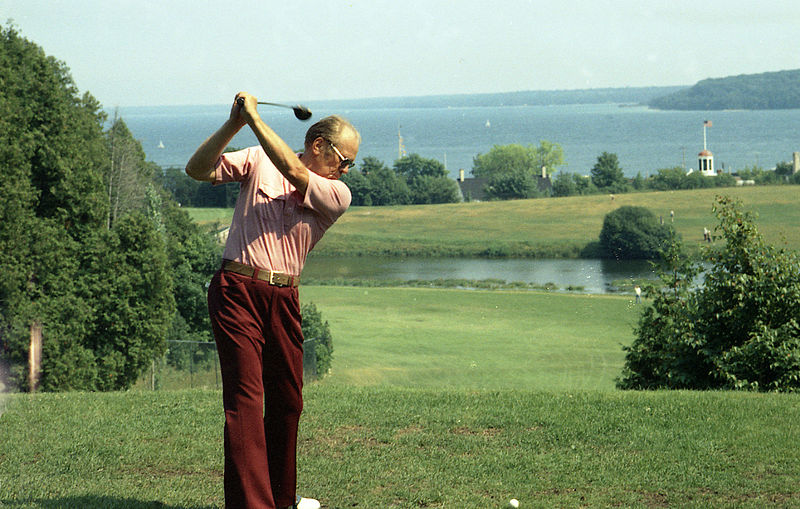
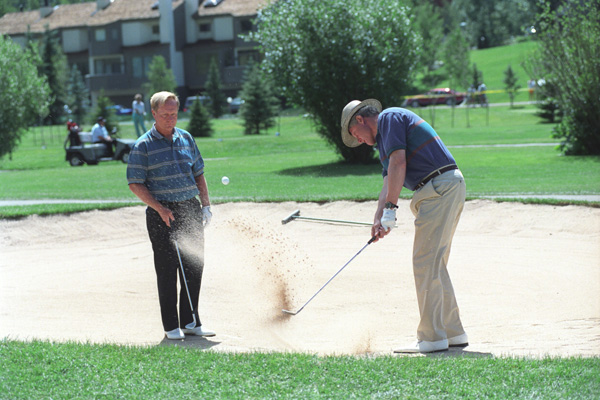
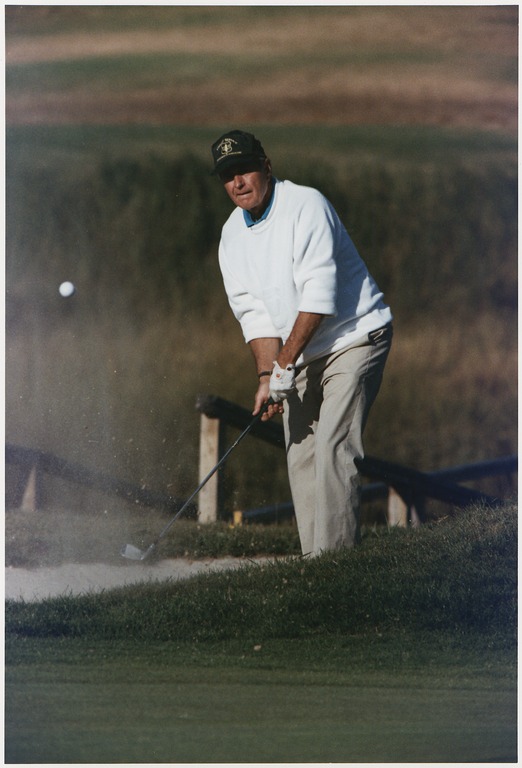
        Golf rank       Golf rank        Golf       Golf       Athlete rank
       Golf Digest   Bleacher Report   handicap  rounds/year   Golf Digest

Trump        1             1             2.8         91              Winner of 19 club championships. Owns 17 golf courses
Kennedy      2             3             8                       4   Harvard golf team
Eisenhower   3             2            13          100          5   Installed a green on the White House lawn
Ford         4             7                                     1   Michigan football team, in the year that Michigan won the national championship
Roosevelt T  5                                                   2
Bush 41      6                          10                       3
Bush 43      7             6            11            3          8   Hits 18 holes 2 hours. Doesn't take practice swings
Clinton      8             4
Obama        9             5            13           42          7
Reagan      10                                                   6
Harding     11
Taft        12
Wilson      13
Nixon       14                                                       Shot a 79
Johnson     15
Coolidge    16                                                       Left behind his clubs upon departing the White House
Wilson                                  25          250         10   Played in the winter and painted his balls black
Biden                                   10
Pence                                   15
Lincoln                                                          9
Jack Nicklaus: "Trump loves the game of golf more than he loves money"
Modern organized sports give us quantitative information about athletic prowess. Ranking presidents from before the age of organized sports is difficult and we fall back on anecdotes.
Tier 1   Ford
Tier 2   Washington  Grant     Eisenhower    Trump
Tier 3   Jackson     Lincoln   T Roosevelt   Kennedy     Carter    Reagan  Bush 41  Bush 43  RFK Jr
Tier 4   Taylor      Harrison  McKinley      Taft        Wilson    Truman  Nixon    Biden
Tier 5   Everyone else
Tier 6   Cleveland   FDR

Washington   Mighty horseman. Big and strong. Wrestler.
             Could crush a walnut with his thumb and index finger.
             Army General of the Armies
             Fought many battles and had many horses shot out from under him.
             His coat and hat are full of bullet holes.
             Has more horse miles than most modern Americans have air miles.
Jefferson    Virginia Militia Colonel
Madison      Virginia Militia Colonel
Monroe       Virginia Militia Colonel
Jackson      Army Major General
Taylor       Army Major General
Tyler        Army Colonel
Polk         Tennessee Captain
Harrison     Army Major General
Fillmore     New York Militia Major
Pierce       Army Brigadier General
Buchanan     Army Private
Lincoln      County wrestling champion. Defeated many renowned wrestlers.
             Master of the axe. Army Captain
Johnson A    Brigadier General
Grant        Best horse rider and horse trainer in America, in an era where horsemanship mattered.
             Army General of the Armies
Hayes        Army Major General
Garfield     Army Major General
Arthur       New York Militia Brigadier General
Harrison     Army Brigadier General
Cleveland    Renowned as a bad athlete
McKinley     Army Captain
Roosevelt, T Played all sports, including boxing and wrestling. Army Colonel
             Climbed the Matterhorn
Taft         Yale heavyweight intramural wrestling champion
Wilson       Davidson U baseball starter. Princeton rugby coach. Played more golf rounds
             than any president.
FDR          Undistinguished as a student or athlete. Harvard cheerleader
Truman       Army Colonel
Eisenhower   U.S. Military Academy starting halfback. Gymnast, boxer, fencer, horseman.
             Football coach for Peacock Military Academy and St. Mary's University.
             Army General of the Army. Golf handicap 13. Installed a golf green at the White House
Kennedy      Harvard golf starter and swimming starter. Football JV. Golf handicap 8.
             Harvard sailing starter. Won the Eastern Collegiate Championship. Navy Lieutenant
Johnson L    Navy Commander
Nixon        Whittier football and basketball team. Navy Commander. Bowler
Kennedy, R   No record of sports
Ford         Michigan U football starting center and linebacker.
             Team MVP. College all-star. The Michigan team won the national championship.
             Yale football and boxing coach. Navy Lieutenant Commander
Carter       Naval academy sprint football starter, baseball starter, and cross country starter.
             High school basketball starter. Navy Lieutenant
Reagan       Eureka College football starter and swim starter. Great physique.
             Sports broadcaster. Portrayed The Gipper in "Knute Rockne".
             Honored with a gold medal at the International Swimming Hall of Fame.
             Army Captain
Bush 41      High school football captain and baseball captain. Yale baseball captain.
             Played in the college baseball world series. Golf handicap 10. Navy Lieutenant
Bush 43      Yale rugby starter. High school baseball starter. Golf handicap 10.
             Ran a marathon in 3:44:52. Air National Guard First Lieutenant
             Owned the Texas Rangers
Obama        Little athletic background. Pickup basketball player but was not on any varsity team.
Trump        Golf handicap 3.
             High school football starter, soccer starter, and baseball starter, at a military academy.
             Member of the WWE Hall of Fame. Owned the New Jersey Generals football team.
             Owns 19 golf courses. Gets cheers when attending sports events.
             People make glorious memes depicting Trump as a badass.
Biden        High school football starter and baseball starter. Golf handicap 10
RFK Jr       Mighty physique, and he still has it as an elder. Falconer
The mainstream media likes to tout Obama as a great athlete, and that he played basketball at Occidental college. There is no record of him being associated with the Occidental basketball team. It's a myth. Obama's jump shot is poor. He can't bend his knees and he can't maneuver. He doesn't jump, and his release point is sadly low, at the level of his head. When Obama threw out the first pitch at a baseball game, it was a weak pitch and it was way out of the strike zone.
Presidents that installed sports at the White House:
Teddy       Tennis
Truman      Bowling, horseshoes
Eisenhower  Golf green
Ford        Pool
Obama       Basketball
A president's fitness on the last day of office matters. Jay's ranks:
         Age on     Years alive
        last day  after presidency

Ford        63   29   Michigan football center & linebacker. Team MVP. College all-star
Grant       54    8   Best Horseman in America
Washington  65    2   Mighty horseman. Big and strong. Wrestler
Teddy       50    9   Boxed and wrestled while prez
Lincoln     56    0   Master wrestler and lumberjack
Kennedy     46    0   Harvard starter golf & swimming. Football JV. Golf handi 8
Carter      56  >42   Naval acad starter football, baseball, x country
RFK Sr      47    ?
Eisenhower  70    8   Army acad starting halfback. All sports
RFK Jr      74    ?   Fit at old age
Bush 43     62  >14   Yale rugby starter. HS baseball starter. Golf handicap 10
Trump       82    ?   Golf handicap of 3. Still a badass golfer
Jackson     69    8
Bush 41     68   25   Yale baseball captain. HS football captain
Garfield    49    0
Taft        55   17
Clinton     54  >22
Polk        53    0
Nixon       61   19   Enthusiastically participates at football practice
Obama       55   >6   No record of being on a sports team
Reagan      77   15   Eureka College starter football & swim
Adams, JQ   61   18
Adams, J    65   25
Cleveland   59    4   Left his golf clubs behind upon leaving White House
Wilson      64    2   Stroke
Hillary     73   >3   Infirm
Biden       86    -   Demented and infirm
FDR         63    0   Died of old age while in office
We consider hypothetical presidents such as RFK Sr, RFK Jr, and Hillary Clinton.
FDR died of old age while in office. That's why he's ranked last.
General of the Army   Washington  Grant       Eisenhower
Major General         Jackson     Harrison W  Taylor      Hayes       Garfield
Brigadier General     Arthur      Pierce      Johnson A   Harrison B
Colonel               Jefferson   Madison     Monroe      Polk        Teddy     Truman
Commander             Johnson L   Nixon
Major                 Fillmore
Lieutenant Commander  Ford
Captain               Tyler       Lincoln     McKinley    Reagan
Lieutenant            Kennedy     Carter      Bush 41
First Lieutenant      Bush 43
Private               Buchanan
 |
 |
.jpg) |
 |
 |
 |
 |
|---|---|---|---|---|---|---|
Golf Digest ranked the best 150 golfers in DC.
              Handicap  Rank

Tony Russo       -3.1     1
Rob Ellsworth    -1.8     2
David Perdue      -.6     3     Senate      R
Trey Gowdy        1.0     7     House       R
Donald Trump      2.8    12     President   R
Roger Williams    4.9    23     House       R
Bob Corker        5.2    26     Senate      R
Mick Mulvaney     8.0    42     House       R
Jim Renacci       9.6    63     House       R
Joe Biden        10      68     VP          D
Rick Allen       10      68     House       R
Dean Heller      10      68     Senate      R
Tom Rooney       10      68     House       R
Albio Sires      10.2    77     House       D
Ron Johnson      10.6    88     Senate      R
Richard Burr     11.3    86     Senate      R
Pete Aguilar     12      92     House       D
Xavier Becerra   12      92     House       D
Chris Collins    12      92     House       R
Jeff Duncan      12      92     House       R
John Hoeven      12      92     Senate      R
Duncan Hunter    12      92     House       R
Ron Kind         12      92     House       D
Brad Ashford     12.3   102     House       D
Pat Meehan       12.3   102     House       R
Dan Kildee       12.8   107     House       D
Phil Roe         12.8   107     House       R
Ander Crenshaw   12.9   111     House       R
Barack Obama     13     113     President   D
Lindsey Graham   13     113     Senate      R
Mike Pence       15     127     VP          R
 |
|---|
Largest NIL valuations in millions:
Football:
QB   5.3 3.1 3.0 2.6 2.6 2.5 2.5 2.3 2.3 2.1 2.1 2.1 2.0 1.9 1.9 1.8 1.8 1.7 1.7 1.7 1.6 1.6 1.6 1.6
WR   4.2 1.8 1.7 1.6
OT   1.9 1.7 1.6
S    2.4
Edge 2.2
DL   1.7
RB   1.6

Basketball, men:
SF   4.4 1.7 1.7
PF   3.3 2.0 1.9 1.8
PG   2.1
SG   1.9
CG   1.6 1.6

Basketball, women  1.5 1.5 .89 .85 .78 .74 .55 .36 .30 .26

Golf, men          2.5 1.75 .85 .75 .75 .6
Golf, women        2.0

Tennis, women       .68
Gymnastics, women   .65 .30 .16
Softball, women    1.0
Track, women        .14
Data for 2025 Dec 2.
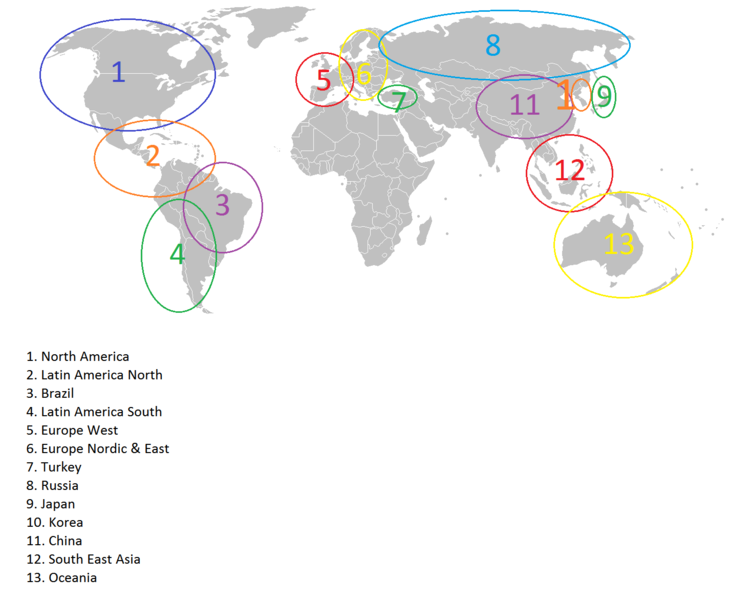 |
|---|
For the world championships from 2013-2018, the number of times each region has appeared in the elimination bracket is:
          Quarter  Semi  Final  Win

South Korea   20    12     8     6
China         14     8     4     2
Europe        13     7     2
N. America     6     1
Taiwan, HK     3
Other          0
24 teams participate in the world championships, 12 1st-tier teams and 12 2nd-tier teams. The 2nd-tier teams play a pool round with 4 advancing, where they join the 12 1st-tier teams for another pool round, with 8 advancing to an elimination bracket.
The number of teams from each region is:
             1st   2nd
             tier  tier

South Korea    3
China          2   1
Europe         2   1
North America  2   1
Taiwan, HK     1   1
Vietnam        1
Brazil             1
Russia             1
Japan              1
Turkey             1
Latin North        1
Latin South        1
Oceana             1
SE Asia            1
We can tally the results from past world championships to give a sense of how many teams each region deserves in the current world championship. We define a measure of the strength of each region based on the performance of its teams in the tournament.
             Points

Win            4
Final          3
Semifinal      2
Quarterfinal   1
Tallying results from 2013-2018,
South Korea   40
China         23
Europe        17
N. America     7
Taiwan, HK     3
Other          0
Total         88
South Korea owns 45% of the points. If tournament placements were based on this measure of region strength, South Korea would have far more than 3 teams in the tournament. This imbalance could be remedied by holding a qualifying tournament for teams that didn't qualify through their regions.
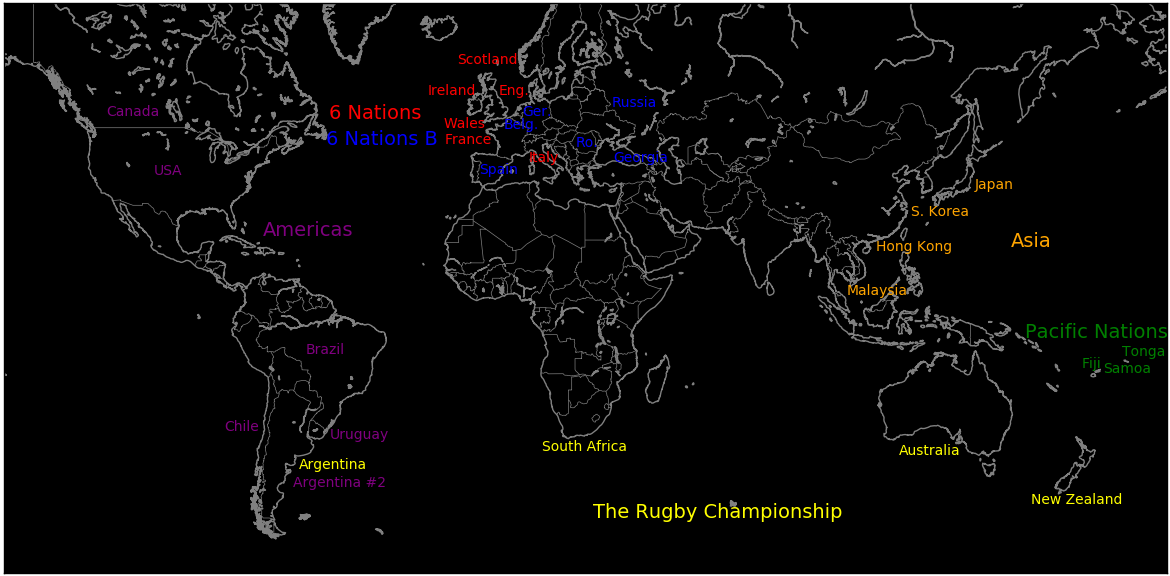 |
|---|
International rugby is well structured. Some of its strengths are:
Within conferences, teams are well balanced in terms of strength.
Conferences make sense geographically.
Each conference completes a single or double round robin each year. Conference results carry weight because the World Cup occurs only once every 4 years.
There are abundant interconference matches, both between top-tier teams and between top-tier and lesser teams.
Conferences are flexible and there exists upward mobility. For example Argentina established itself by making the World Cup semifinal in 2007 and was invited to join the Tri Nations in 2011, since known as The Rugby Championship.
Teams can take temporary leave of absence from conferences.
Teams can play in multiple ocnferences. For example the USA, Canada, and Japan often compete in the Pacific Nations Cup.
Teams can schedule games with whoever they want, and there is no limit to the number of times two two teams can play per year.
There are several national #2 teams, such as New Zealand #2 and Argentia #2.
There are subregional conferences such as "Europe 6 Nations B" and "Asian Division 1".
There exist teams independent of nations, such as The Barbarians and The British & Irish Lions.
Each team plays around 12 games per year and these games are chosen wisely. Matches are almost always compelling because both conference and interconference results carry weight.
Matchups between top teams occur frequently enough that a world champion can be meaningfully defined using results from the previous 2 years.
            Championships

Oklahoma State  34
Iowa            24
Penn State       9
Iowa State       8
Oklahoma         7
Minnesota        3
Ohio State       1
Arizona State    1
Michigan State   1
Northern Iowa    1
Cornell College  1
Indiana          1


Big Twelve      49
Big Ten         39
Other            3
Few schools outside of the Midwest have won championships.
Men's hockey:
Women's hockey championships:
Varsity Club Championship teams:
http://en.wikipedia.org/wiki/Varsity_Cup_Championship
Numbers are for 2001-2017. All teams with at least one placement in the top 3 are
included.
FCS conferences can realign to be geographically compact and to have fewer teams. For example,
The California conference could add California schools from outside Division 1, and
schools exist with lots of students, such as
The FCS California schools could secede from their conferences and form a California conference,
and invite teams from outside Division 1.
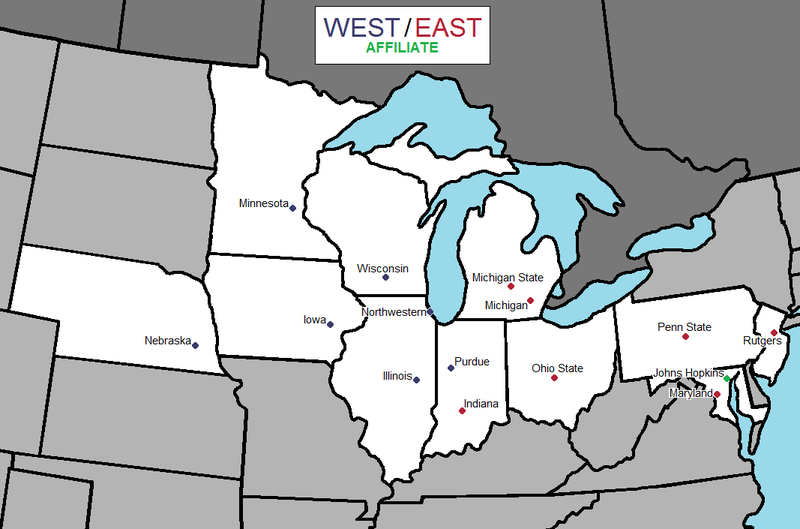
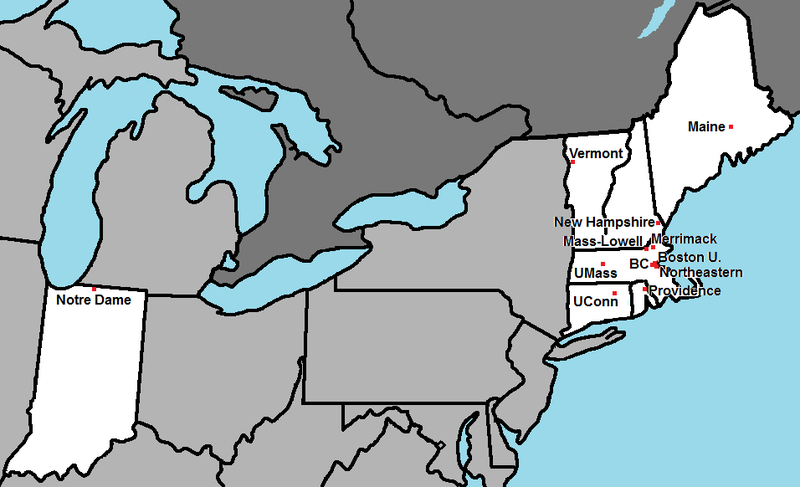
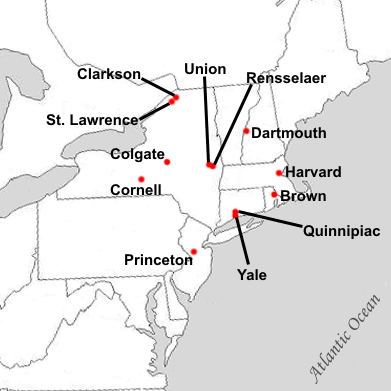
            Championships   Frozen Four

Michigan             9       24
North Dakota         7       21
Denver               7       14
Wisconsin            6       12
Boston College       5       24
Boston University    5       22
Minnesota            5       21
Lake Superior State  3        4
Michigan State       3       11
Michigan Tech        3       10
Cornell              2        8
Maine                2       11
Colorado College     2       10
RPI                  2        5
Minnesota-Duluth     1        4
Harvard              1       12
Providence           1        4
Bowling Green        1
Northern Michigan    1
Union                1
Yale                 1
St Lawrence                   9
Clarkson                      7
New Hampshire                 7
Dartmouth                     4
Wisconsin            9
Minnesota            6
Minnesota-Duluth     5
Clarkson             3
Ohio State           2
Arizona State     Air Force       Arkansas State    BYU       California
Cent. Washington  Clemson         Dartmouth         Navy      Notre Dame
Oklahoma          Texas           UCLA              UTAH
Division 1-A Rugby:
East:        Army,  Delaware,  Kutztown,  Penn State,  Wheeling Jesuit
             St. Bonaventure,  Iona,  University at Buffalo
Mid-South:   Lindenwood,  Life University,  Davenport University
California:  Cal Poly,  Saint Mary's,  UC Davis,  San Diego State,
             UC Santa Barbara,  Santa Clara,  Sacramento State,  Stanford
West:        Colorado,  Colorado State,  Wyoming  Northern Colerado,  New Mexico


            Championships

California       25
BYU               4
Air Force         3
Harvard           1
San Diego State   1
The Varsity Club conference was formed in 2013.
http://en.wikipedia.org/wiki/Division_1-A_Rugby
                  Champ  2nd  3rd

Manchester U        7     3    3
Chelsea             5     4    3
Arsenal             2     4    4
Manchester City     2     2    2
Liverpool                 3    3
Tottenham                 1    1
Leicester City      1
Newcastle U                    1
E Wash            Washington
Portland St       Oregon
Idaho             Idaho
Idaho St          Idaho
Montana St        Montana
Montana           Montana
Weber St          Utah
S Utah            Utah
Utah T            Utah
N Colorado        Colorado

North Dakota      North Dakota
North Dakota St   North Dakota
South Dakota      South Dakota
South Dakota St   South Dakota
Saint Thomas      Minnesota
Drake             Iowa
Butler            Iowa
N Iowa            Iowa

Illinois St       Illinois
W Illinois        Illinois
E Illinois        Illinois
S Illinois        Illinois
Indiana St        Indiana
Valpariso         Indiana
Youngstown St     Ohio
Dayton            Ohio
SE Missouri St    Missouri
Lindenwood        Missouri
Missouri St       Missouri

Murray St         Kentucky
Morehead St       Kentucky
E Kentucky        Kentucky
Austin peay       Tennessee
Tennessee Martin  Tennessee
Tennessee Tech    Tennessee
Tennessee St      Tennessee
Chattanooga       Tennessee
E Tennessee St    Tennessee

UC Davis          California
Sacramento St     California
Cal Poly          California
San Diego         California
N Arizona         Arizona

Abilene Christian Texas
Tarleton St       Texas
Incarnate Word    Texas
Stephen Austin    Texas
Lamar             Texas
Houston Christian Texas
E Texas AM        Texas
Prairie View AM   Texas
Texas S           Texas

Arkansas Pine Blu Arkansas
C Arkansas        Arkansas
SE Louisiana      Louisiana
Nichols           Louisiana
McNeese           Louisiana
Northwestern St   Louisiana
Southern          Louisiana
Grambling St      Louisiana

Jackson St        Mississippi
Mississippi Va St Mississippi
Alcorn St         Mississippi
N Alabama         Alabama
Alabama St        Alabama
Alabama AM        Alabama
Samford           Alabama
Mercer            Georgia
W Georgia         Georgia

Maine             Maine
New Hampshire     New Hampshire
Stonehill         Massachusetts
Holy Cross        Massachusetts
Rhode Island      Rhode Island
Bryant            Rhode Island
C Connecticut     Connecticut

Stony Brook       New York
Albany            New York
Marist            New York
Colgate           New York
Fordham           New York
Wagner            New York       Staten
LIU               New York
Monmouth          New Jersey

Georgetown        Pennsylvania
Lehigh            Pennsylvania
Lafayette         Pennsylvania
Villanova         Pennsylvania
Duquesne          Pennsylvania
Robert Morris     Pennsylvania
Saint Francis     Pennsylvania
Mercyhurst        Pennsylvania

Delaware St       Delaware
Delaware          Delaware
Morgan St         Maryland
Towson            Maryland
Bucknell          DC
Howard            DC
Richmond          Virginia
William Mary      Virginia
Hampton           Virginia
VMI               Virginia
Norfolk St        Virginia

Gardner Webb      North Carolina
Davidson          North Carolina
North Carolina C  North Carolina
W Carolina        North Carolina
Elon              North Carolina
Campbell          North Carolina
North Carolina AT North Carolina

South Carolina St South Carolina
Charleston S      South Carolina
Presbyterian      South Carolina
Citadel           South Carolina
Wofford           South Carolina
Furman            South Carolina
Stetson           Florida
Florida AM        Florida
Bethune Cookman   Florida
         Thousands of students

UC San Diego     43
Fullerton St     40
Northridge St    39
UC Irvine        37
Long Beach St    37
San Francisco St 30
Los Angeles St   28
UC Santa Barbara 26
UC Riverside     26
Pomona St        26
                Indiana     38
Alabama   34    Alabama      3
Oklahoma  24                      Indiana   56
                Texas Tech   0    Oregon    22
Oregon    51    Oregon      23                    Indiana   27
JMU       34                                      Miami     21
                Ohio State  14
Miami     10    Miami       24    Miami     31
Texas AM   3                      Ole Miss  27
                Georgia     34
Ole Miss  41    Ole Miss    39
Tulane    10
B1G:
      Oh  In  Or  Mi  USC   Conf losses
Ohio              +         0   Conference championship game participant
Ind           +             0   Conference champion
Ore       -           +     1
Mich  -               -     2
USC           -   +         2
SEC:
      TAM Ala Geo Mis Tex Van Ok  Ten LSU Fl  Mo  Conf losses
TAM                   -               +   +   +   1
Ala           +           +   -   +   +       +   1   Conference championship game participant
Geo       -       +   +           +       +       1   Conference champion
Mis           -               +       +   +       1
Tex   +       -           +   +           -       2
Van       -           -           +   +       +   2
Ok        +       -   -           +   +       +   2
Tenn      -   -           -   -           +       4
LSU   -   -       -       -   -           +       5
Fl    -       -   -   +           -   -           6
Mo    -   -               -   -                   4
Big 12:
     BYU TxT Ut  Cin TCU AzS Hou  Conf losses
BYU       -   +   +   +              1   Conference championship game participant
TxT   +       +           -   +      1   Conference champion
Ut    -   -       +       +          2
Cin   -       -       -              4
TCU   -           +       -   +      4     Lost to Kansas St
AzS       +   -       +       -      3
Hou       -           -   +          3     Lost to W Virginia
ACC:
    Vir GeT SMU Pit Duk  Conf losses
Vir                  +   1     Conference championship game participant
GeT              -   +   2     Lost to NC St
SMU                      2     Lost to Wake Forest
Pit      +               2
Duk  -   -               2     Conference champion.      Lost to Georgia T
Mia          -   +       2
   Total   Non-playoff  Playoff  Teams in  Teams in
   payout    payout     payout    bowls    playoffs
    M$         M$         M$

B10    94.8      39.8     55       11         3
SEC    94.2      36.2     58       12         5
ACC    78.2      46       32       11         1
B12    46.5      39.5      7        8         1
AAC    18.7      11.7      7        9         1
Sun     9.6       2.6      7       10         1
USA     5.6       5.6      0        7         0
MW      5.6       5.6      0        7         0
MAC     3.9       3.9      0        5         0
P12      .8        .8      0        1         0
ND      0         0        0        0         0

Total 357.7     191.7    166       80        12
There is 56 M$ more that will be decided by playoff games.
        Payout (M$)                                B10 SEC B12 ACC AAC Sun USA P12 MW  MAC
Final        9      Indiana    Miami        27  21  *           *
Peach (SF)   9      Indiana    Oregon       56  22  **
Fiesta (SF)  9      Miami      Ole Miss     31  27      *       *
Orange       7      Oregon     Texas T      23   0  *       *
Cotton       7      Miami      Ohio St      24  14  *           *
Rose         7      Indiana    Alabama      38   3  *   *
Sugar        7      Georgia    Miss         39  34      **
Round 1      7      Oregon     Madison      51  34  *                   *
Round 1      7      Miss       Tulane       41  10      *           *
Round 1      7      Miami      Texas AM     10   3      *       *
Round 1      7      Oklahoma   Alabama      34  24      **
Alamo        8.3    TCU        USC          30  27  *       *
Citrus       8.2    Texas      Michigan     41  27  *   *
Pop Tart     6.1    BYU        Georgia T    25  21          *   *
ReliaQuest   6.7    Iowa       Vanderbilt   34  27  *   *
Holiday      6.5    SMU        Arizona      24  19          *   *
Texas        6.4    Houston    LSU          38  35      *   *
Music City   5.7    Illinois   Tennessee    30  28  *   *
Gator        5.4    Virginia   Missouri     13   7      *       *
Duke's Mayo  4.8    Wake For   Miss St      43  29      *       *
Liberty      4.7    Navy       Cincinnati   35  13          *       *
Sun          4.6    Duke       Arizona St   42  39          *   *
Pinstripe    4.4    Penn St    Clemson      22  10  *           *
Las Vegas    2.9    Utah       Nebraska     44  22  *       *
Independence 2.2    Louis T    Coast Carol  23  14                      *   *
Military     2.1    E Carolna  Pittsburgh   23  17              *   *
Sports       2.0    Northwest  C Michigan   34   7  *                                   *
Rate         1.6    Minnesota  New Mexico   20  17  *                               *
68 Ventures  1.5    Delaware   Louisiana    20  13                      *   *
Birmingham   1.4    Georgia So App St       29  10                      **
Armed Forces 1.4    Texas St   Rice         41  10                  *   *
Hawaii       1.2    Hawaii     California   35  31              *                   *
Gasparilla   1.1    NC St      Memphis      31   7              *   *
New Mexico   1.0    N Texas    San Diego St 49  47                  *               *
Boca Raton    .9    Louisville Toledo       27  22              *                       *
New Orleans   .8    W Kentucky S Miss       27  16                      *   *
First Respond .8    UTSA       FIU          57  20                  *       *
Idaho Potato  .8    Wash St    Utah St      34  21                              *   *
Frisco        .6    Ohio       UNLV         17  10                                  *   *
Cure          .6    Old Dom    S Florida    24  10                  *   *
Arizona       .4    Fresno St  Miami Ohio   18   3                                  *   *
Veterans      .3    Jackson St Troy         17  13                      *   *
XBox                Ark St     Missou St    34  28                      *   *
Myrtle Beach        W Michigan Kennesaw St  41   6                          *           *
Fenway              Army       UConn        41  16                  *                        Independent
LA                  Washing    Boise St     38  10  *                              *
                                                   B10 SEC B12 ACC AAC Sun USA P12 MW  MAC
Non-conference games. The winner is the first team listed. A "*" indicates a ranked team. A "-" indicates that the unranked team won.
B1G vs. SEC (4-3)
             Ohio St      Texas        14   7  **
             Oklahoma     Michigan     24  13  **
             Alabama      Wisconsin    38  10  *
             Texas        Michigan     41  27  **    Citrus
             Iowa         Vanderbilt   34  27        ReliaQuest
             Illinois     Tennessee    30  28        Music City
             Indiana      Alabama      38   3  **
B1G vs. B12 (3-4)
             Nebraska     Cincinnati   20  17
             Oregon       Oklahoma St  69   3  *
             Utah         UCLA         43  10  *
             Iowa St      Iowa         16  13  *  -
             TCU          USC          30  27        Alamo
             Utah         Nebraska     44  22        Las Vegas
             Oregon       Texas T      23   0  **    Playoff quarterfinal
B1G vs. ACC (3-1)
             Michigan St  Boston C     42  40
             Illinois     Duke         45  19
             Cal          Minnesota    27  14
             Penn St      Clemson      22  10        Pinstripe
             Miami        Ohio State   24  14  **    Playoff quarterfinal
             Indiana      Miami        27  21  **    Playoff final
SEC vs. B12 (3-1)
             Auburn       Baylor       38  24
             Missouri     Kansas       42  31  *
             Miss St      Arizona St   24  20
             Houston      LSU          38  35  *     Texas
SEC vs. ACC (6-7)
             LSU          Clemson      17  10
             Tennessee    Syracuse     45  26  *
             S Carolina   Virginia T   24  11
             Vanderbilt   Virginia T   44  20  *
             Florida St   Alabama      31  17  *  -
             Miami        Florida      26   7  *
             Clemson      S Carolina   28  14
             Georgia      Georgia T    16   9  **
             Miami        Texas AM     10   3  **    Playoff round 1
             Virginia     Missouri     13   7  **    Gator
             Wake For     Miss St      43  29        Duke's Mayo
             Miami        Ole Miss     31  27  **    Playoff semifinal
B12 vs. ACC (8-3)
             Baylor       SMU          48  45
             TCU          SMU          35  24
             TCU          N Carolina   48  14
             BYU          Stanford     27   3  *
             UCF          N Carolina   34   9
             W Virginia   Pittsburgh   31  24  *  -
             Georgia T    Colorado     27  20  *
             BYU          Georgia T    25  21        Pop Tart
             SMU          Arizona      24  19        Holliday
             Duke         Arizona St   42  39        Sun
Notre Dame
             Miami        Notre Dame   27  24  **
             Texas AM     Notre Dame   41  40  **
             Notre Dame   Purdue       56  23  *
             Notre Dame   Arkansas     56  13  *
             Notre Dame   Boise St     28   7  *
             Notre Dame   USC          34  24  *
             Notre Dame   NC St        36   7  *
             Notre Dame   Boston C     25  10  *
             Notre Dame   Pittsburgh   37  15  **
             Notre Dame   Syracuse     70   7  *
             Notre Dame   Stanford     49  20  *
Outside Power4 beating Power4
             S Florida    Florida      18  16    AAC  SEC
             Tulane       Northwestern 23   3    AAC  B1G
             Tulane       Duke         34  27    AAC  ACC
             UNLV         UCLA         30  23    MW   B1G
             Ohio         W Virginia   17  10    MAC  B12
             Army         Kansas St    24  21    AAC  B12
             Hawaii       California   35  31    MW   ACC
             E Carolna    Pittsburgh   23  17    AAC  ACC     Military
             Navy         Cincinnati   35  13    AAC  B12     Liberty
Big games outside Power4
             S Florida    Boise St     34   7    AAC  MW
             S Florida    N Texas      63  36    AAC  AAC
             Memphis      S Florida    34  31    AAC  AAC
Indiana     Oregon     30  20
Oregon      Iowa       18  16
Indiana     Iowa       20  15
USC         Michigan   31  13
USC         Iowa       26  21
Ohio St     Michigan   27   9
Oregon      USC        42  27
Indiana     Ohio St    13  10    Conference championship
Indiana     Oregon     56  22    Playoff semifinal

Texas AM    Missouri   38  17
Alabama     Georgia    24  21
Alabama     Missouri   27  24
Georgia     Miss       43  35
Florida     Texas      29  21
Oklahoma    Alabama    23  21
Georgia     Texas      35  10
Oklahoma    Missouri   17   6
Texas       Texas AM   27  17
Georgia     Alabama    27   7    Conference championship
Alabama     Oklahoma   34  24    Playoff round 1
Ole Miss    Georgia    39  34    Playoff quarterfinal

Texas T     BYU        29   7
BYU         Cincinnati 26  14
Texas T     BYU        34   7    Conference championship

Virginia    Duke       34  17
Pitt        Georgia T  42  28
SMU         Louisville 38   6
Duke        Virginia   27  20    Conference championship

Ohio St     Texas      14   7
Oklahoma    Michigan   24  13
Miami       Notre Dame 27  24
Texas AM    Notre Dame 41  40
Conference games that don't happen:
Ohio St vs. Indiana
Ohio St vs. Oregon
Ohio St vs. Iowa
Ohio St vs. USC
Indiana vs. Michigan
Indiana vs. USC

Texas AM vs. Alabama
Texas AM vs. Georgia
Alabama vs. Texas
Alabama vs. Mississippi
Missisippi vs. Texas
Texas AM vs. Mississippi

Texas T vs. Cincinnati

Virginia vs. SMU
Virginia vs. Georgia T
Virginia vs. Pittsburgh

Boise St vs. Hawaii
                B1G SEC B12 ACC               Losses                               Big wins
 1  Indiana      *                                                                 Oregon
 2  Ohio State   *
 3  Georgia          *
 4  Texas Tech           *                    Arizona State                        BYU  Utah  Houston
 5  Oregon       *                            Indiana
 6  Mississippi      *
 7  Texas AM         *
 8  Oklahoma         *
 9  Alabama          *                        Oklahoma    Florida State            Georgia   Vanderbilt
10  Miami                    *                Louisville  SMU
11  Notre Dame                  Independent   Texas AM    Miami
12  BYU                  *                    Texas Tech
13  Texas            *
14  Vanderbilt       *                        Alabama     Texas
15  Utah                 *
16  USC          *
17  Arizona              *
18  Michigan     *
19  Virginia                 *                NC State    Wake Forest
20  Tulane                      AAC
21  Houston              *
22  Georgia Tech             *
23  Iowa         *
24  James Madison               Sun
25  North Texas                 AAC
Duke is not ranked but they are the ACC champions.
                B1G SEC B12 ACC               Losses                               Big wins
 1  Indiana      *                                                                 Miami         Oregon x2     Ohio St    Alabama
 2  Miami                    *                Louisville  SMU                      Ole Miss      Ohio St       Texas AM
 3  Mississippi      *                                                             Georgia       Tulane
 4  Oregon       *                            Indiana                              Texas T       JMU
 5  Ohio State   *
 6  Georgia          *
 7  Texas Tech           *                    Arizona State                        BYU  Utah  Houston
 8  Texas AM         *
 9  Alabama          *                        Oklahoma    Florida State            Georgia       Oklahoma      Vanderbilt
10  Notre Dame                  Independent   Texas AM    Miami
11  BYU                  *                    Texas Tech
12  Texas            *
13  Oklahoma         *
14  Utah                 *
15  Vanderbilt       *                        Alabama     Texas
16  Virginia                 *                NC State    Wake Forest
17  Iowa         *
18  Tulane                      AAC
19  James Madison               Sun
20  USC          *
21  Michigan     *
22  Houston              *
23  Navy                        AAC
24  North Texas                 AAC
25  TCU                  *
B1G vs. SEC
             Ohio St      Texas           Sep 12
             Michigan     Oklahoma        Sep 12
             Minnesota    Mississippi St  Sep 12
B1G vs. B12
             Oregon       Oklahoma St     Sep 12
             Washington   Kansas St       Sep 19
             Iowa         Iowa St         Sep 12
             Northwestern Colorado        Sep 19
B1G vs. ACC
             UCLA         Cal             Sep  5
             Rutgers      Boston C        Sep 11
             Illinois     Duke            Sep 12
             Purdue       Wake Forest     Sep 12
             Maryland     Virginia T      Sep 19
SEC vs. B12
             Auburn       Baylor          Sep  5
             Missouri     Kansas          Sep 11
             Texas AM     Arizona St      Sep 12
             Arkansas     Utah            Sep 12
SEC vs. ACC
             S Carolina   Miami
             Mississippi  Louisville      Sep  6
             LSU          Clemson
             Alabama      Florida St
B12 vs. ACC
             TCU          N Carolina      Aug 29
             Cincinnati   Boston C        Sep  5
             Colorado     Georgia T       Sep  5
             UCF          Pittsburgh      Sep 12
             W Virginia   Virginia        Sep 19
Notre Dame
             Notre Dame   Miami           Nov  7
             Notre Dame   BYU             Oct 17
             Notre Dame   SMU             Nov 21
             Notre Dame   Wisconsin       Sep  6
             Notre Dame   Michigan St     Sep 19
             Notre Dame   Purdue          Sep 26
             Notre Dame   N Carolina      Oct  3
             Notre Dame   Stanford        Oct 10
             Notre Dame   Boston C        Nov 14
             Notre Dame   Syracuse        Nov 28
Pac 12 vs. Power4
             USC          Fresno St       Sep  5
             Washington   Washington St   Sep  5
             Oregon       Boise St        Sep  5
             UCLA         San Diego St    Sep 12
             Texas        Texas St        Sep  5
             Arizona St   Hawaii          Oct 10
             Kansas St    Washington St   Sep 12
Outside Power4
             Boise St     App St          Oct 10
             Boise St     Memphis         Sep 12
             UNLV         Memphis         Aug 29
             San Diego St J Madison       Sep 19
ESPN:
           2025  B1G SEC B12 ACC  Other
 1  Ohio State    2    *
 2  Oregon        5    *
 3  Georgia       3        *
 4  Notre Dame   11                    Independent
 5  Texas        13        *
 6  Indiana       1    *
 7  Miami        10                *
 8  Texas Tech    4            *
 9  Mississippi   6        *
10  Texas AM      7        *
11  LSU                    *
12  BYU          12            *
13  Oklahoma      8        *
14  Michigan     18    *
15  Penn St            *
16  Alabama       9        *
17  Washington         *
18  Utah         15            *
19  Iowa               *
20  USC          16    *
21  Louisville                     *
22  SMU                            *
23  TCU                        *
24  Houston      21            *
25  Tennessee              *
39  Boise St                           Pac 12
59  UNLV                               MW
63  Navy                               ACC
68  N Mexico                           MW
70  Memphis                            ACC
71  S Dakota St                        Missouri Valley
72  N Dakota St                        MW
73  UTSA                               ACC
76  E Carolina                         ACC
77  J Madison                          Sun
78  Fresno St                          Pac 12
79  Air Force                          MW
80  USF                                ACC
81  Miami Ohio                         MAC
83  Army                               ACC
84  Hawaii                             MW
85  Washington St                      Pac 12


 -  Vanderbilt   14
 -  Arizona      17
 -  Virginia     19
 -  Tulane       20
 -  Georgia T    22
 -  Iowa         23
 -  J Madison    24
 -  N Texas      25
                B1G SEC B12 ACC               Losses                               Big wins
 1  Indiana      *                                                                 Oregon
 2  Ohio State   *
 3  Georgia          *
 4  Texas Tech           *                    Arizona State                        BYU  Utah  Houston
 5  Oregon       *                            Indiana
 6  Mississippi      *
 7  Texas AM         *
 8  Oklahoma         *
 9  Alabama          *                        Oklahoma    Florida State            Georgia   Vanderbilt
10  Miami                    *                Louisville  SMU
11  Notre Dame                  Independent   Texas AM    Miami
12  BYU                  *                    Texas Tech
13  Texas            *
14  Vanderbilt       *                        Alabama     Texas
15  Utah                 *
16  USC          *
17  Arizona              *
18  Michigan     *
19  Virginia                 *                NC State    Wake Forest
20  Tulane                      AAC
21  Houston              *
22  Georgia Tech             *
23  Iowa         *
24  James Madison               Sun
25  North Texas                 AAC
Duke isn't ranked but they are the ACC champions.
Odds are ESPN preseason odds, March 5.
           Oh Or In Mi Pe Wa Io US Wi Mn  Schedule   Odds
Ohio St    x  *  *  *        *  *         Hard        1.75
Oregon     *  x     *     *     *                     4
Indiana    *     x  *     *     *     *               2.45
Michigan   *  *  *  x  *     *        *   Very hard  15
Penn St             *  x  *     *  *  *   Easy       20
Wash          *  *     *  x  *  *     *   Hard       25
Iowa       *        *     *  x     *  *              80
USC        *  *  *     *  *     x  *      Hard       14
Wisc                   *     *  *  x  *   Very easy
Minn             *  *  *  *  *     *  x   Hard      300

Ohio St      Indiana         Oct 17
Ohio St      USC             Oct 31
Ohio St      Oregon          Nov  7
Ohio St      Michigan        Nov 28
Ohio St      Iowa            Oct 23
Oregon       USC             Sep 26
Oregon       Washington      Nov 28
Indiana      USC             Nov 14
Indiana      Washington      Nov 21
Michigan     Indiana         Oct 24
Michigan     Oregon          Nov 14
Michigan     Penn St         Oct  3
Michigan     Iowa            Sep 26
Penn St      USC             Oct 10
Penn St      Washington      Nov  7
Washington   USC             Oct 23
Washington   Iowa            Oct 10

Conference games that don't happen:
Indiana      Oregon
         Ge Te Mi TA LS Ok Al Te Va  Schedule  Odds
Georgia  x     *        *  *     *   Easy      2.6
Texas       x  *  *  *  *     *      Hard      2.9
Miss     *  *  x     *  *        *   Hard     12
Texas AM    *     x  *  *  *                   8.5
LSU         *  *  *  x     *  *                9
Oklahoma *  *  *  *     x                     14
Alabama  *        *        x  *  *             8.5
Tenn        *              *  x  *   Easy     20
Vander   *     *           *  *              100
Florida                                       25

             Georgia      Alabama         Oct 10
             Georgia      Mississippi     Nov  7
             Georgia      Oklahoma        Sep 26
             Georgia      Vanderbilt      Oct  3
             Texas        Oklahoma        Oct 10
             Texas        Mississippi     Oct 24
             Texas        LSU             Nov 14
             Texas        Texas AM        Nov 27
             Texas        Tennessee       Sep 26
             Mississippi  LSU             Sep 19
             Mississippi  Oklahoma        Nov 14
             Mississippi  Vanderbilt      Oct 10
             Texas AM     LSU             Sep 26
             Texas AM     Alabama         Oct 24
             Texas AM     Oklahoma        Nov 21
             LSU          Alabama         Nov  7
             LSU          Tennessee       Nov 21
             Alabama      Tennessee       Oct 17
             Alabama      Vanderbilt      Nov 14
             Tennessee    Vanderbilt      Nov 28
         Te BY TC Ut Ho  Schedule  Odds
Texas T  x     *     *   Easy      1.05
BYU         x  *  *                6
TCU      *  *  x  *      Hard     28
Utah        *  *  x  *             5.5
Houston  *        *  x            16
Arizona                           15

             BYU          TCU             Oct  3
             BYU          Utah            Nov  7
             Texas T      Houston         Sep 18
             Texas T      TCU             Nov 26
             Utah         Houston         Oct 24
             Utah         TCU             Nov 21

Conference games that don't happen:
             BYU          Texas T
             Utah         Texas T
         Mi Lo SM Du  Schedule  Odds
Miami    x        *   Easy     -1.35
Louis       x  *      Easy      8
SMU         *  x      Easy      7
Duke     *        x   Easy     50
Clemson                        14
Virginia                       14
Pitt                           16

             Miami        Duke            Nov 14
             Louisville   SMU             Sep 19
             Boise St     San Diego St    Nov 21
             Boise St     Washington St   Oct 24
             Boise St     Fresno St       Oct 10
             San Diego St Fresno St       Oct 17
             San Diego St Washington St   Oct 31
             Washington St Fresno St      Oct  3