

|
|
|
|
|
|
|
|---|---|---|---|---|---|---|
 |
 |
 |
 |
 |
 |
|---|---|---|---|---|---|
 |
|---|
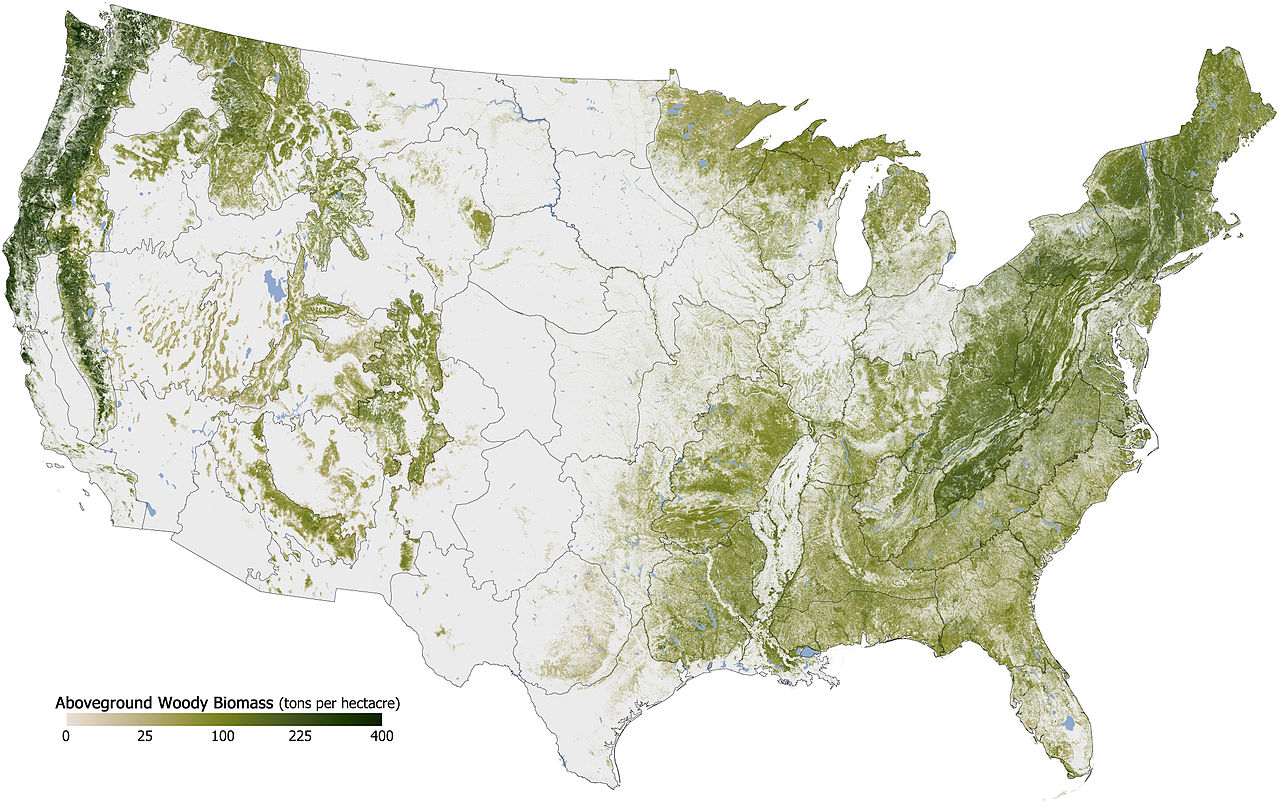
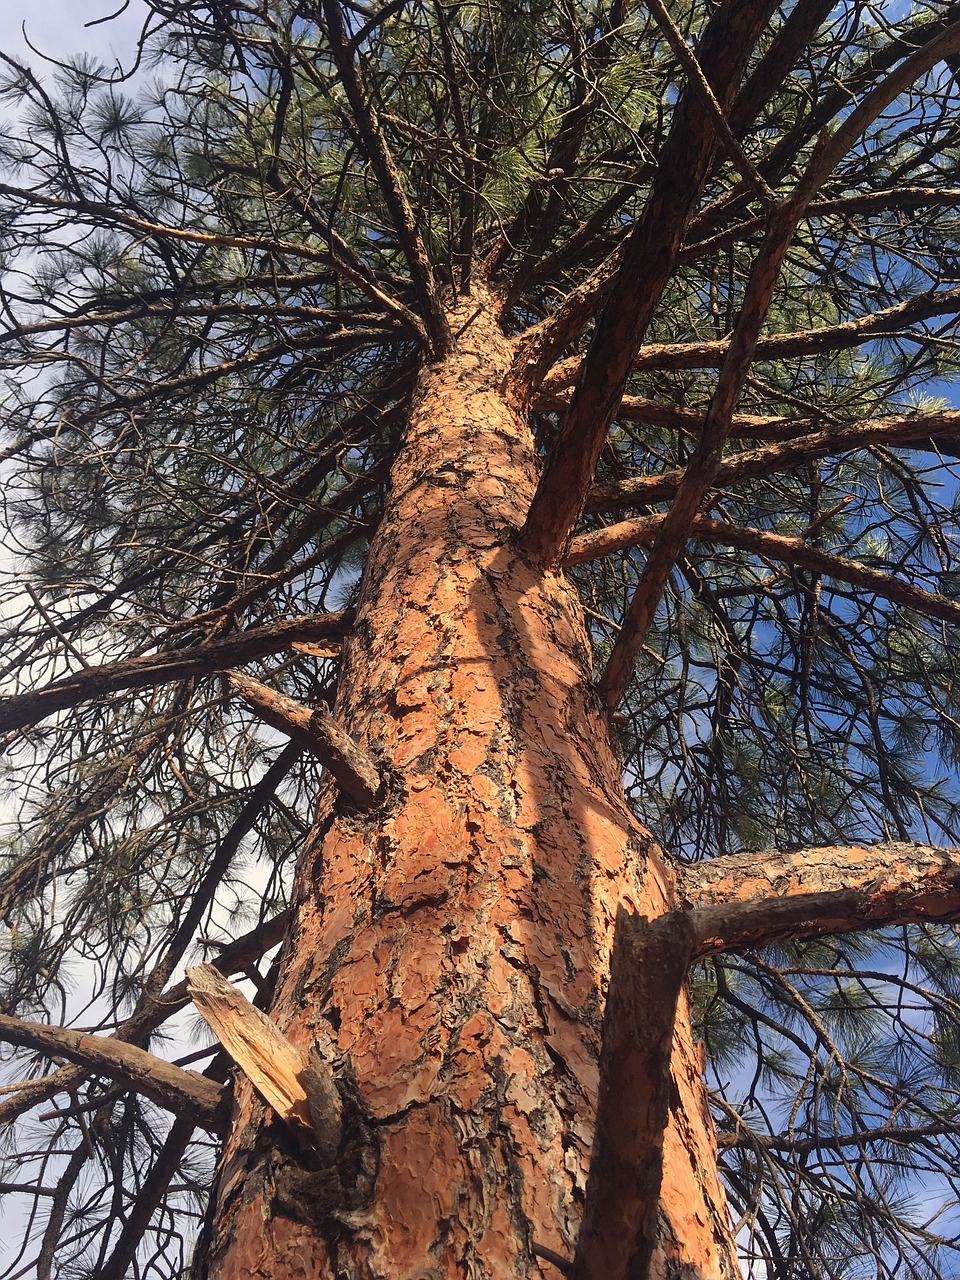
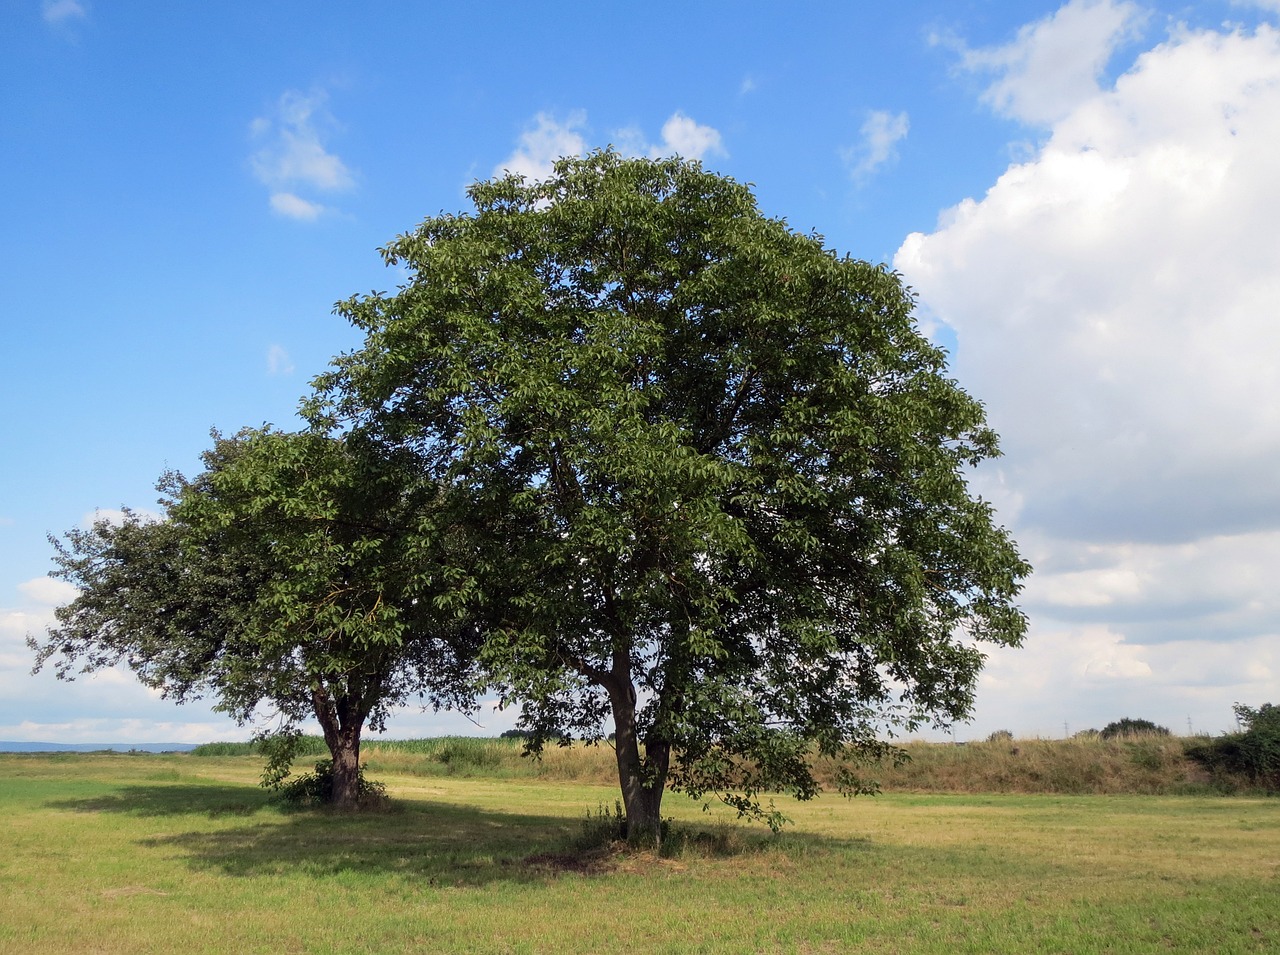
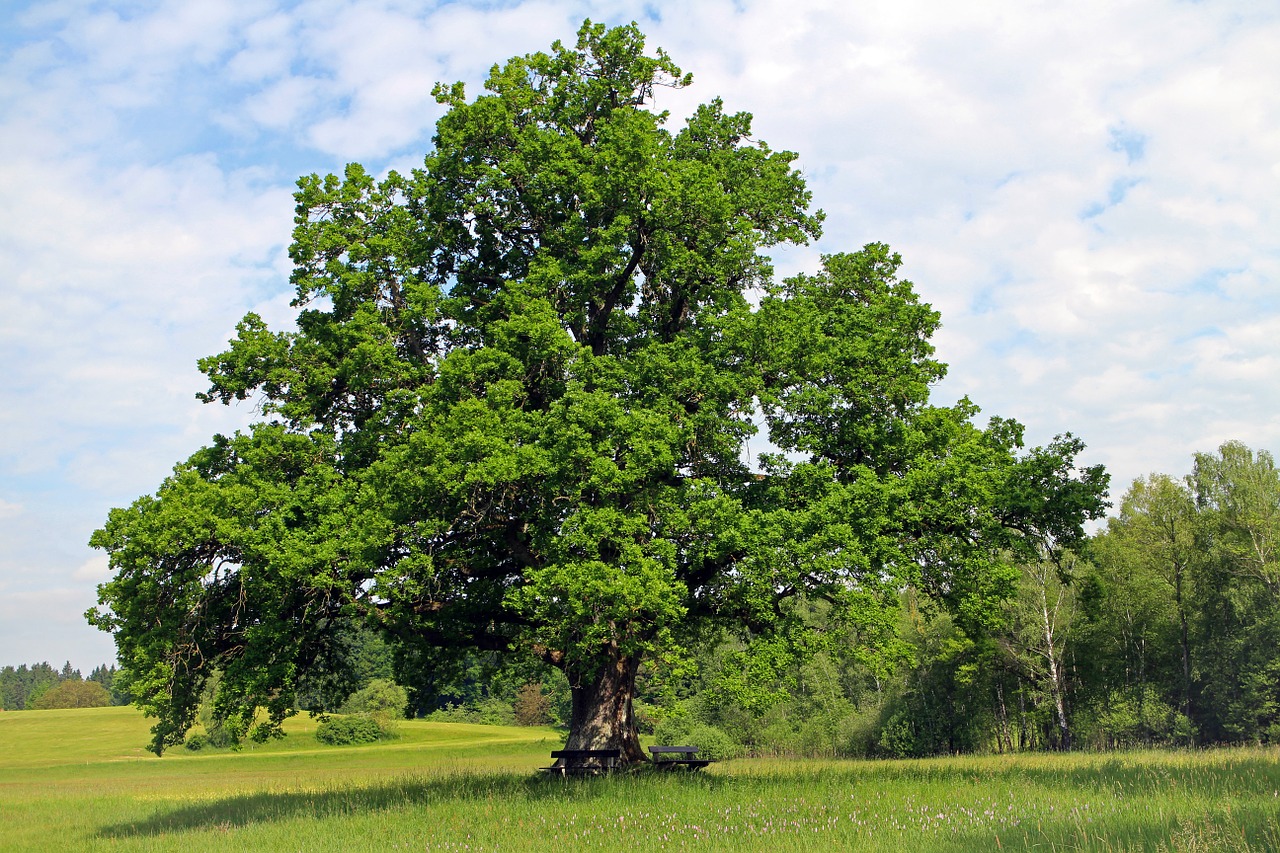
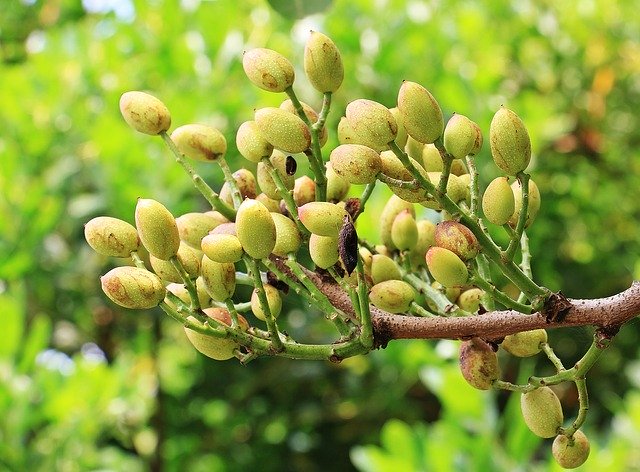
Biomass is dominated by trees.
Plants are 10% of ocean biomass and 98% of land biomass.
On land, most plants are not eaten, and in oceans, most plants are eaten. Oceans have 5 times as much consumer biomass as producer biomass.
 |
|---|
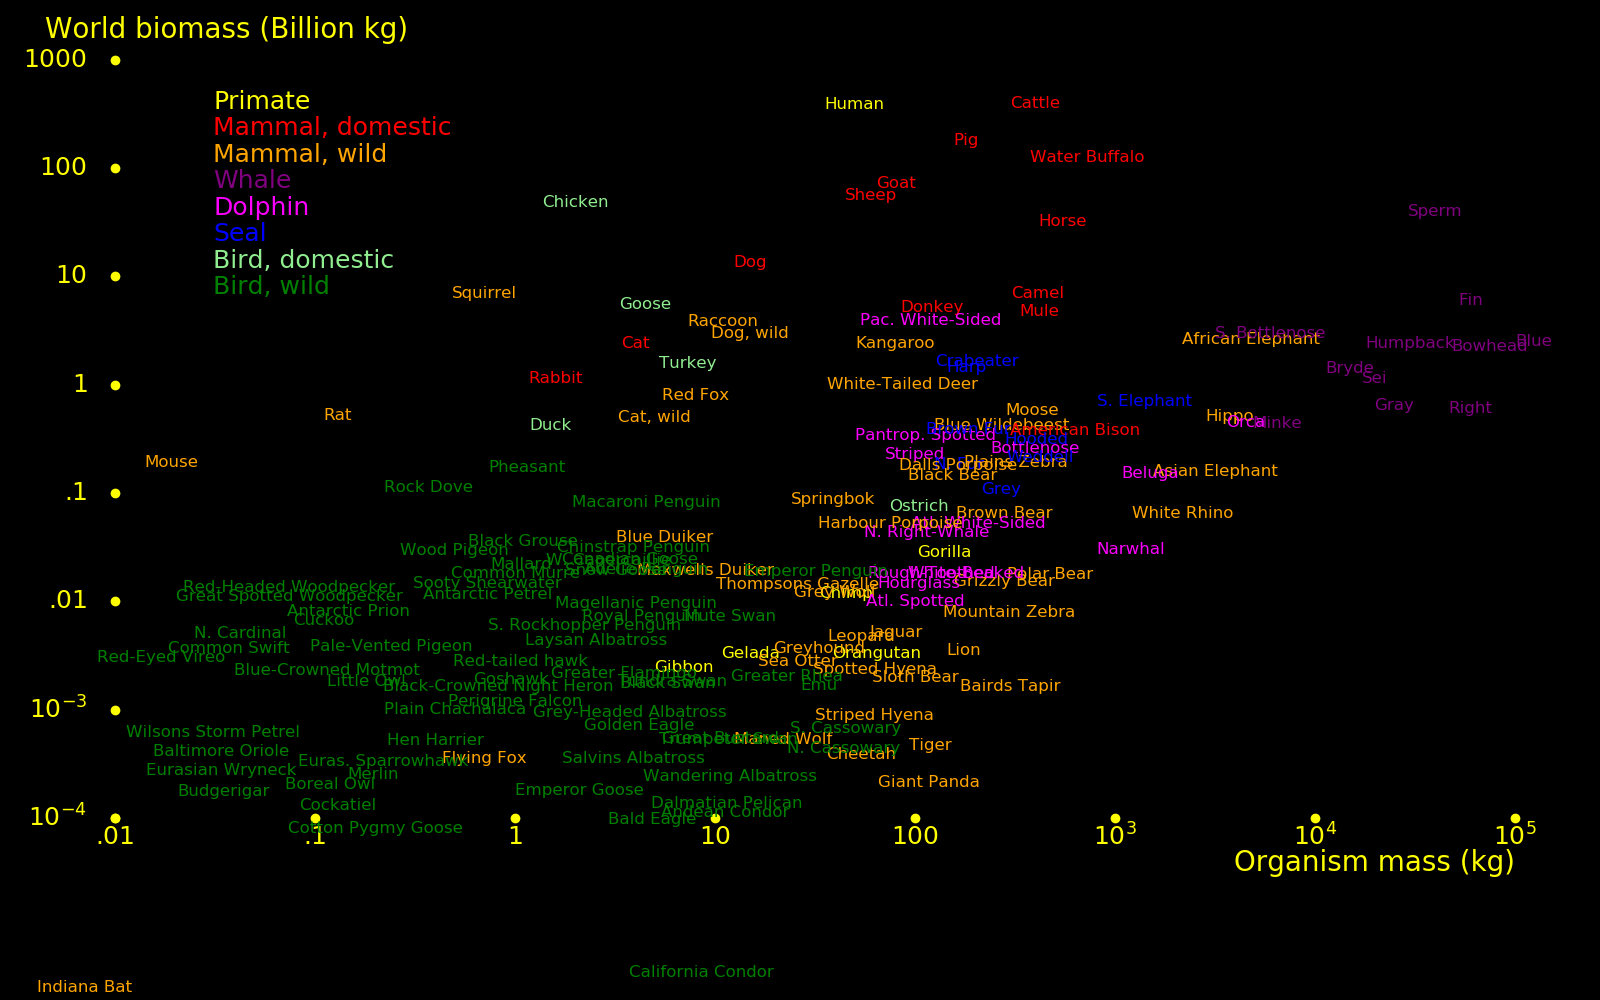
For mammals and birds, biomass is dominated by domestic animals.
Mammal biomass is dominated by humans and cattle.
The larger the organism, the more accurate the population data. Populations for many small species are unknown.
 |
|---|
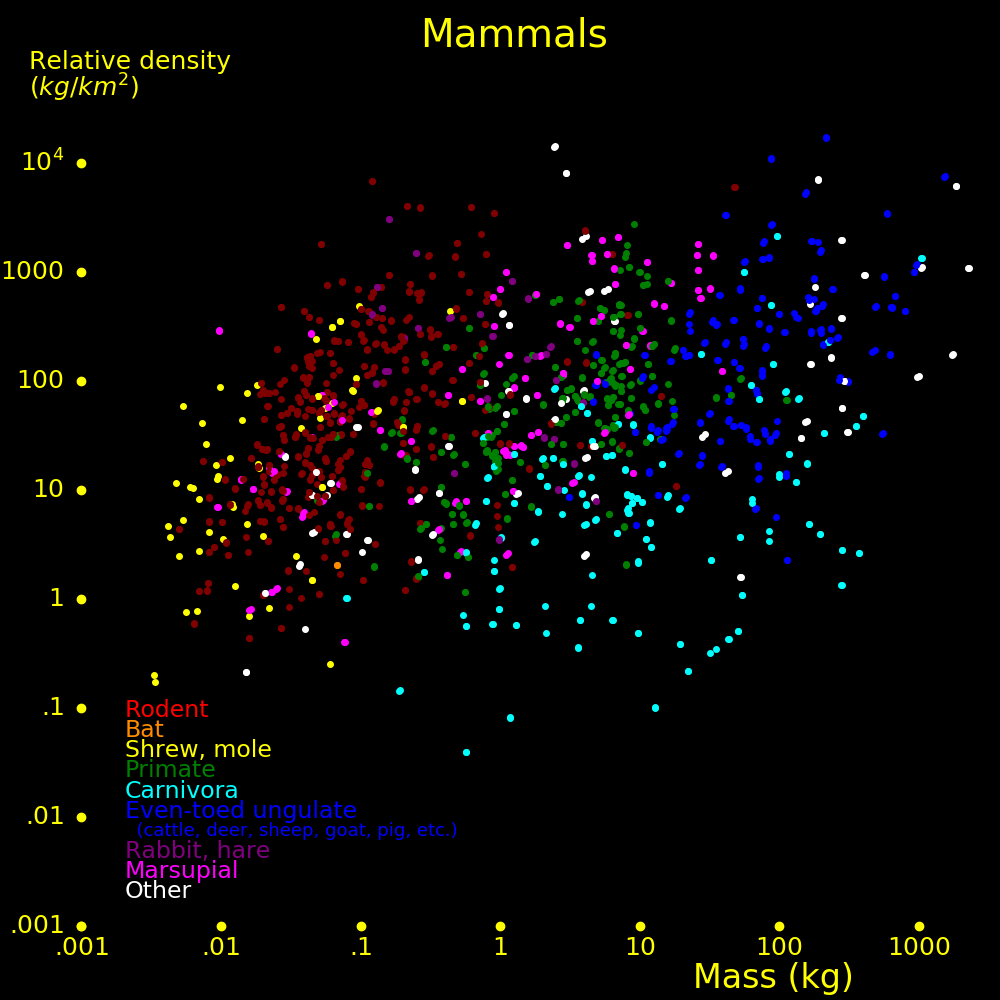
Mammal biomass is approximately constant over the range of animal sizes.
 |
|---|
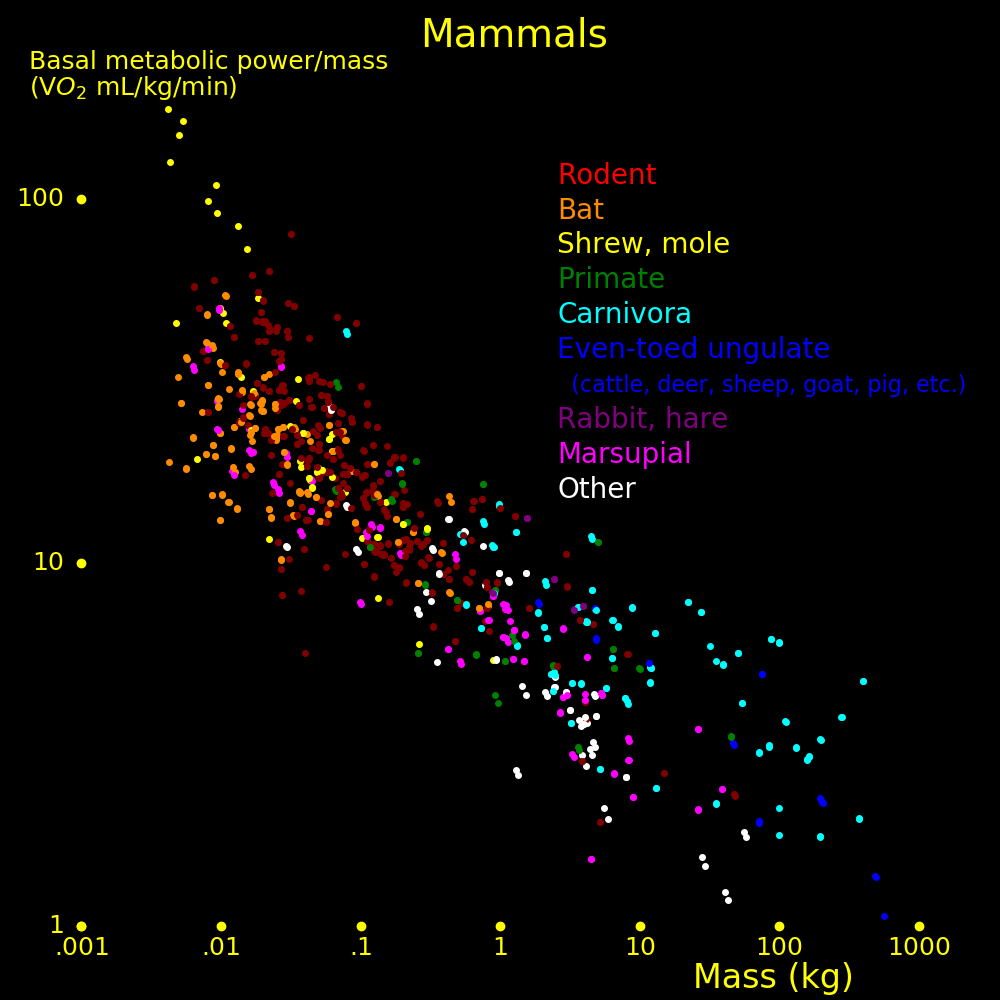
Data from pantheria.org.
Metabolic power/mass scales as Mass-1/4.
The biomass distribution scales as Mass0, hence most mammal metabolic power is expended by small organisms, not large organisms.
 |
|---|
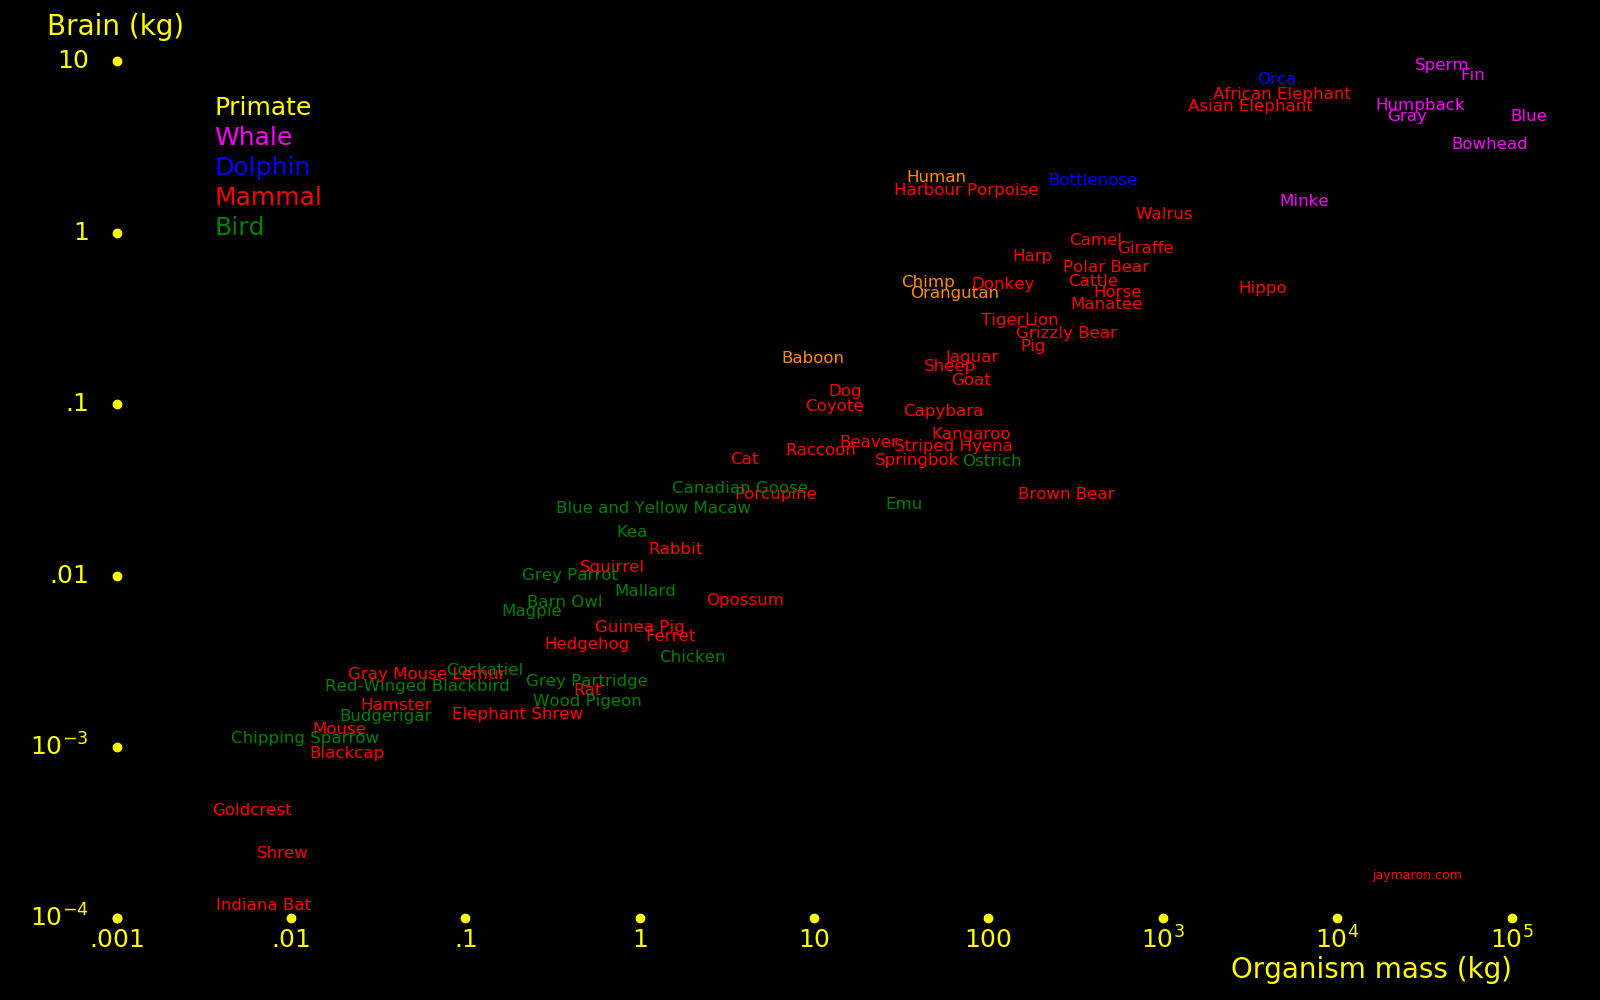
Data from pantheria.org.
A human brain is 1.6 kg and uses 20 Watts.
 |
|---|
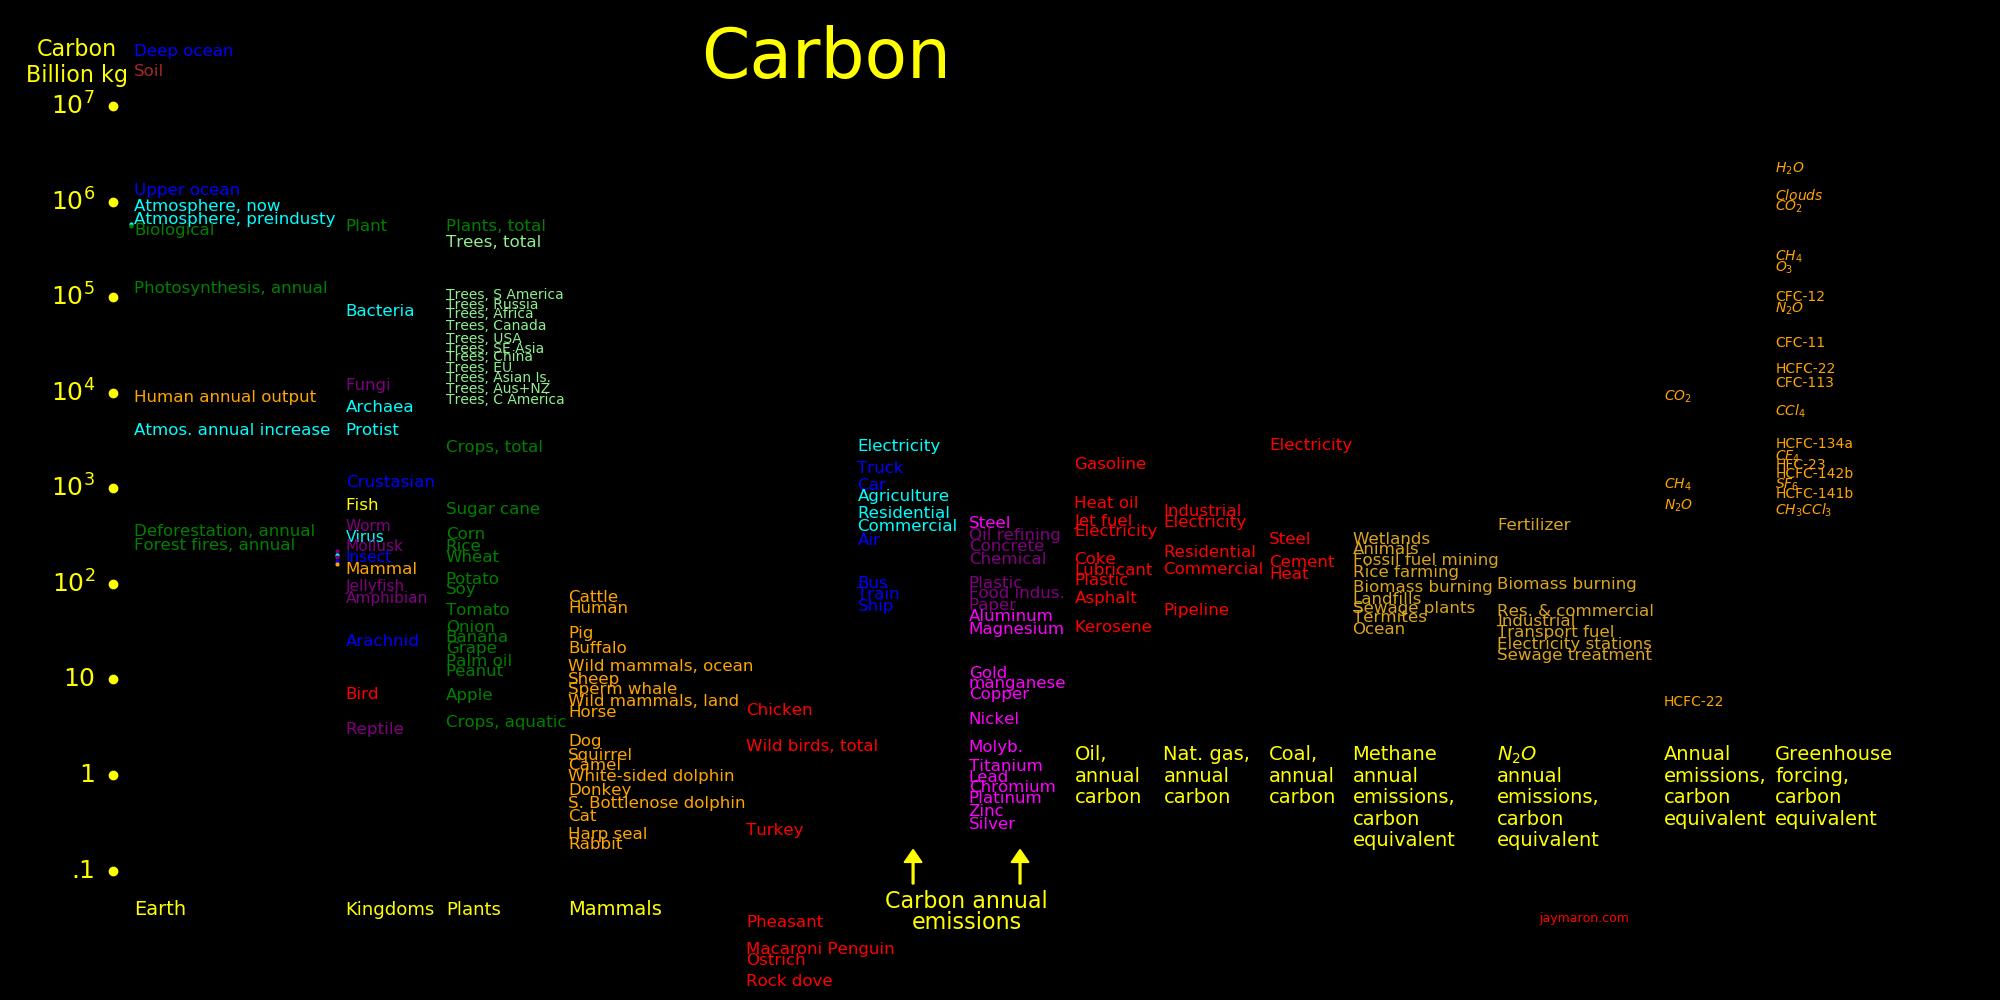
Land               Bkg             Ocean        Bkg

Plants         3300000             Crustasian  4800
Plants, trees  2600000             Fish        4200
Bacteria        420000             Mollusk     1140
Fungi            72000             Plant       1000
Archaea          42000             Jellyfish    620
Protist          24000             Mammal       120
Crops            14000             Virus        100
Worm              1320
Virus             1100
Insect            1050
Amphibian          600
Arachnid           150
Mammal, wild        30
Reptile             18
Bird, wild          12

Mammal, human      360
Mammal, domestic  1000
Bird, domestic      30
 |
|---|
World biomass Population Mass
Bkg millions kg
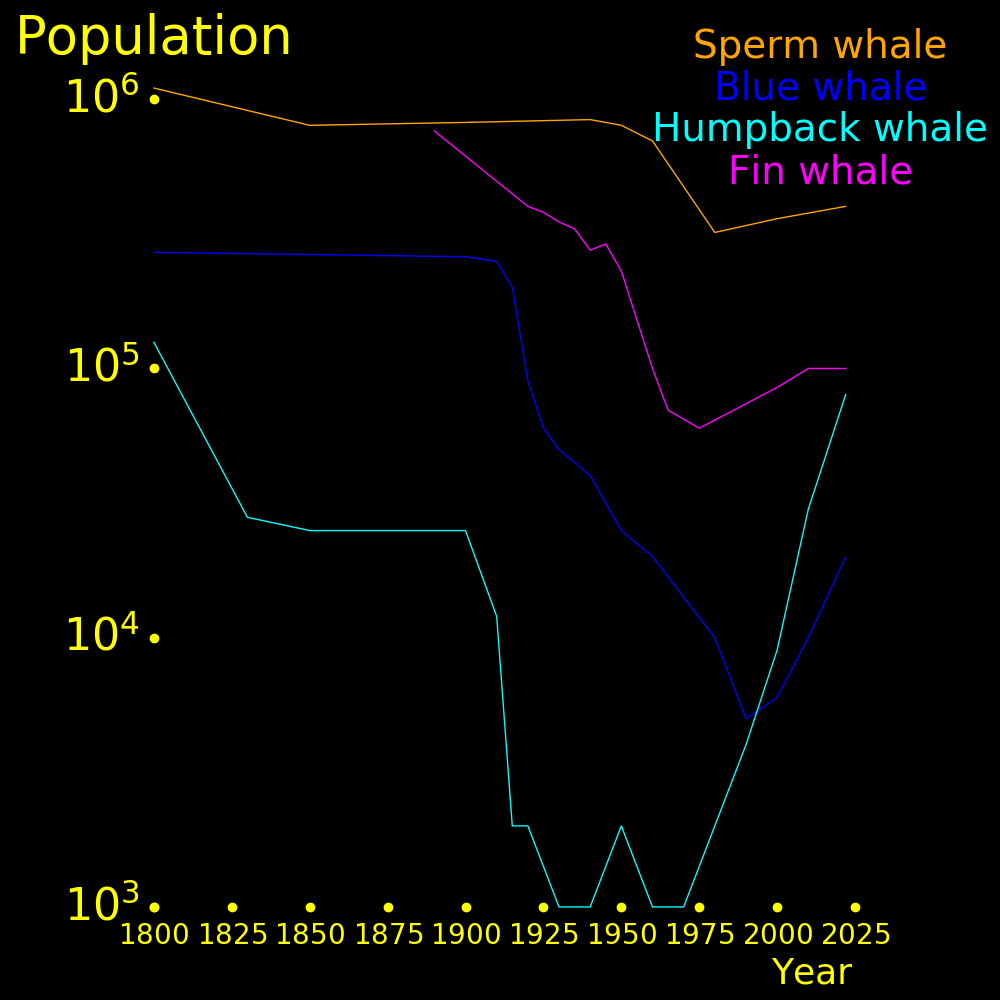
Whale, total 40 1.5
Dolphin, total 7 50
Seal, total 6 25
Whale, sperm 16 .40 40000
Whale, fin 6 .10 60000
Whale, S Bottlenose 3 .5 6000
Whale, blue 2.5 .02 125000
Whale, humpback 2.4 .080 30000
Whale, bowhead 2.2 .030 75000
Whale, bryde 1.4 .095 15000
Whale, sei 1.1 .057 20000
Whale, right .6 .01 60000
Whale, gray .6 .026 25000
Whale, orca .4 .1 4500
Dolphin, white-sided 4.9 41 120
Dolphin, orca .45 .1 4500
Dolphin, spotted .3 3 113
Dolphin, bottlenose .24 .6 400
Dolphin, striped .2 2 100
Seal, crabeater 1.6 8 204
Seal, harp 1.4 8 180
Seal, elephant .7 .5 1400
Seal, brown fur .4 2.1 185
           World biomass   Mass   Population
               Bkg          kg

Dog, wild       3
Fox, red        1.2          8
Cat, wild        .5
Bear, black      .15       154
Bear, brown      .06       278
Bear, polar      .018      475
Jaguar           .005       81
Leopard          .004       54
Wolf, grey       .002       40
         World biomass (Bkg)

Squirrel      7
Raccoon       3.8
Elephant      2.4
Rat           1.9
Kangaroo      1.2
Rabbit        1.1
Deer          1.0
Fox            .8
Moose          .58
Hippo          .45
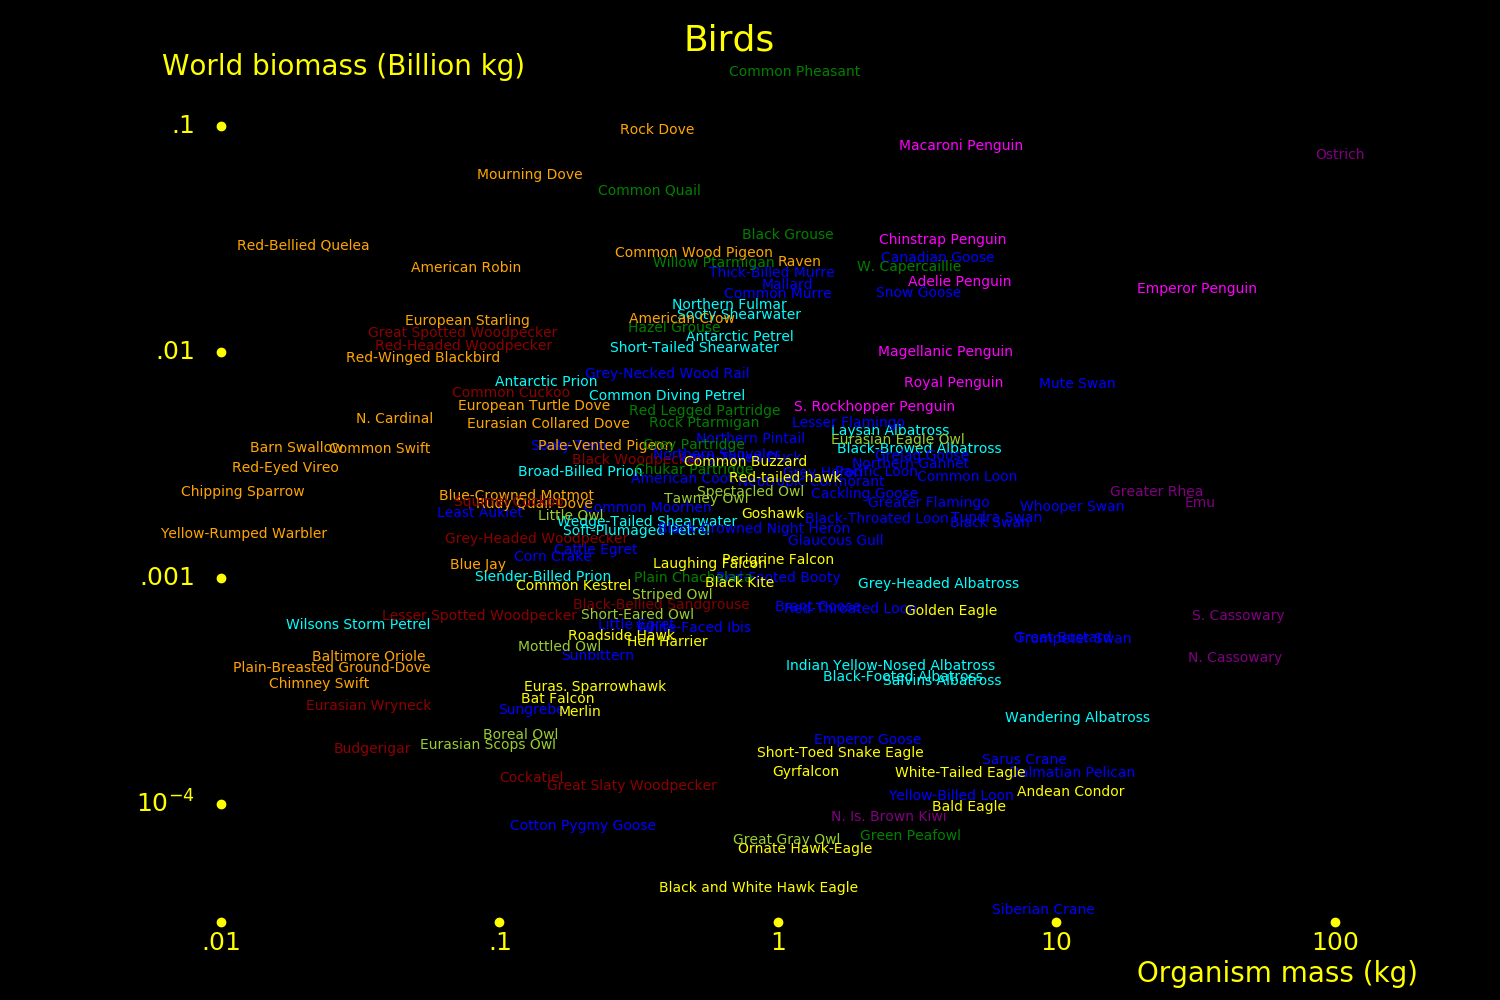
           World biomass   Population   Mass
                Bkg         millions     kg

Duck total       .10         100         1.0
Goose total      .07          20         3.75
Swan total       .02           2        10

Duck, mallard    .021         19         1.08
Duck, pintail    .004          5.35       .8
Duck, long-tail  .004          5          .74

Goose, Canadian  .022          6         3.75
Goose, snow      .019          6         3.2

Swan, mute       .0072          .605    11.9
Swan, whooper    .0021          .18     11.4
Swan, tundra     .0018          .3       6.1
Swan, black      .0017          .3       5.8
Swan, trumpeter  .0005          .046    11.6
              World biomass   Population   Mass
                   Bkg         millions     kg

Hawk, red-tailed     .0028       2.6      1.06
Goshawk              .0019       2         .956
Buzzard              .0017       4         .43
Peregrine falcon     .0012       1.2      1.0
Kestrel              .0009       5         .184
Falcon, laughing     .0009       1.6       .57
Hen Harrier          .0005       1.3       .40
Hawk, roadside       .0004       1.6       .275
Hawk, Eurasian       .0003       1.5       .22
Merlin               .0003       1.3       .195
Gyrfalcon            .0002        .11     2.1

Eagle, golden        .0007        .17     4.18
Eagle, snake         .0002        .1      1.68
Eagle, bald          .0001        .02     4.85
Eagle, hawk          .0001        .1       .85

Heron, grey          .0014       1.0      1.4
Egret, cattle        .0012       5.4       .22
Heron, boat-billed   .0003       1.6       .2
For Manhattan,
           Mass  Number per  Number per   Mass/area
                   person     hectare
            kg                            (Humans=1)

Human       65      1          300        1
Cat, wild    3.9     .143       43         .0086
Pigeon        .27   1.5        450         .0062
Rat           .32   1.0        300         .0049
Squirrel      .5     .03         7.5       .00023
 |
|---|
   Year

 -11000     Livestock
  -9500     Crops
  -6000     Crop rotation. 2-field system
  -4000     Ox power
  -3500     Horse
      0     Trade network
    900     3-field system
   1492     Columbian exchange. Guano fertilizer introduced
   1700     4-field system. Nitrogen-fixing plants
   1800     Fertilizer becomes widespread
   1850     Mechanization
   1895     Refrigeration
   1950     Pesticides
   1980     Genetic engineering
English wheat yield:
Year    Wheat yield (kg/hectare/year)

1500       .018
1550       .022
1600       .029
1650       .031
1700       .038
1750       .047
1800       .063
1850       .073
2020       .8
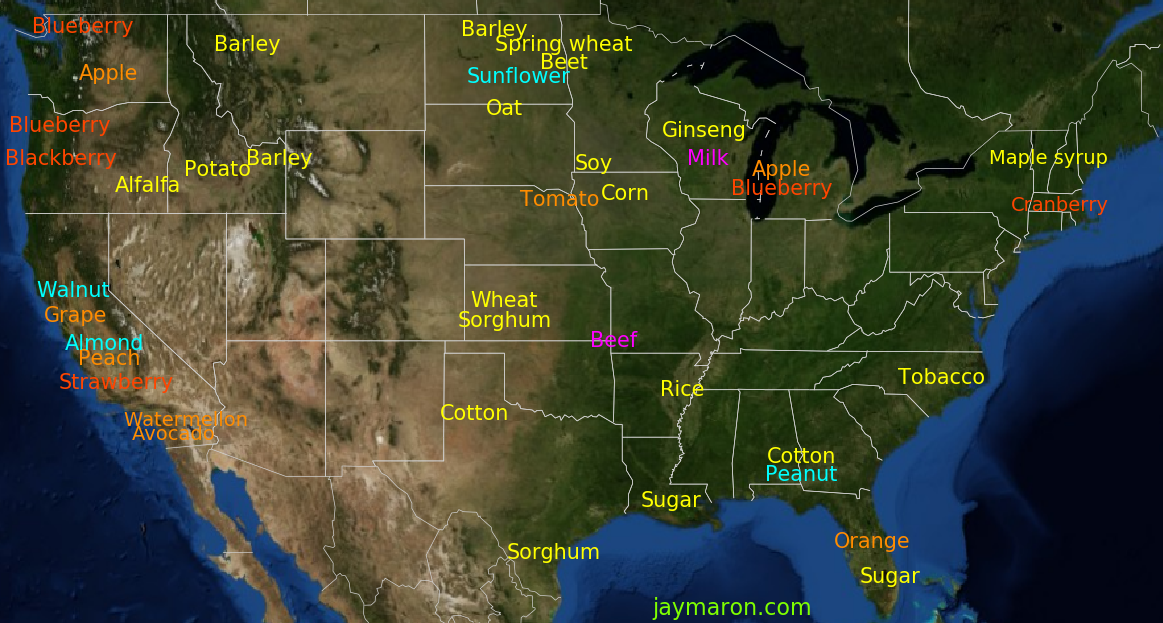
Crop locations are decided by rain, rivers, lakes, reservoirs, aquifers, and aqueducts. Prime farmland is for crops and subprime land is for grazing. There is 2.2 times as much grazing land as cropland, and agriculture is 38% of world land.
The plot shows the center of mass for crops.
 |
|---|
 |
 |
 |
 |
|---|---|---|---|
Land can support more people with wheat than with beef, by a factor of 16. Sugar cane is more efficient than wheat by a factor of 16.
Farm productivity is expressed as kg/meter2/year of food. If we factor in the calorie content of the food, we can express this as food production power in Watts/meter2. The value for wheat is 16 times larger than for beef.
The table shows the production power for various foods, with a comparison to solar cells and wind turbines.
              Production   Energy/Mass    Power    Type of energy
             kg/meter2/yr   MJoule/kg  Watt/meter2

Solar cell           -         -        40         Electricity
Wind turbine         -         -        15         Electricity

Algae               10        16         5.1       Biomass
Bamboo               2        16         1.0       Biomass
Grass                1        16          .50      Biomass
Typical tree          .5      16          .25      Biomass

Sugar cane           8        16         4.1       Food
Wheat                 .5      14          .22      Food
Milk                  .6       2.1        .040     Food
Fish                  .1       9          .028     Food
Goose (grazing)       .1       9          .028     Food
Beef (grazing)        .05      9          .014     Food
Tomato               8        .8          .20      Food
Tomato, hydroponic 150        .8         3.8       Food
For most crops, 50% of the plant biomass is edible produce.
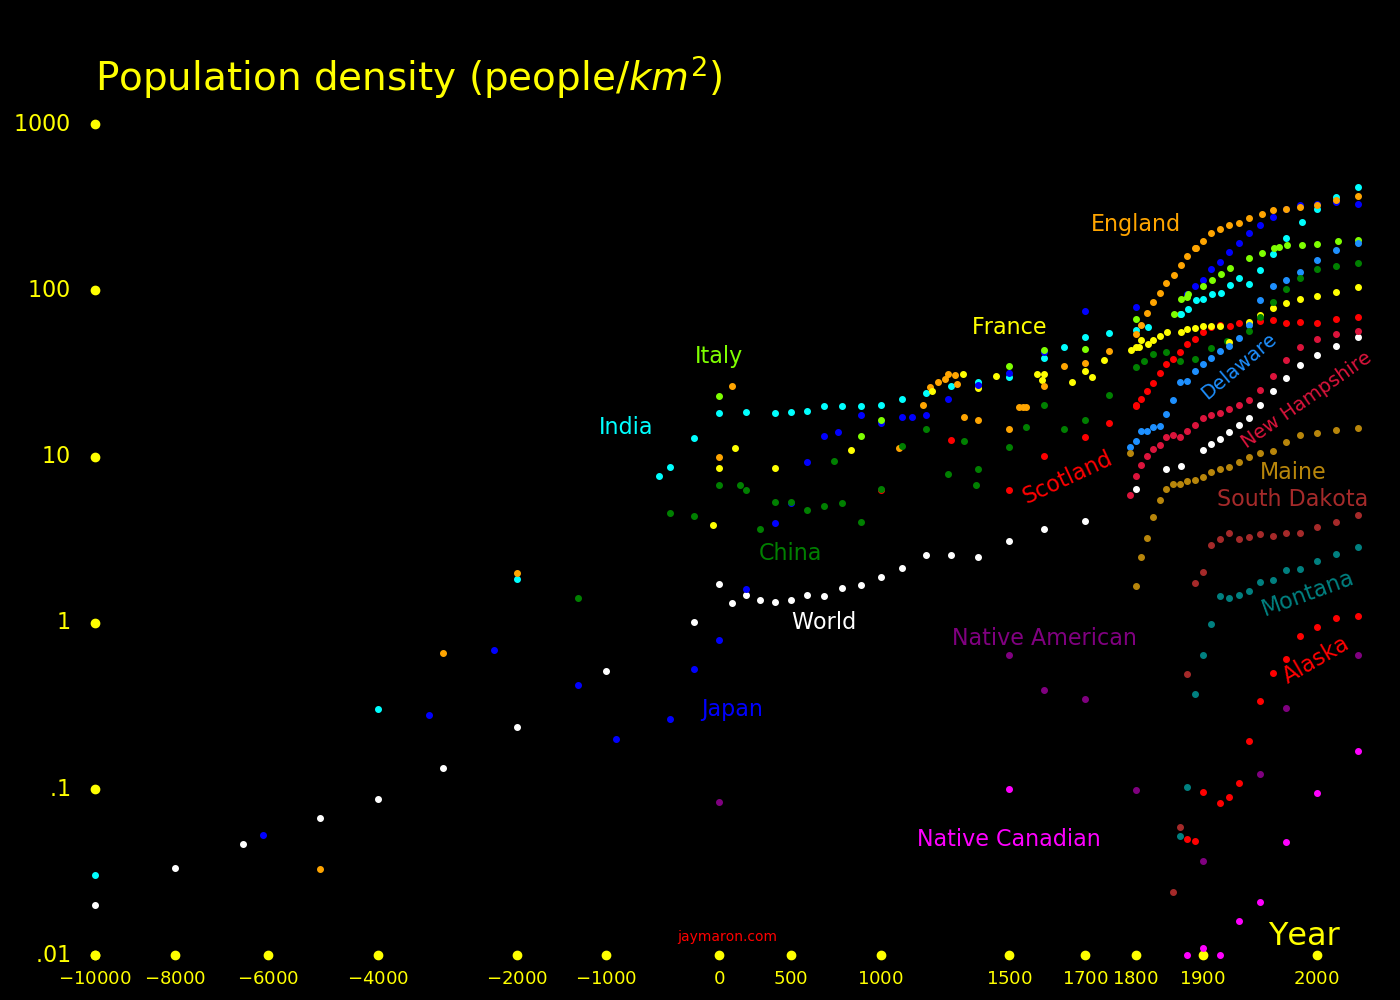
In 1850, a family of 4 could be supported by 40 acres, and this is the origin of the phrase "40 acres and a mule". This corresponds to 25 people/km2. At the time, world population was 8 people/km2 and today it's 50 people/km2.
It takes 120 Watts of food energy to support a human. If the calories come from cane sugar, then land can support 30000 people/km2.
Wild mammal biomass is 30 Bkg and human biomass is 360 Bkg.
Land is cheaper in Brazil than Iowa. In Iowa, land is 1/2 the overall cost and in Brazil it's 1/4.
Iowa pays less for fertilizer than Brazil, but they pay more for seeds.
Labor is only 1/15 the cost, for both Iowa and Brazil.
Costs are in $/acre/year.
               Iowa    Iowa    Iowa   Brazil  Iowa
               cows    corn    soy     soy    grass

Land            56     256    256      60      55
Labor           22.9    42.7   33.6    20      33
Seed             -     114.4   49.2    25       -
Machinery        5.2    70.2   64.5    40      20
Other            5.2    31.9   26.9    16       -

Nitrogen        27.2    71.7    -       -      58
Phosphorus      11.7    29.6   19.5    25      19
Potassium       12.0    18.3   27.9    35       -
Lime             -      15.7   15.7    15       -

Herbicide        4.6    39.6   48.7    40       5
Insecticide      -      18.4    -      10       -
Fungicide        -       -      -      25       -
Other pesticide  -       -      -       4       -

Total          137.9   770.8  542.0   315      181
 |
|---|
A simple and cheap fertilizer recipe is:
                   Relative mass

Urea                    4
Potassium chloride      4
Monoammonium phosphate  1
Calcium chloride        1
Magnesium chloride      1
Ammonium sulfate        1
Growing 1 kg of biomass requires the following elements:
        Element  Cheapest form          Molecule    Cost   Fertilizer   Element frac   Element cost
         gram                                        $        gram      in fertilizer     gram/$

Nitrogen    15   Urea                   CO(NH2)2    .025      26            .467          482
Potassium   15   Potassium chloride     KCl         .044      29            .524          340
Phosphorus   2   Monoammonium phosphate (NH4)2HPO4  .011       7            .269          185
Calcium      2   Calcium chloride       CaCl2       .011       6            .361          182
Magnesium    2   Magnesium chloride     MgCl2       .036       8            .255           55
Sulfur       2   Ammonium sulfate       (NH4)2SO4   .025       8            .243           79

Total                                               .152      84
Well-irrigated crops produce 1 kg of biomass per meter2 per year. Typical crops are 1/2 edible matter and 1/2 inedible matter. Trees can produce wood at a rate of 2 kg/meter2/year.
As an example, for nitrogen fertilizer,
Nitrogen requirement    = n =       =   15  grams           to produce 1 kg of biomass
Urea nitrogen fraction  = u =       = .456
Urea requirement        = U = n / u =   33  grams
Nitrogen cost per kg    = c =       =  482  gram/$
Nitrogen cost           = C = n/c   = .029  $
The appendix has a table with all possible fertilizer molecules.
Almost all vitamins fit into one pill, with the exception of calcium, potassium, phosphorus, and magnesium, which can be supplemented separately. The nutrient requirement for animals and plants is:
            Human       Bird         Crop         Supplement
           gram/day   gram/day      gram/kg

Calories     2200      165           0
Protein        50        9           0
Potassium       3.5       .4        14            Potassium phosphate
Phosphorus      1.0       .4         1.5          Potassium phosphate
Calcium         1.0       .8         2            Calcium chloride or calcium acetate
Magnesium        .35      .4         1.5          Magnesium chloride
Iron             .27      .2          .14
Zinc             .075     .05         .038
Manganese        .075     .05         .038
Copper           .022     .02         .011
Nitrogen        0        0          15            Ammonium nitrate
Sulfur          0        0           1.5          Ammonium sulfate
We assume a 75 kg human and a 1 kg bird. For other masses, scale accordingly. For crops, the nutrient requirement is in grams of nutrient required to produce 1 kg of biomass. Crop biomass is typically 1/2 edible food.
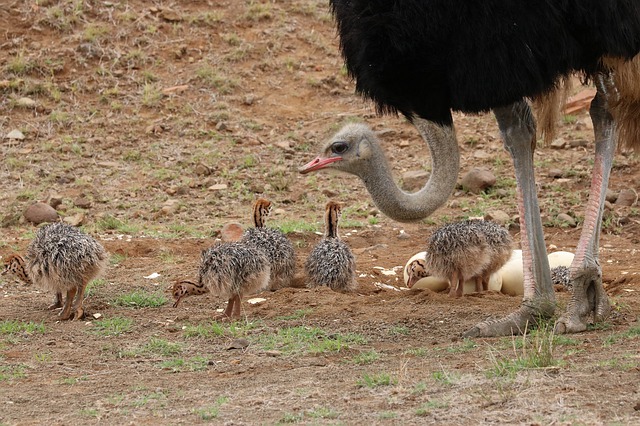
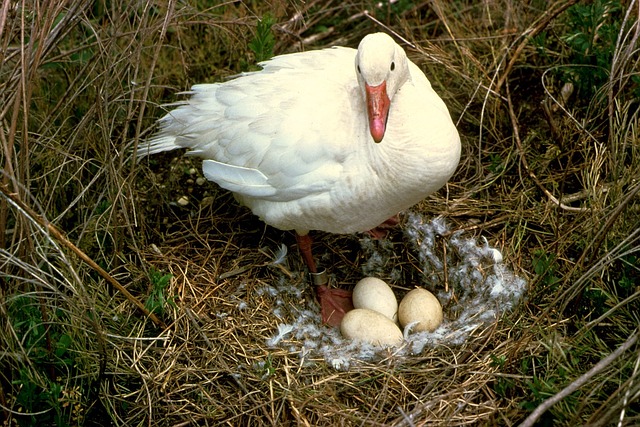
For young birds, calcium and phosphorus are especially important, for bones. For egg-laying birds, calcium is important for egg shells.
Bones are made of calcium and phosphorus, in a 2:1 ratio. For a 1 kg bird,
Calcium    = 14.0  grams
Phosphorus =  6.5  grams
Potassium  =  4    grams
Magnesium  =  1    grams
For bones,
Calcium fraction         = .279
Phosphorus fraction      = .130
Calcium/phosphorus ratio =  2.1
The best bone supplements are calcium chloride (CaCl2) and monopotassium phosphate (KH2PO4).
 |
 |
 |
 |
|---|---|---|---|
For a chicken egg,
            Mass     Calcium
            grams     grams

Egg total    60       1.95
White        36.6      .0023
Yolk         18.3      .028
Shell         5.1     1.92
Almost all the calcium is in the shell. Eggs are 3.2% calcium. Shells are 94% calcium carbonate (CaCO3) and calcium carbonate is 40% calcium.
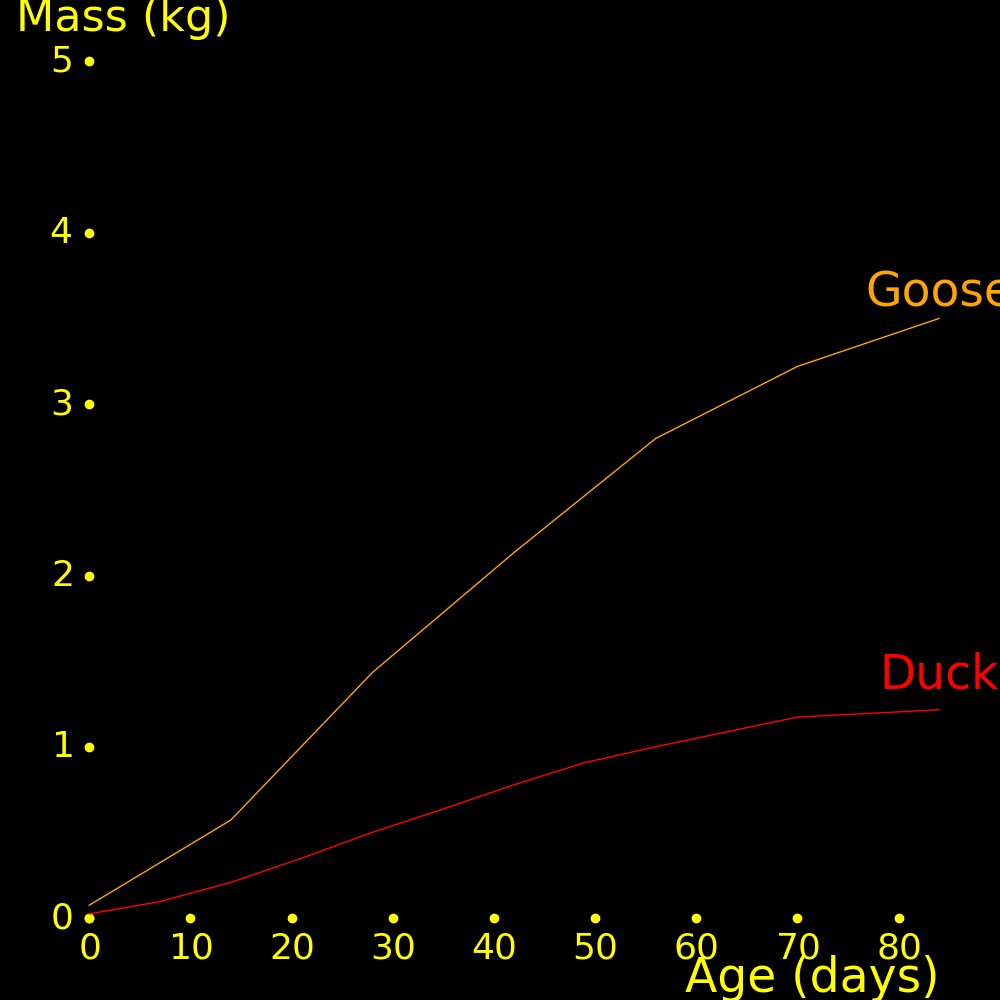
An egg is typically 3% of the mass of the adult bird.
It takes 50 days for a bird to grow to adult size.
 |
|---|
 |
 |
 |
 |
 |
|---|---|---|---|---|
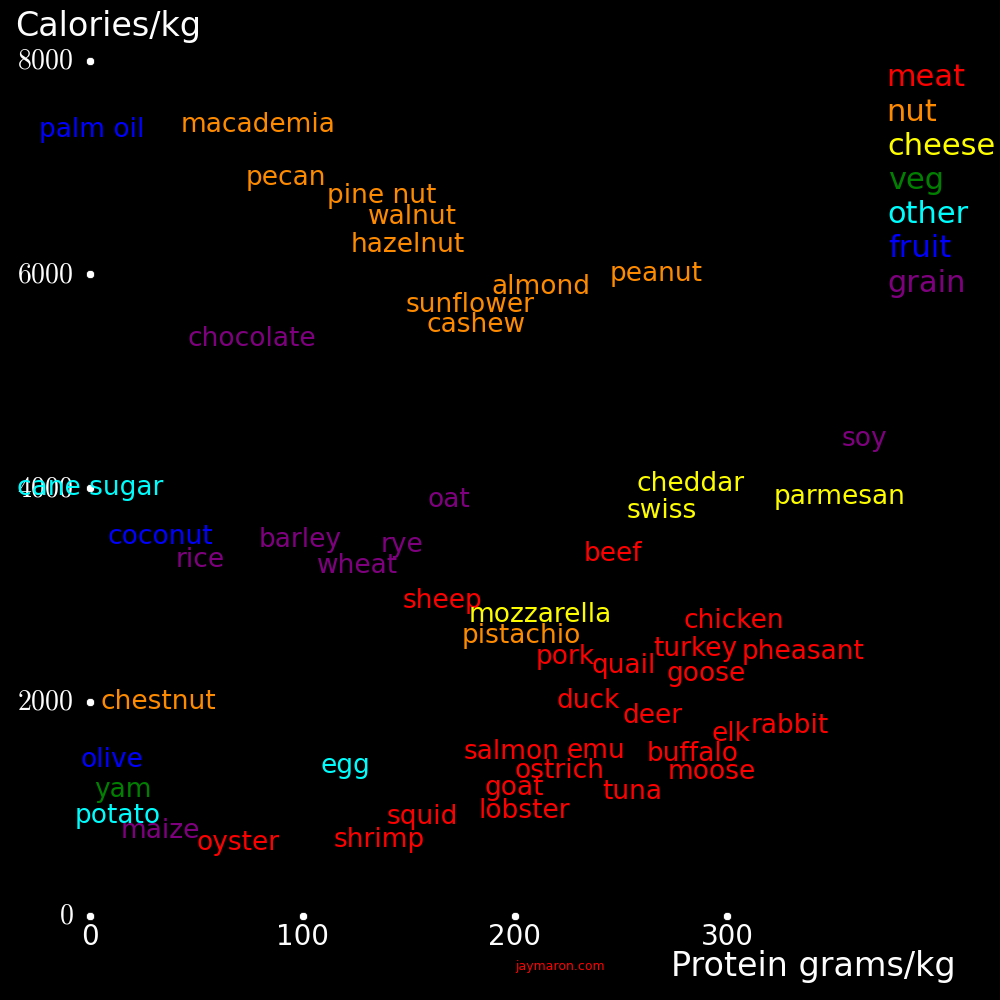
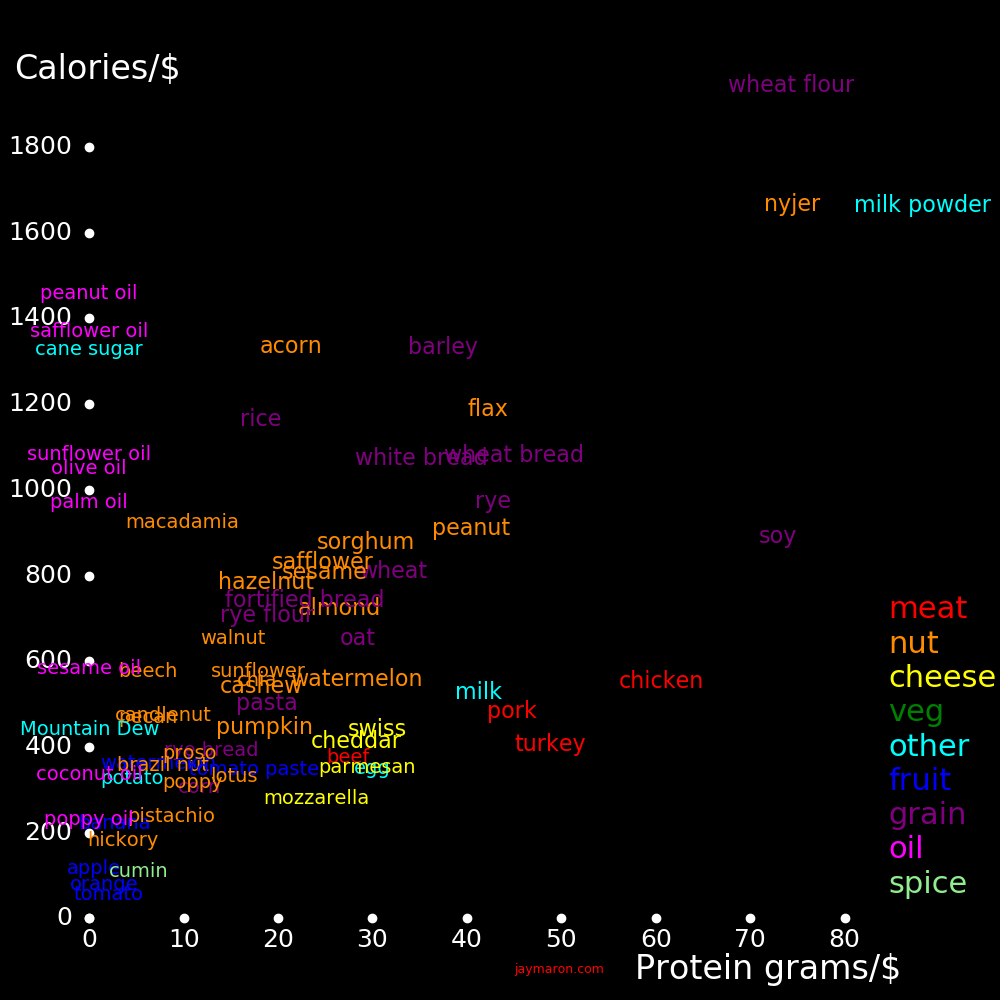
The left plot shows the protein and calorie content of food. Foods with high protein and low fat are in the lower right. Nuts are heavy in protein, especially peanuts.
The right plot shows how much calories and protein you get per dollar. The cheapest meats are pork, chicken, and turkey.
 |
 |
|---|---|
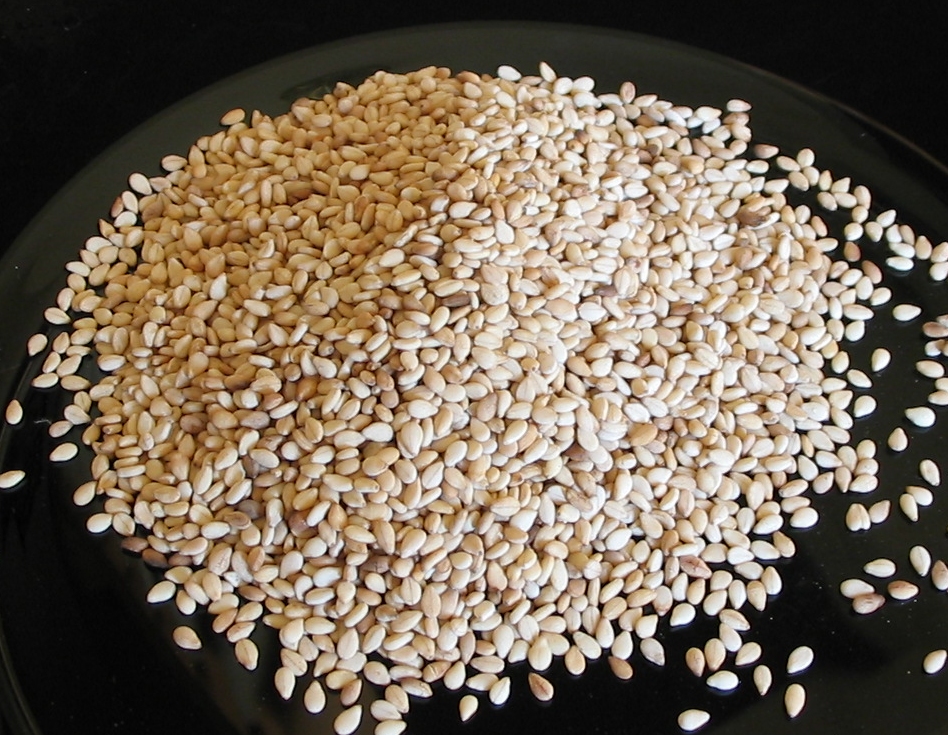
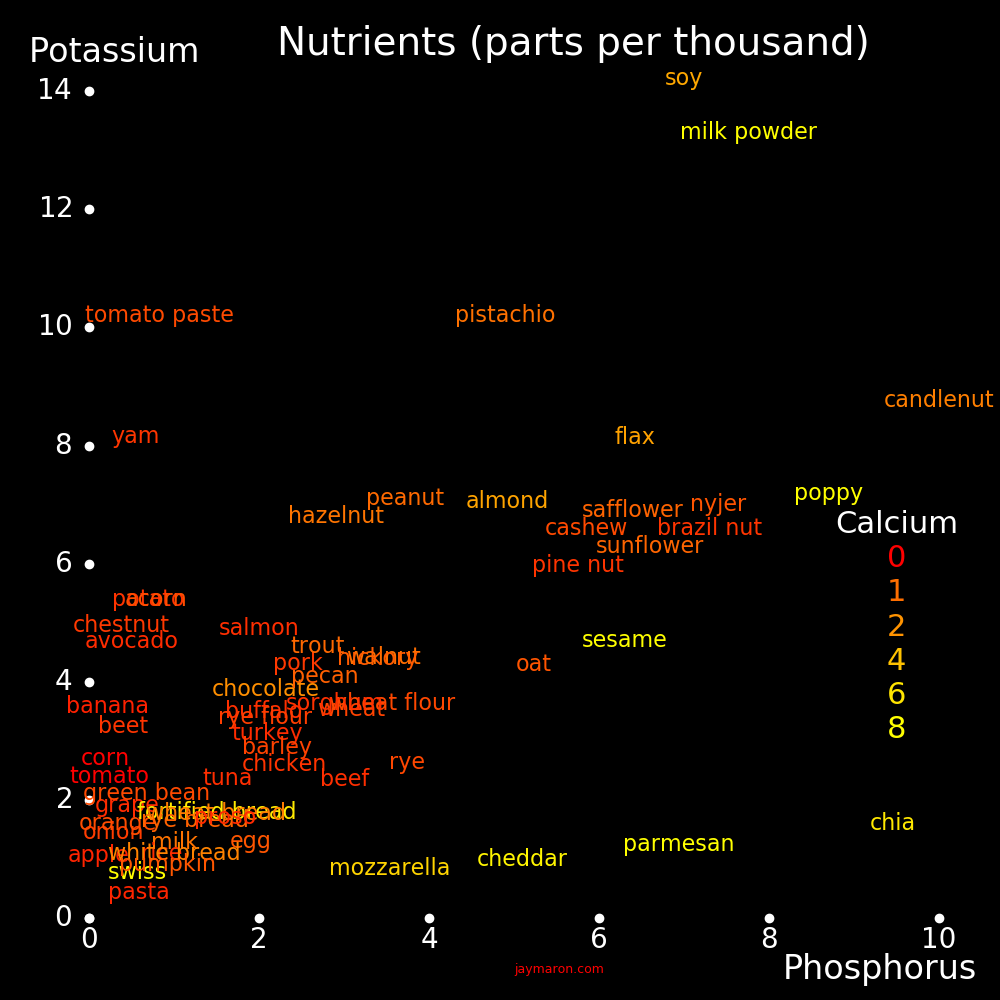
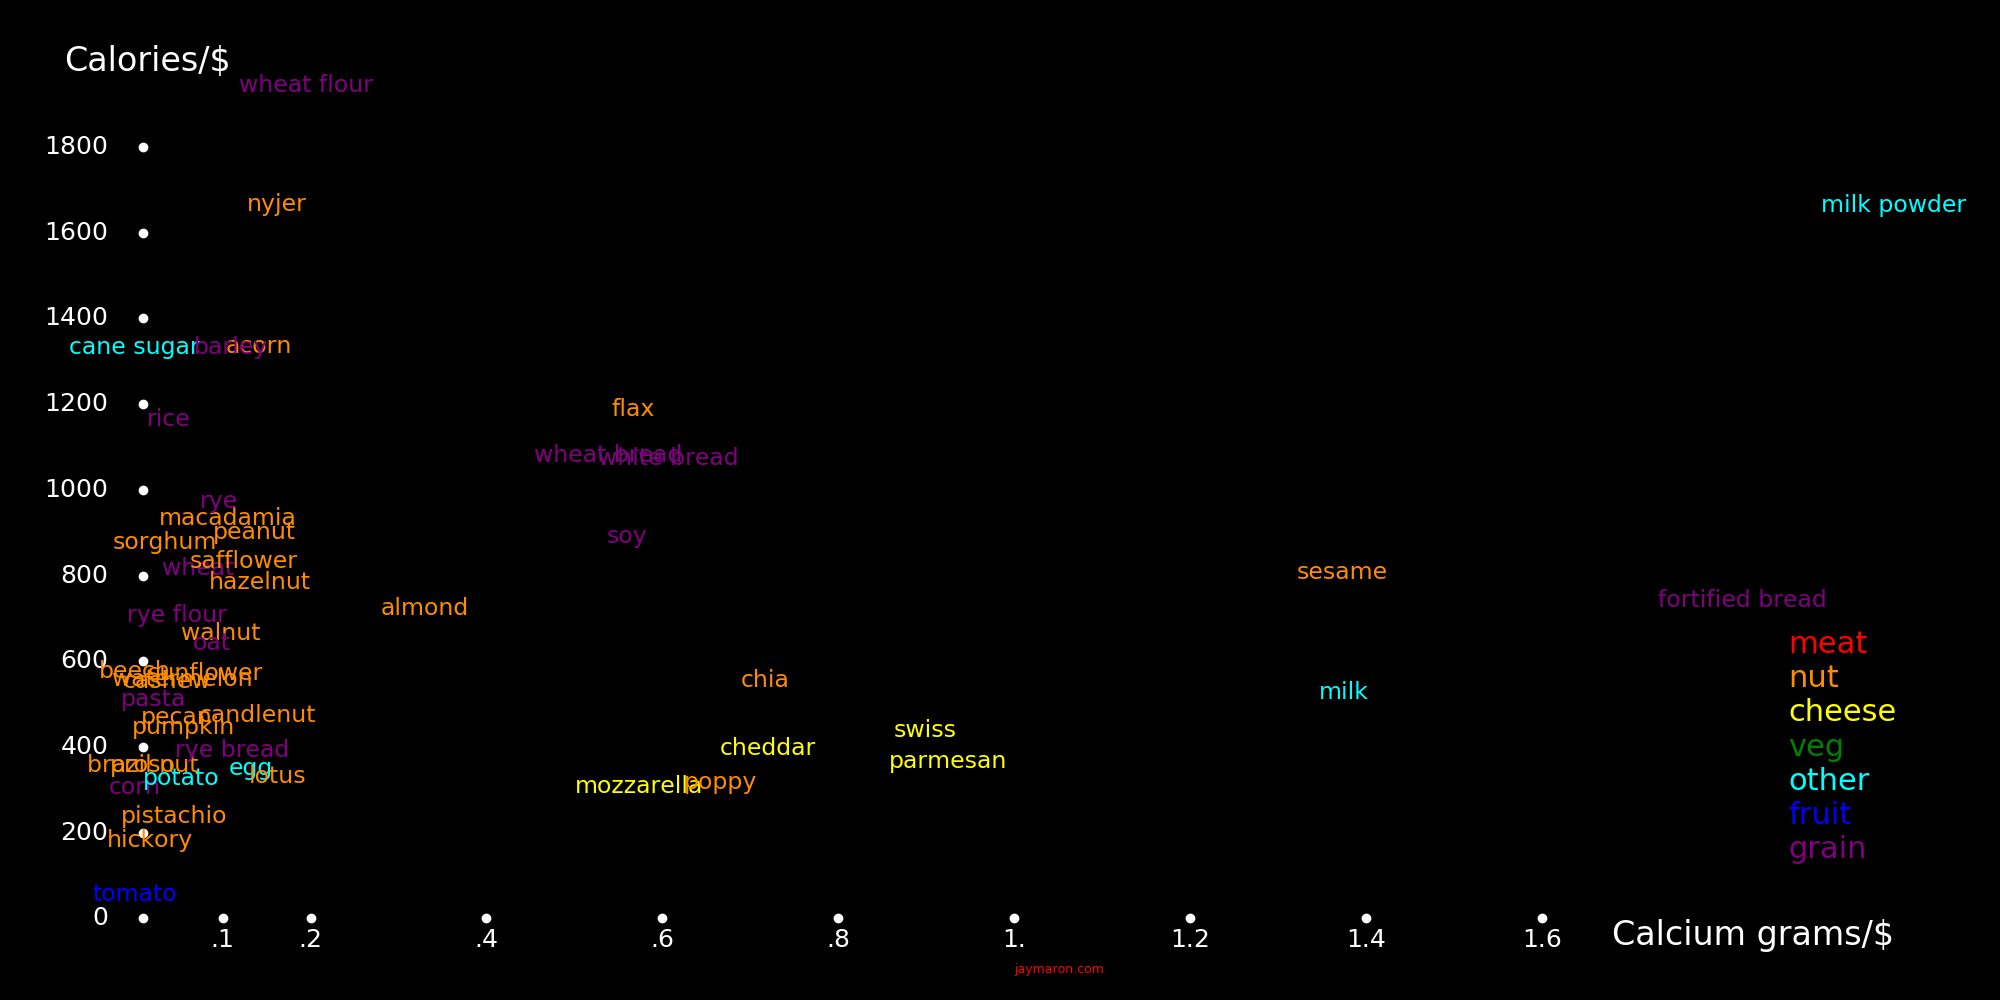
The plot shows the potassium, phosphorus, and calcium content of food. Calcium is abundant in cheese and milk and rare in other foods. Sesame is rich in calcium.
 |
|---|
 |
 |
|---|---|
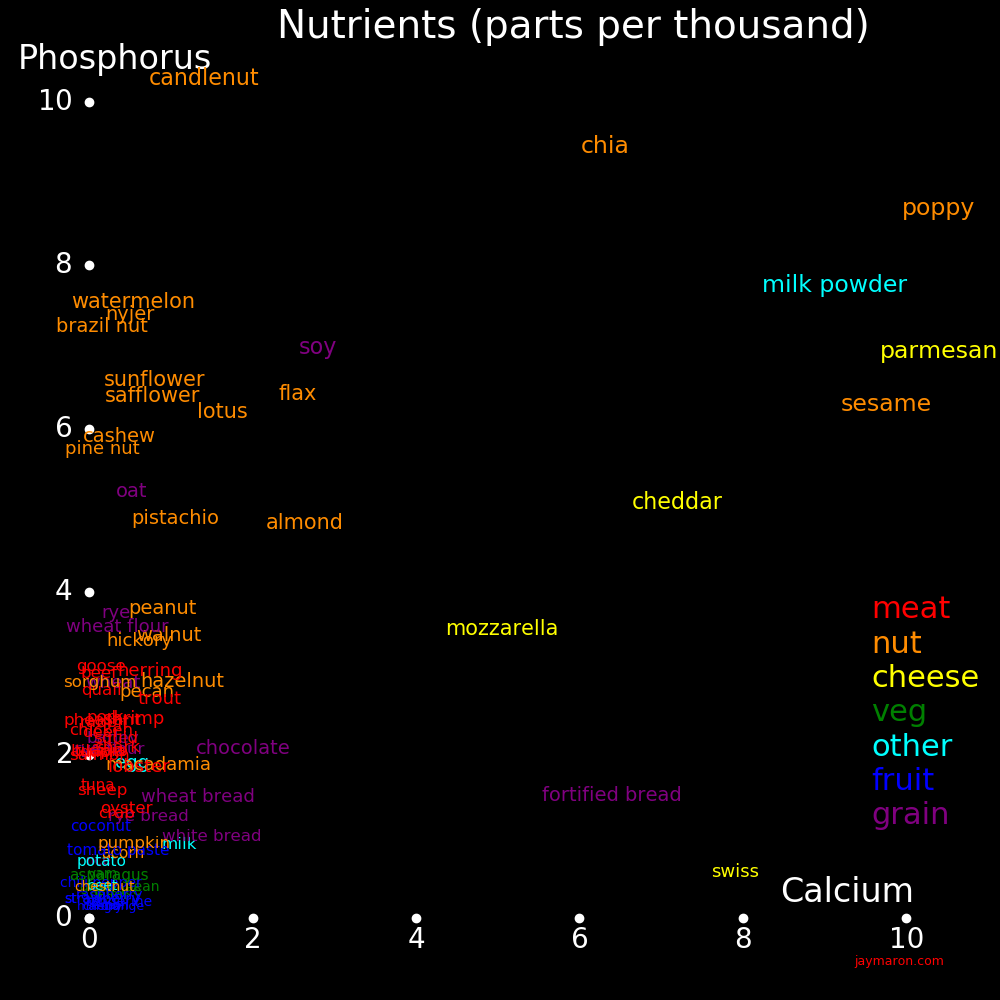
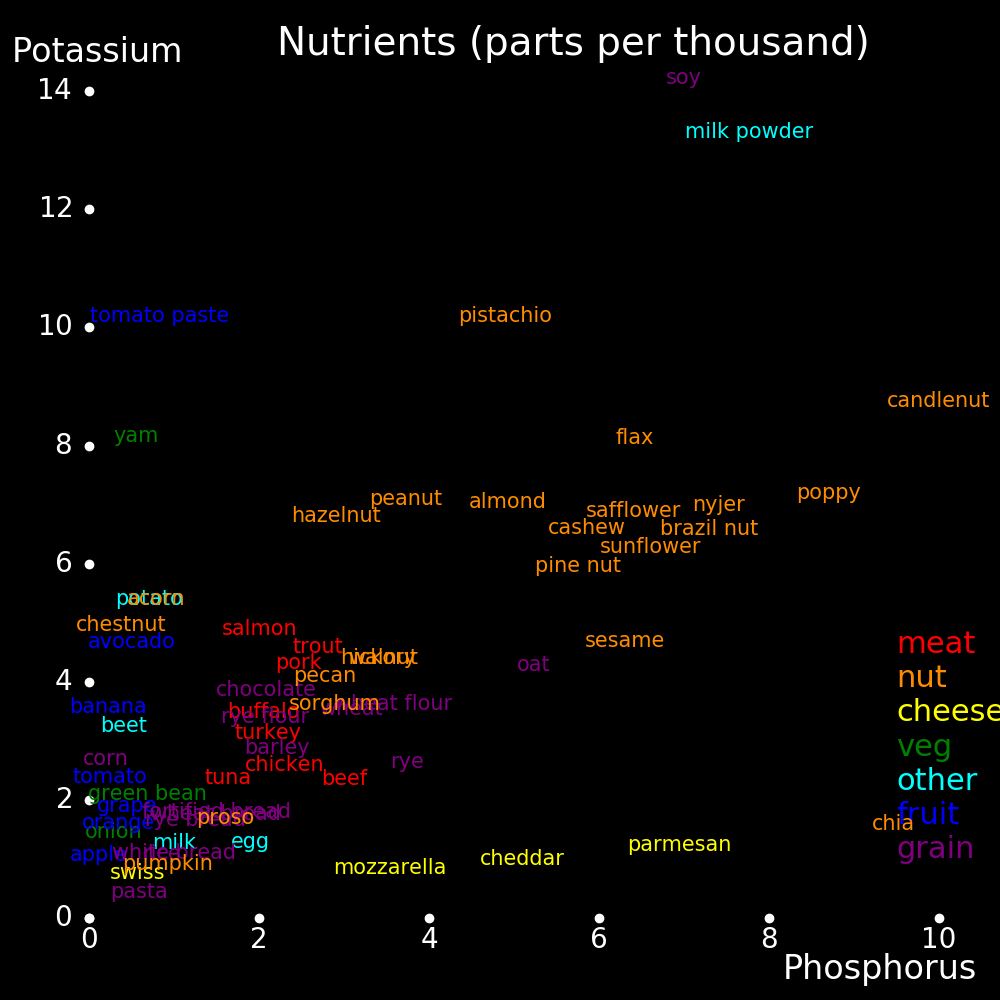
The plot shows the phosphorus and potassium content of food. Most nuts are rich in these elements.
 |
|---|
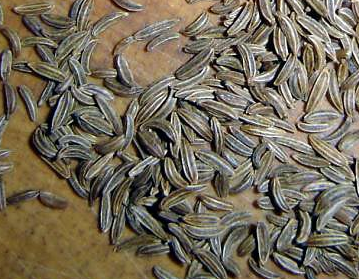
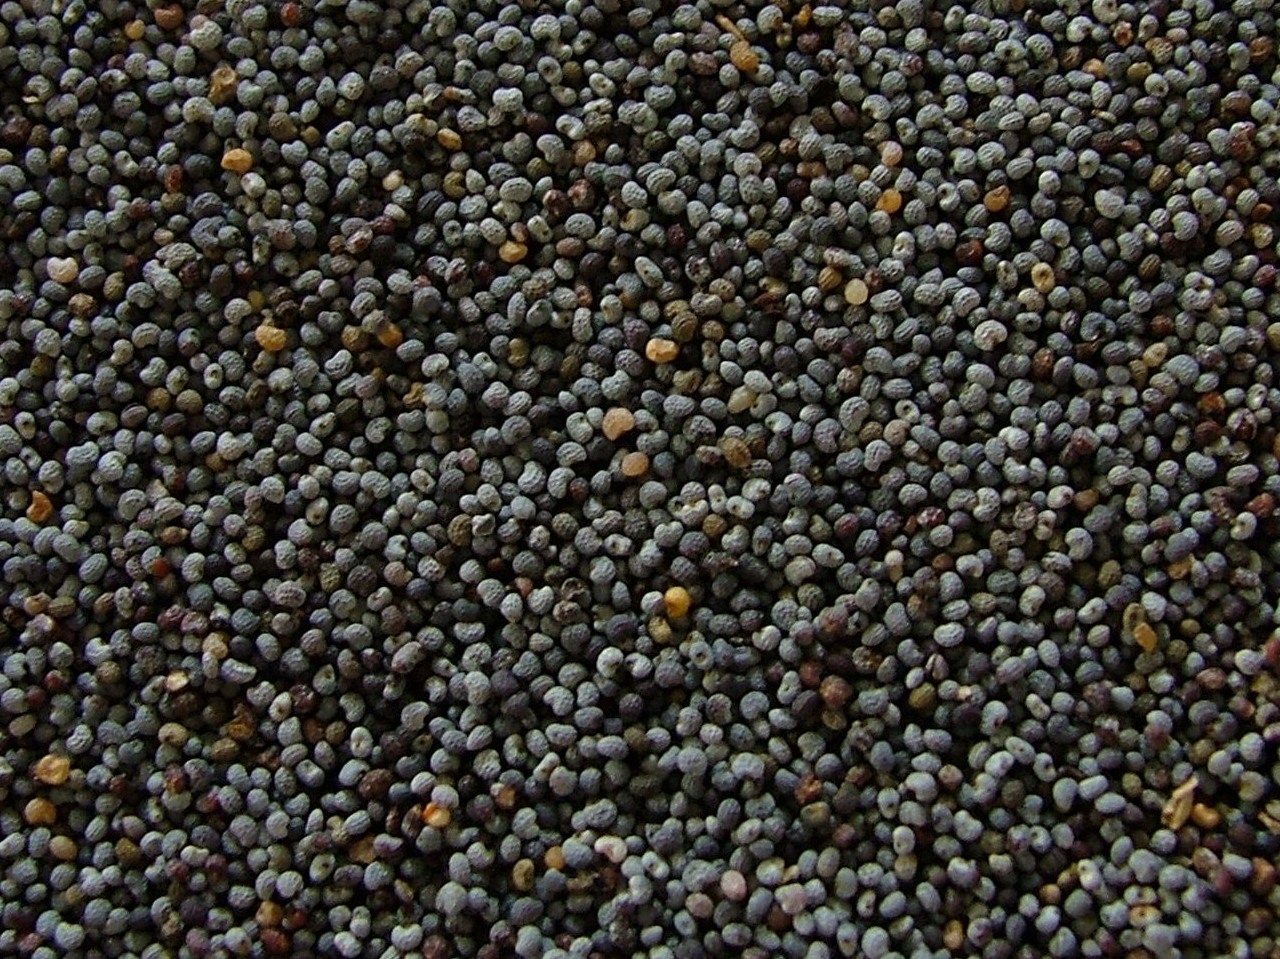
For bird seed, what matters is calories and calcium, and the best seeds are sesame and nyger.
 |
|---|
 |
|---|
 |
|---|
 |
 |
 |
|---|---|---|
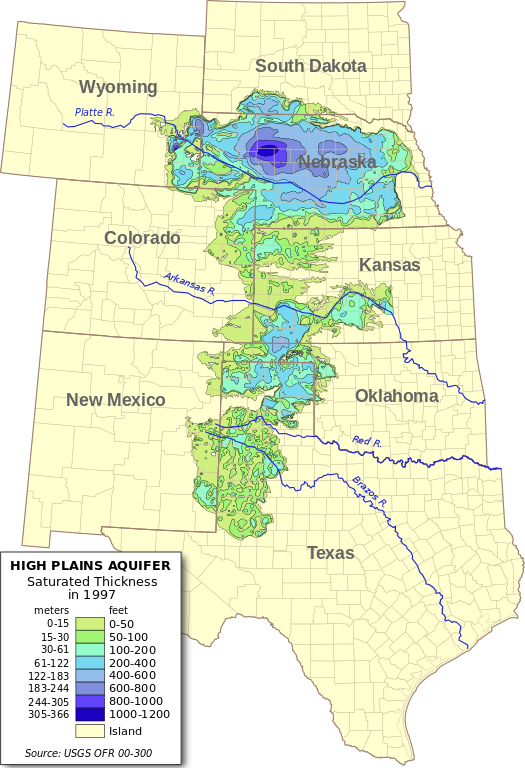
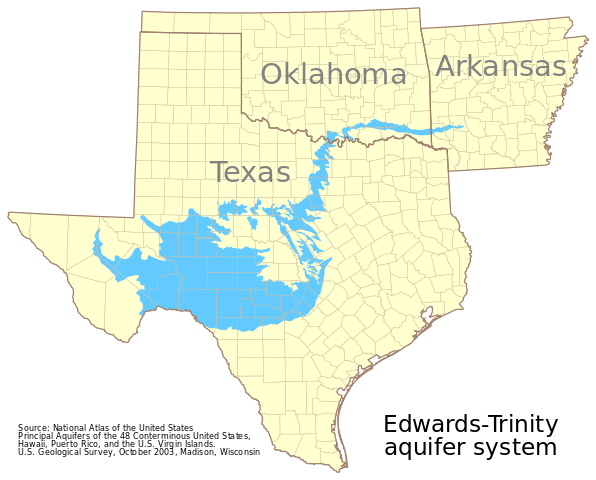
Water (km3)
Nebraska Ogallala 3608
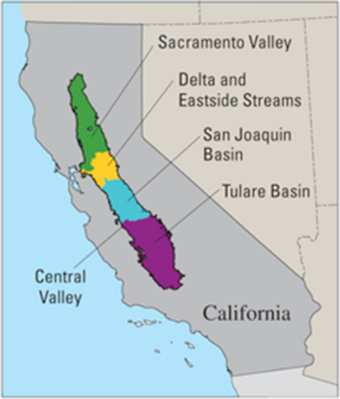
California Central Valley 2000
New Jersey Kirkwood Cohansey 67
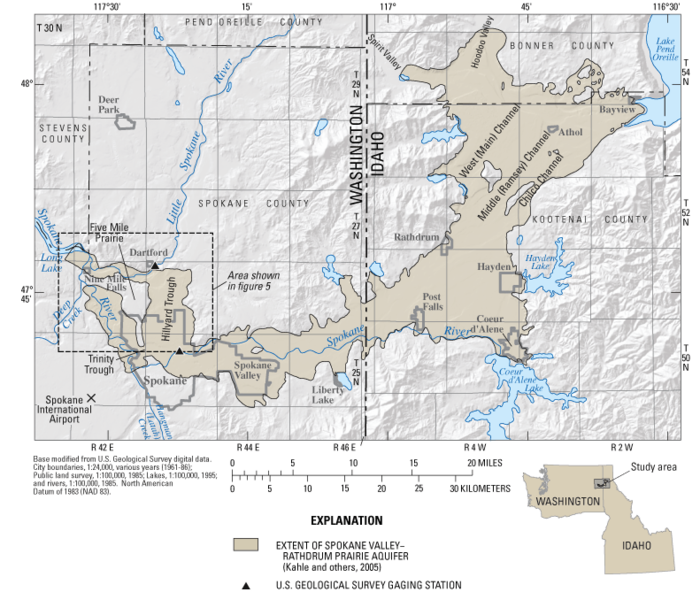
Washington Spokane Valley 38
Illinois Mahomet 15
Germany Upper Rhine 450000
Libya Nubian Standstone 150000
Australia Artesian Basin 64900
Brazil Guarani 40000
The Mississippi river is 531 km3/year.
 |
 |
|---|---|
 |
|---|
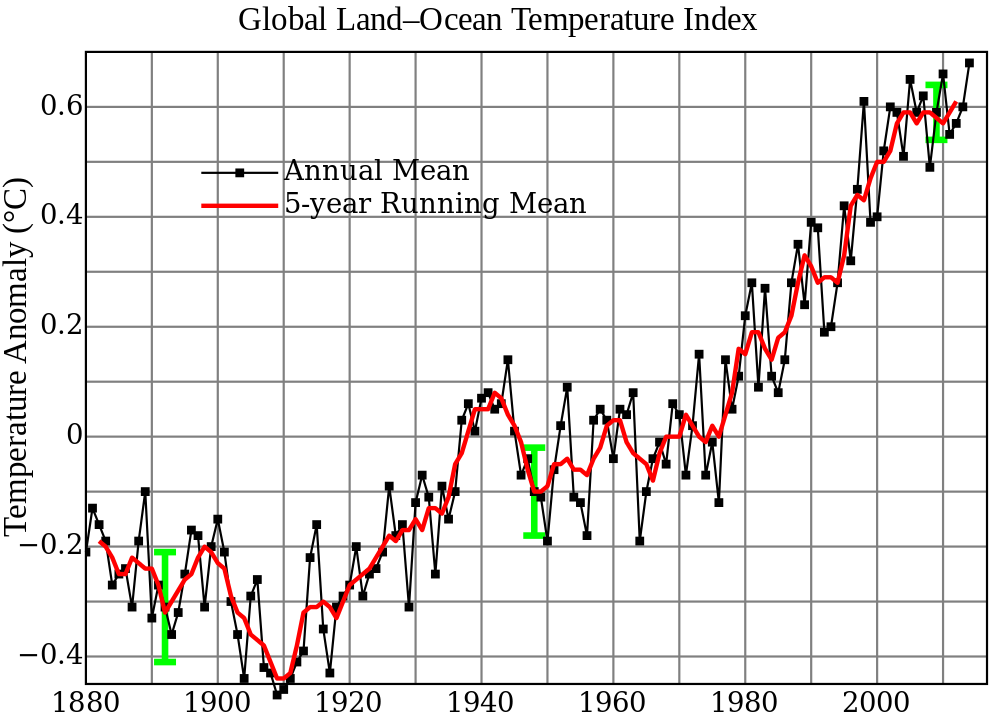
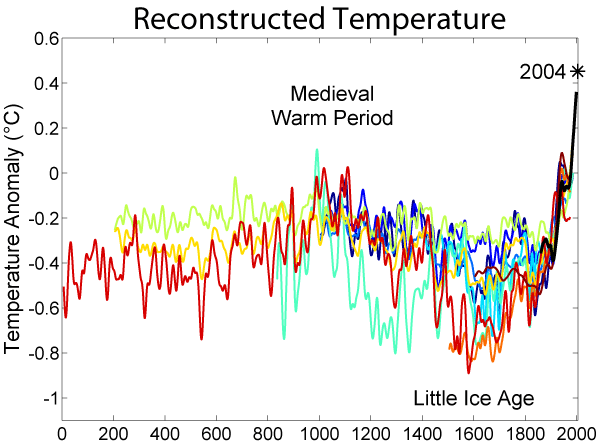
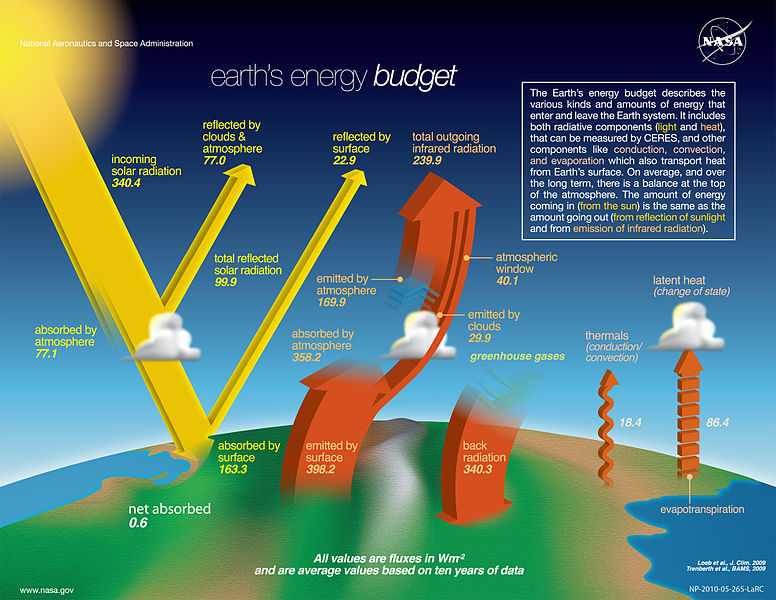
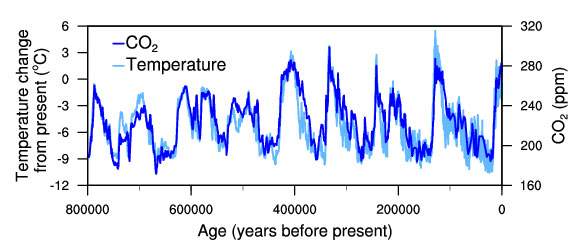
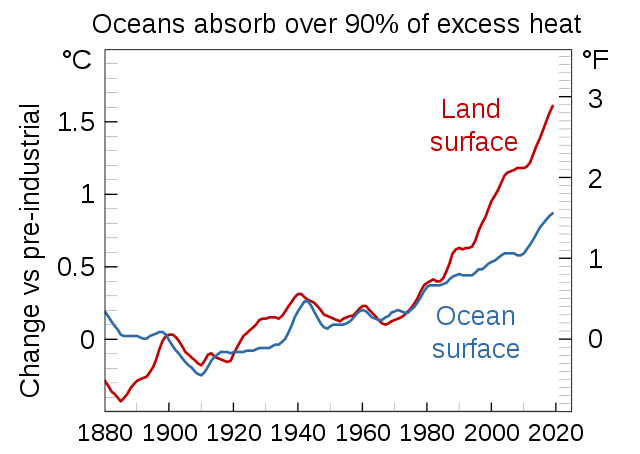
Earth mean temperature       = 288   Kelvin
Current rate of increase     =   1.7 Kelvin/century
Temperature in 1800          =   -.9 Kelvin compared to present
Temperature in 1000          =   -.5 Kelvin compared to present
 |
 |
|---|---|
 |
 |
|---|---|
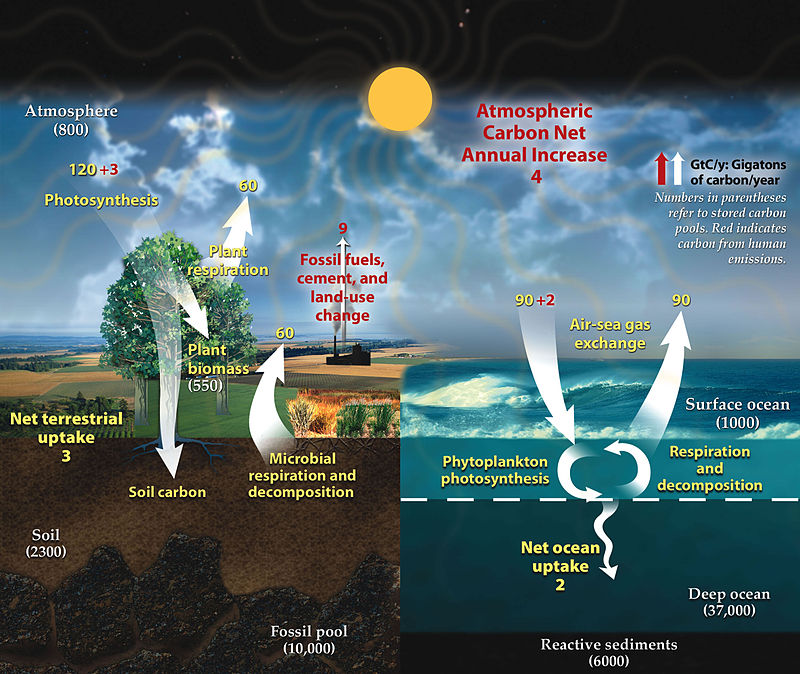
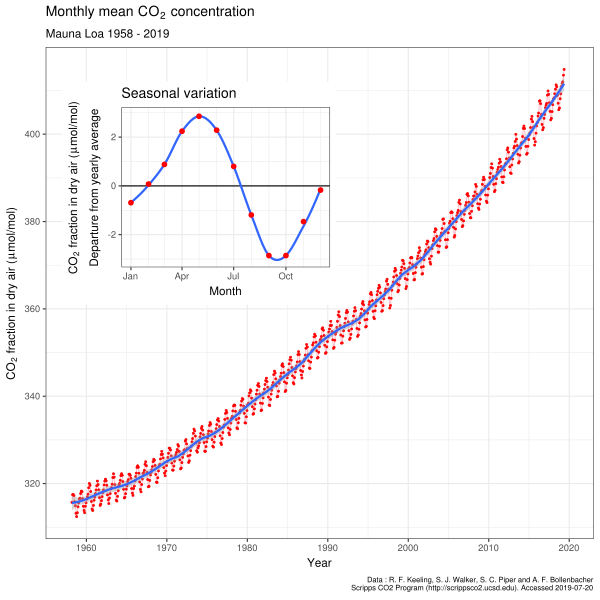
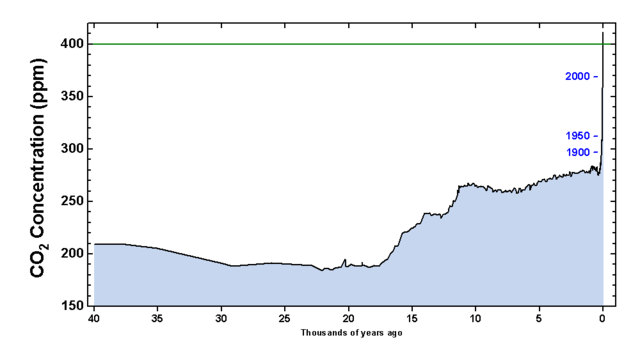
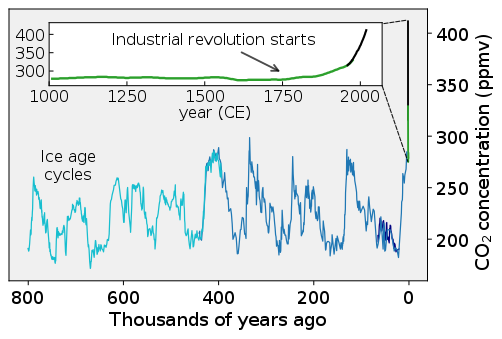
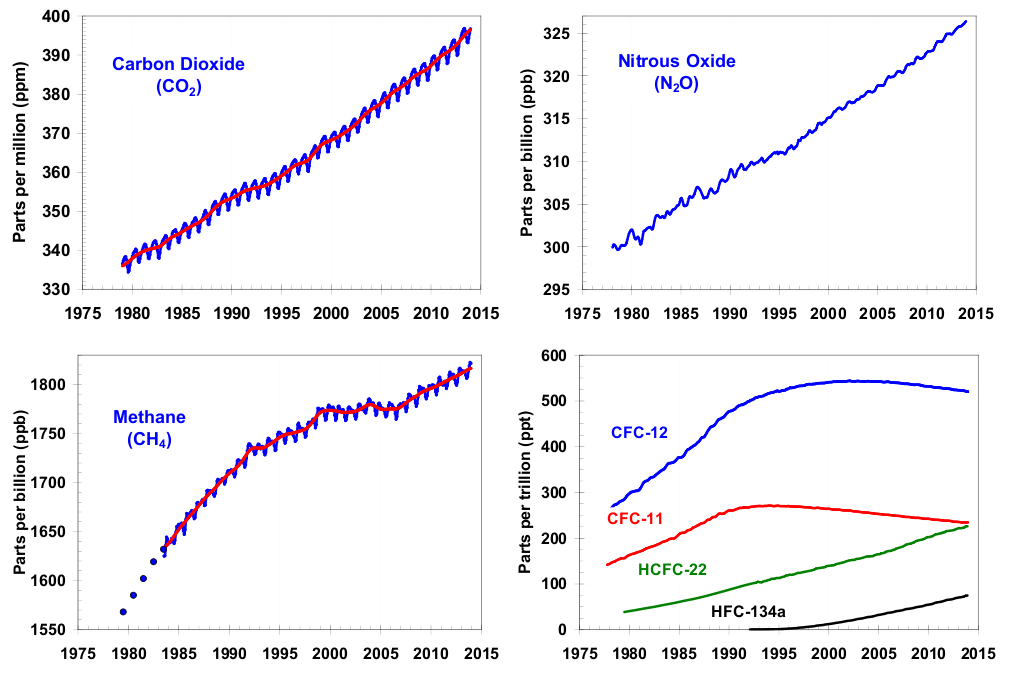
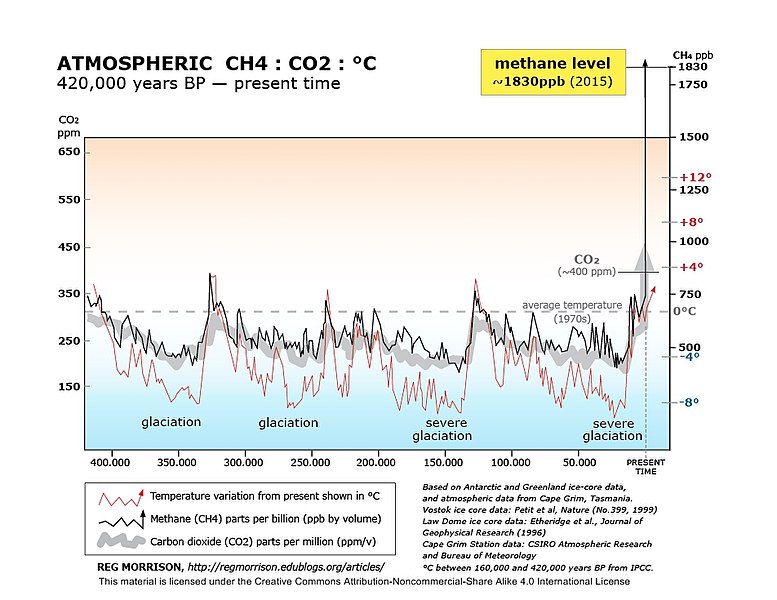
Atmosphere CO2 fraction    =  .00041
CO2 fraction in 1700       =  .00027
CO2 fraction last ice age  =  .00018             (1 million years ago)
CO2 fraction increase rate =  .000002 per year
Atmospheric carbon         =880000⋅109 kg       = 121000   tons/person
 |
 |
|---|---|
 |
 |
|---|---|
 |
|---|
|
|---|
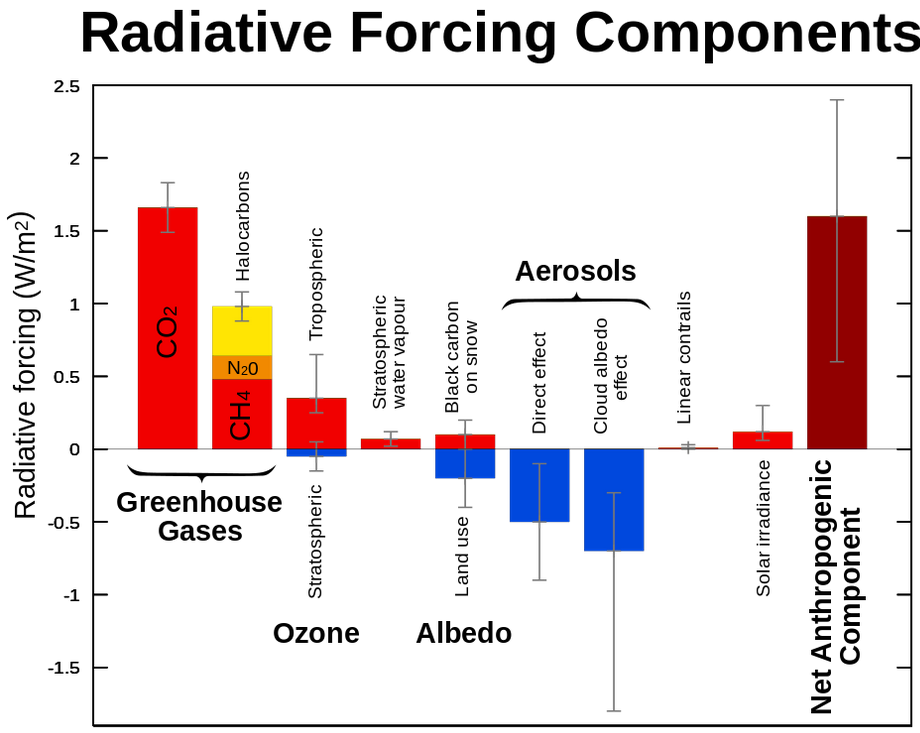
Gas        Year      Year     Contribution  Radiation  Half life
           1750      2015     to warming     change     (years)
           (ppm)     (ppm)                  (Watts/m2)
H2O                             36-72%
CO2       280       395          9-26%        1.88        60
CH4          .7       1.79       4-9%          .49        12
O3           .237      .337      3-7%          .4           .05
N2O          .270      .325                    .17       114
CCl2F2       0         .000527                 .169      100
CCl3F        0         .000235                 .061       60
CHClF2       0         .00022                  .046       12
"ppm" stands for parts per million.
 |
 |
|---|---|
 |
|---|
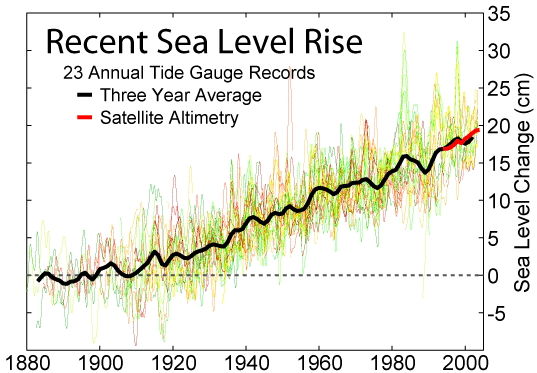
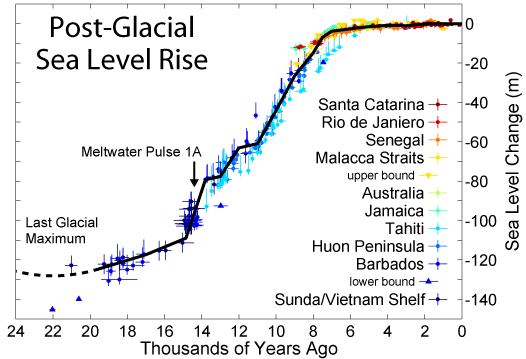
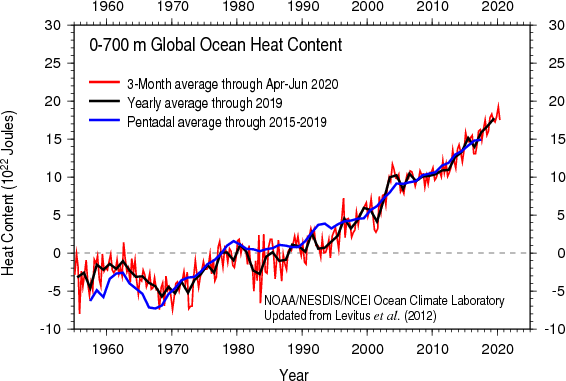
Sea level rise since 1870          =   225 mm
Sea level rise if Greenland melts  =  7200 mm
Sea level rise if Antarctica melts = 61100 mm

Total rate of sea level rise       =  2.8 mm/year     3.3
Greenland melting rate             =   .6 mm/year      .049
Antarctica melting rate            =   .2 mm/year      .026
Glacier melting rate               =   .3 mm/year     1.2
Thermal expansion rate             =   .8 mm/year     1.4

Acceleration of sea level rise     = .013 mm/year/year
Ocean heat gain                    =    5 ZJoules/year
Water:
             Volume     Change
              kkm3      km3/yr

Ocean           1338000      1200
Groundwater       23400
Ground ice          300
Lake                176.4
Mountains            40.6
Atmosphere           12.9
Swamp                11.5
River                 2.12
Biomass               1.12

Ice, Antarctica   21600      -191
Ice, Greenland     2340      -247
Ice, Canada islands  83.5     -60
Ice, Alaska          44.6     -50
Ice, Russia, NE      33.8      -2
Ice, Himalayas       23.7     -26
Ice, Svalbard        13.3      -5
Ice, Andes, South    11.7     -29
Ice, Iceland          8.7     -10
Ice, Canada, West     2.6     -14
Ice, Scandinavia       .8      -2
Ice, Swiss Alps        .3      -2
Ice, New Zealand       .3       0
Ice, Caucuses          .2      -1
Ice, Russian islands          -11
Ice, Andes, North              -4
 |
|---|
 |
.png) |
|---|---|
Atmosphere temperature rise=   .017 Kelvin/year      (.9 Kelvin since 1800)
Sea level rise             =  2.8   mm/year          (225 mm since 1800)
Atmosphere CO2 frac        =   .0035                 (.0027 in 1800)
Atmosphere carbon          =720     Gtons
Photosynthesis of carbon   =120     Gtons/year
Human carbon emissions     =  9     Gtons/year   = 1240   kg/person/year
Energy produced            =   .57  ZJoules/year =   78.6 GJ/person/year = 2490 Watts/person
Electricity produced       =   .067 ZJoules/year =    9.2 GJ/person/year =  292 Watts/person
Food                       =   .027 ZJoules/year =    3.7 GJ/person/year =  117 Watts/person  =  2500 Cal/person/day
Sunlight energy            =3850    ZJoules/year
Wind energy                =  2.25  ZJoules/year
Photosynthesis of biomass  =  3.00  ZJoules/year
Ocean heat gain            =  7.5   ZJoules/year
World power                = 18     TWatts       = 4500   Watts/person
Energy cost                = 16     T$/year      = 2210   $/person/year   (27.8 $/GJoule)
Population                 =  7.254 billion
Food                       =  1.58  Tkg/year     =  218   kg/person/year  (As carbs)
Earth land area            =148.9   Mkm2         =    2.0 Hectares/person
Rainfall over land         =107000  km3/year     =14800   tons/person/year
River flow                 = 37300  km3/year     = 5140   tons/person/year
Water total use            =  9700  km3/year     = 1390   tons/person/year
Water for agriculture      =  1526  km3/year     =  218   tons/person/year
Water for home use         =   776  km3/year     =  111   tons/person/year
Water desalinated          =    36  km3/year     =    5   tons/person/year
Rainfall increase per year =   .20  mm/year          (Rainfall is increasing with time)
The above table can be used to convert various quantities, such as:
Energy of hydrocarbon food                      17  MJoules/kg
Agricultural water required to produce food   1000  litres/kg       (in the form of carbohydrates)
Electricity cost                               100  $/MWh           =  2.78⋅10-8 $/Joule
Agricultural water required to produce food   1000  litres/kg       (in the form of carbohydrates)
World average                               722000  people per kg3 of water used
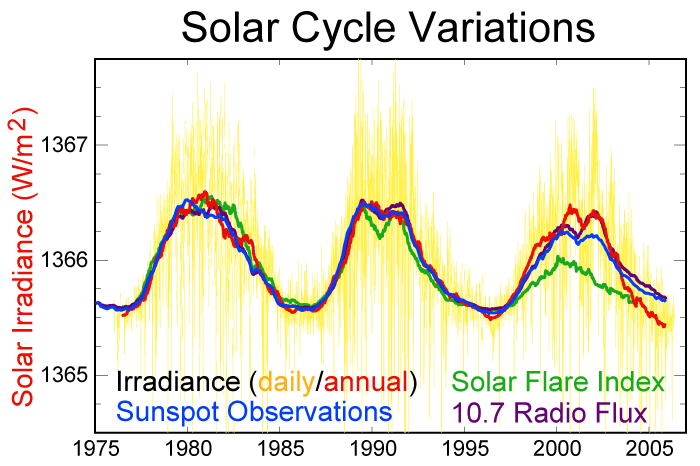
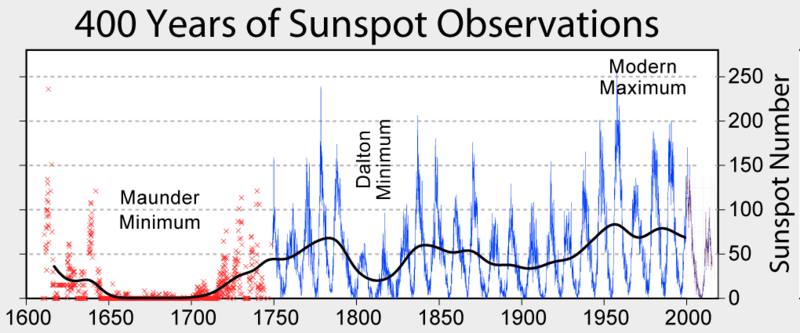
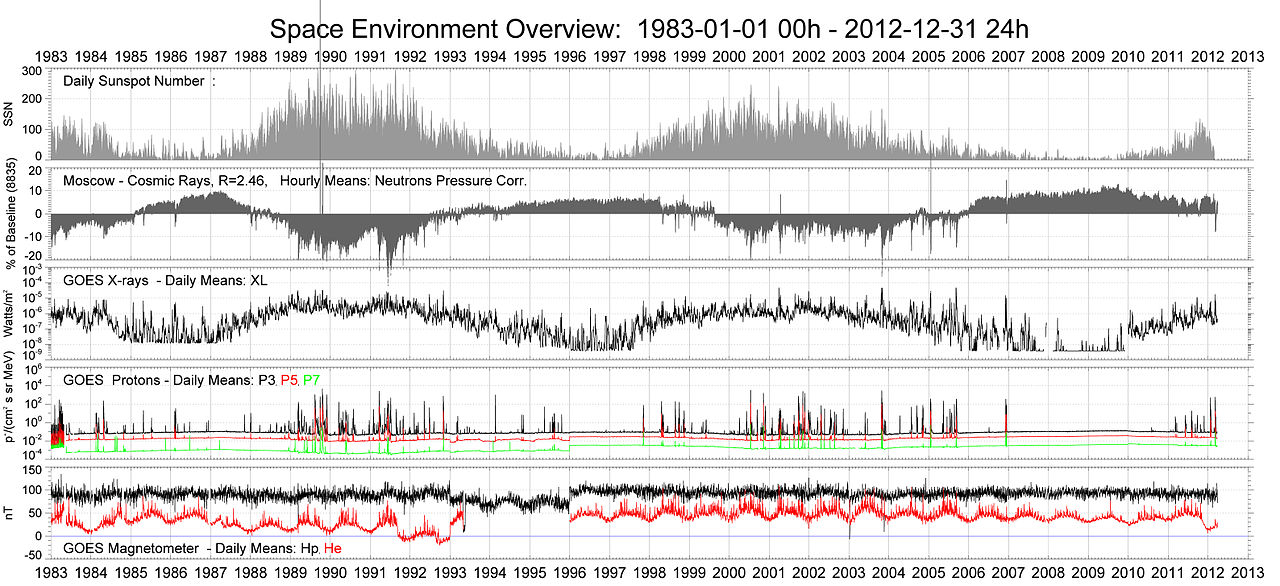
Sunspot number correlates with solar intensity.
 |
 |
|---|---|
Solar intensity has long-term variations and these impact climate. The sun is presently dimming.
 |
|---|
 |
|---|
 |
 |
|---|---|
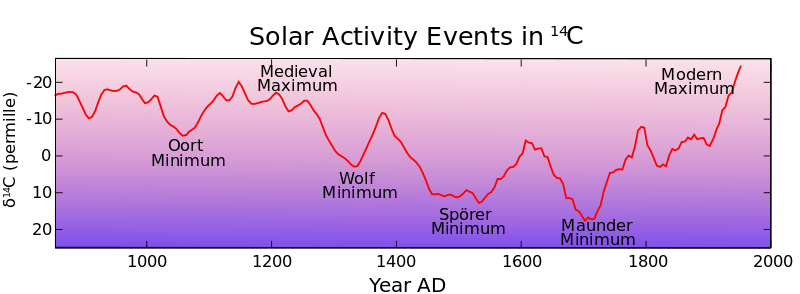
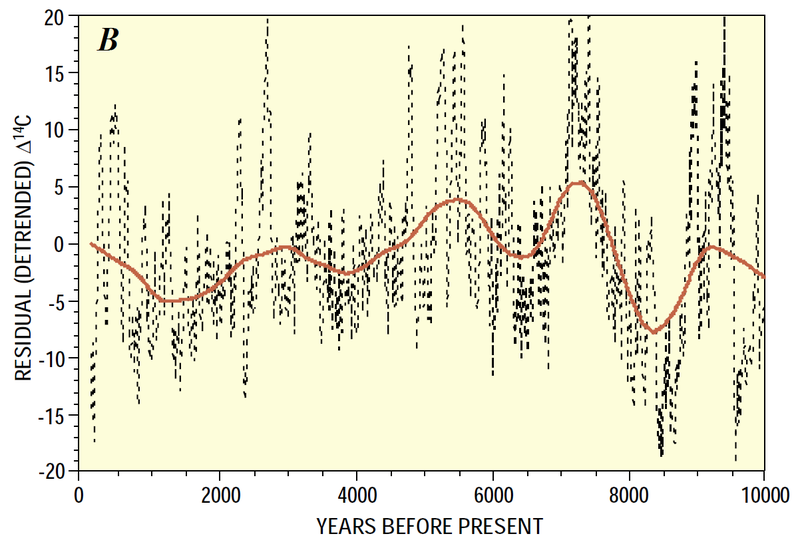
Carbon-14 is a proxy for solar intensity.
Sunspots impact cosmic rays, and cosmic rays have an impact on climate by forming clouds.
Sun intensity average             =  1366.0 Watts/meter2
Sun intensity at sunspot maximum  =  1367.0 Watts/meter2
Sun intensity at sunspot minimum  =  1365.1 Watts/meter2
 |
|---|
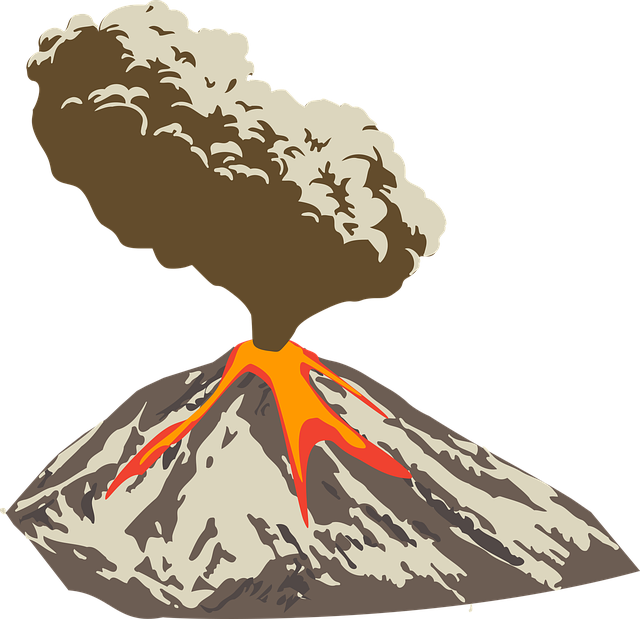
Volcanoes often cause global cooling, and the table shows all major volcanic cooling events.
Region        Volcano     Magma    Index   Year  Temperature change
                          (km3)                       Celcius

Philippines   Pinatubo        25     6     1991     -.2
Alaska        Novarupta       28     6     1912     +.2
Guatemala     Santa Maria     20     6     1902     -.1
Indonesia     Krakatoa        20     6     1883     -.4
Indonesia     Tambora        160     7     1815     -.5   Caused the "Year without a summer"
Iceland       Laki            14     6     1783     -1
Peru          Huenaputina     30     6     1600      ?
Vanuatu                      108     7     1452      ?
New Zealand   Tarawera               5     1315      ?    Famine of 1315-1317
Indonesia     Rinjani         10     7     1258      ?    Caused the Little Ice Age that ended the Viking era
Iceland       Hekla 3          1     5     1159      ?
North Korea   Paektu         110     7      946      ?
Unknown                              7      535     -2
Indonesia     Lake Toba     2800     8   -72000     -1
 |
|---|
For heat energy,
         Energy/Carbon  Energy/mass
           MJoule/kg    MJoules/kg

Natural gas   73           55
Oil           53           46
Coal          38           32
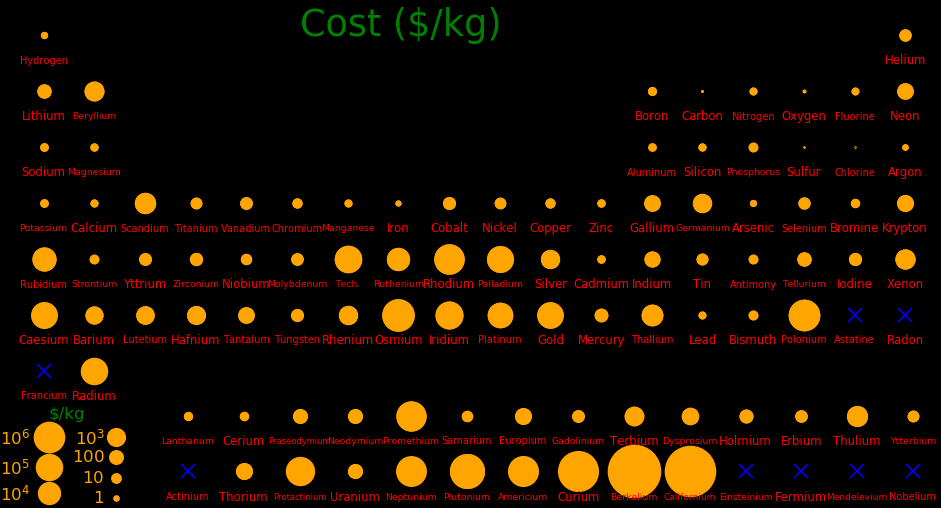
The chief fertilizer elements are nitrogen, phosphorus, and potassium, and they draw substantial mining energy.
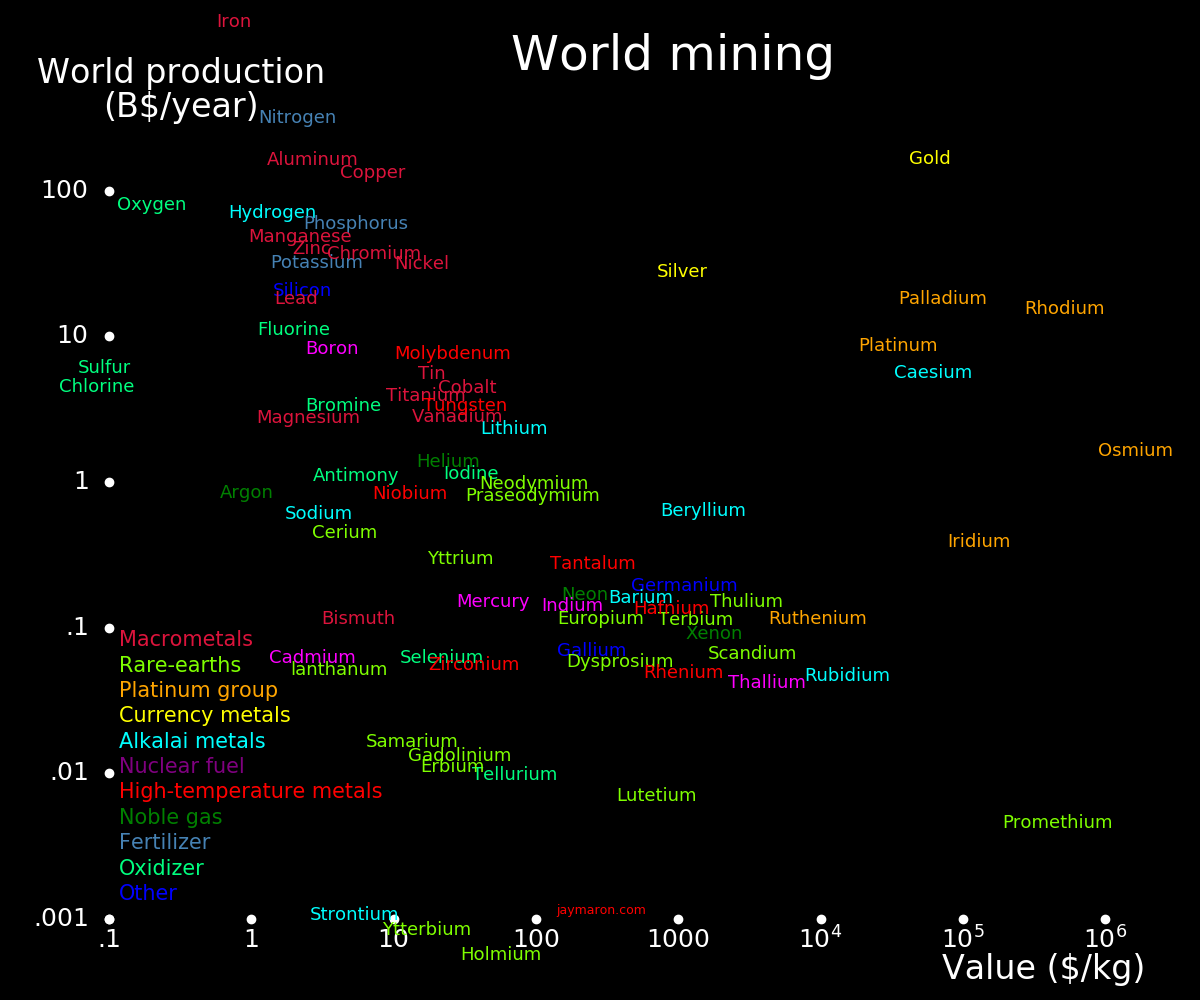
World metal mining is dominated by iron, aluminum, copper, and gold.
 |
|---|
World production and reserves for fertilizer elements are:
          World    Fertilizer  Reserves  Carbon  Carbon   Element  Usual form
         Bkg/year   Bkg/year     Bkg     kg/kg   Bkg/year  $/kg

Nitrogen     38      30.0    Infinite     1.09    32.7     5.66    Urea                     CO(NH2)2
Phosphorus   22      11.0         260     1.30    14.3    56       Monoammonium phosphate   NH4H2PO4
Potassium    34      11.0        3240     2.64    29.0    11.8     Potassium chloride       KCl
"Carbon kg/kg" is the carbon emitted to produce 1 kg of element.
"Carbon Bkg/year" is the carbon emitted by the world due to the fertilizer element.
"Element $/kg" is the price of the element per kg.
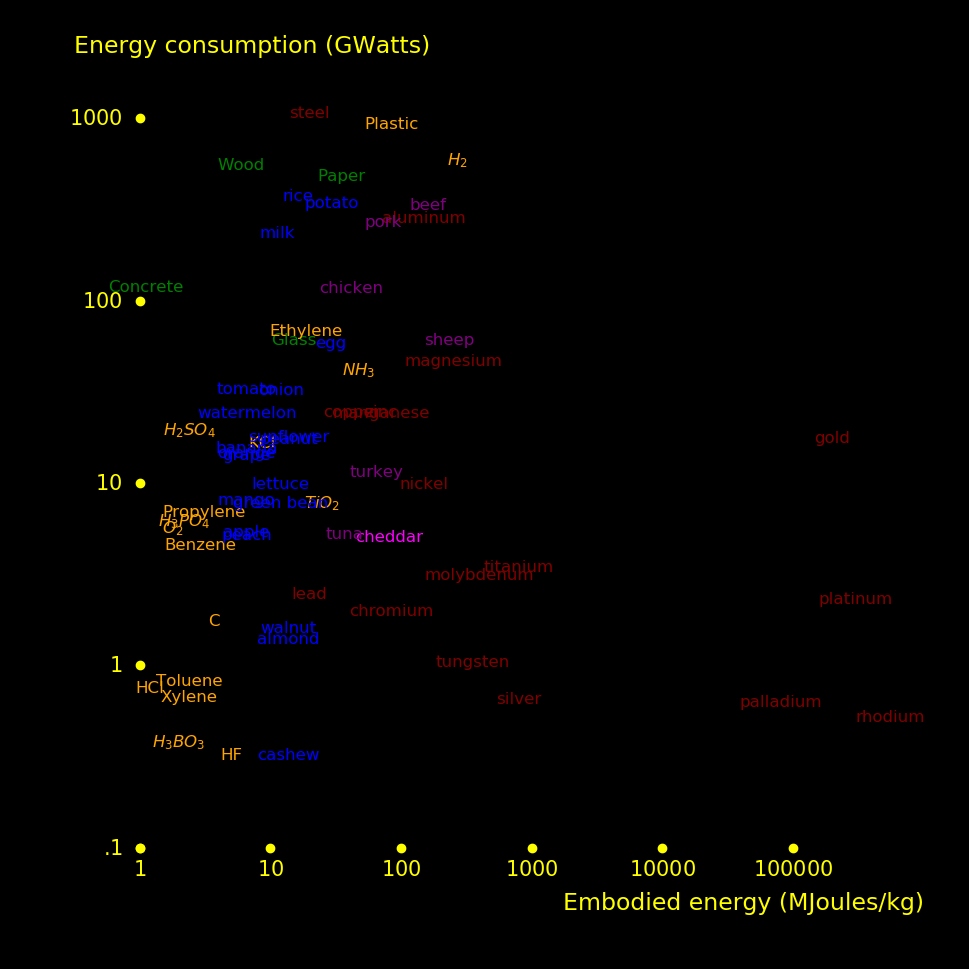
The plot shows how much energy the world expends per year for primary materials. The materials that consume the most energy are are steel, plastic, hydrogen, wood, and food.
Hydrogen is a primary chemical, and it's produced from methane by steam reforming. 45% of hydrogen becomes ammonia (Haber process) and 80% of ammonia becomes fertilizer.
Methane CH4 → Hydrogen H2 → Ammonia NH3 → Urea CO(NH2)2
 |
|---|
Adding 1 kg carbon to the atmosphere increases greenhouse heating by 4.1 Watts.
There are 2 classes of geoengineering: Carbon management (usually trees) and greenhouse warming management (usually cloud seeding and aerosols). The above number allows you to compare costs.
A tree captures carbon at a rate of .5 kg/meter2/year, which decreases greenhouse heating by 2.0 Watts/meter2.
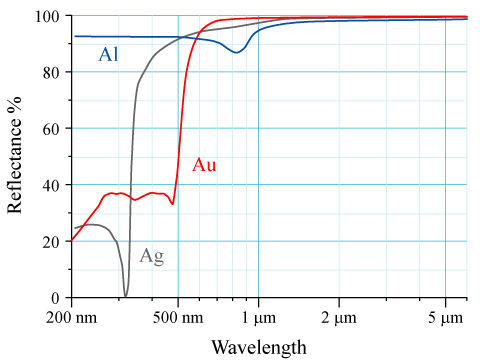
"Albedo" is reflectivity.
The difference in reflected flux between trees and grass is measured to be 8
Watts/meter2 at 40° latitude, where solar flux is 190
Watts/meter2, and this corresponds to an albedo difference of .04.
Williams, Gu, &
Jiao (2021).
If you replace an arctic conifer tree with snow, the albedo change is
".52". The average solar power at 60° latitude is 110
Watts/meter2, so the change in power is 57
Watts/meter2. This the most extreme case. The realistic change is
less, because there isn't always snow on the ground, and because trees are
sometimes covered in snow.
The density of a typical forest is:
The growth rate of a typical forest is:
Wood is 1/2 carbon and 1% nitrogen.
The fertilizer requirement for nitrogen is:
Trees also need potassium, phosphorus, calcium, magnesium, and sulfur, and
their total cost is similar to that of the nitrogen. The total fertilizer cost
is double the nitrogen cost.
Bamboo is a fast-growing tree and it's easily harvested, because it's light on side branches.
A new bamboo forest achieves full leaf coverage early, whereas an oak forest takes longer.
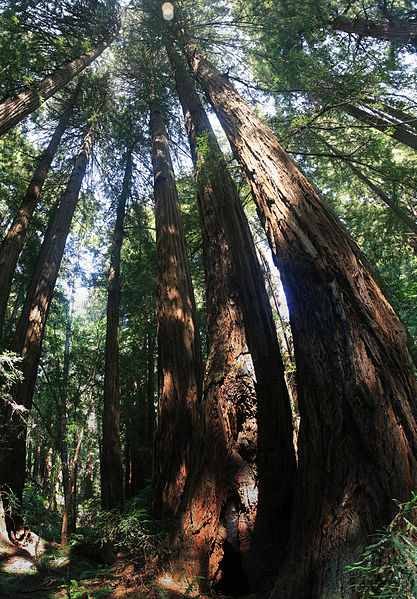
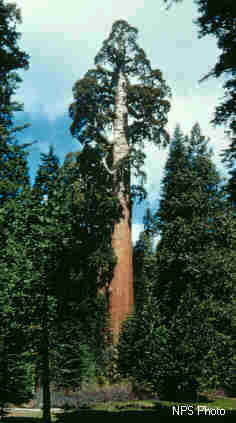
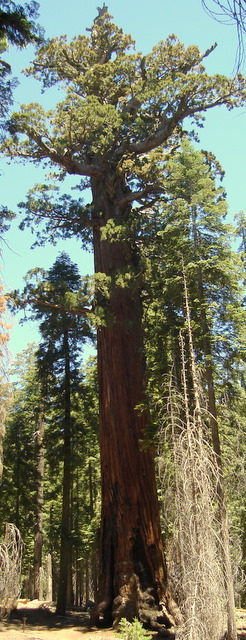
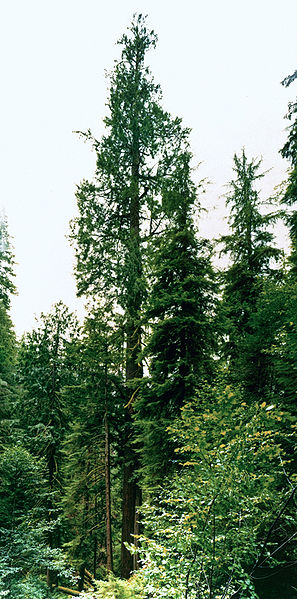
The largest trees are sequoias, redwoods, douglas firs, and eucalyptus. Douglas firs
can grow in the arctic.
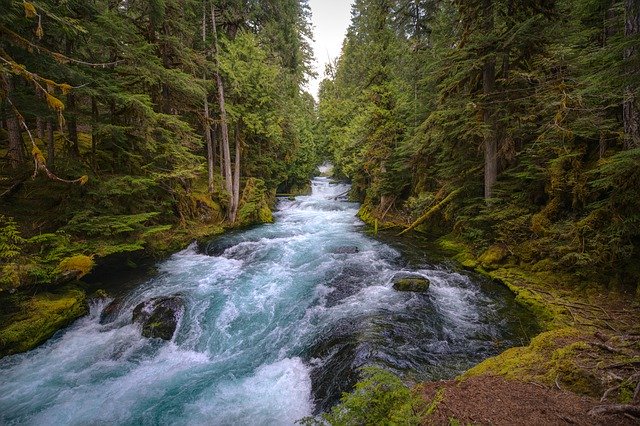
Trees should be planted close to water. For existing trees, fertilizer should
go to large trees that are close to water.
If possible, plant trees so that their shadows are cast over water, because
trees have a larger albedo than water.
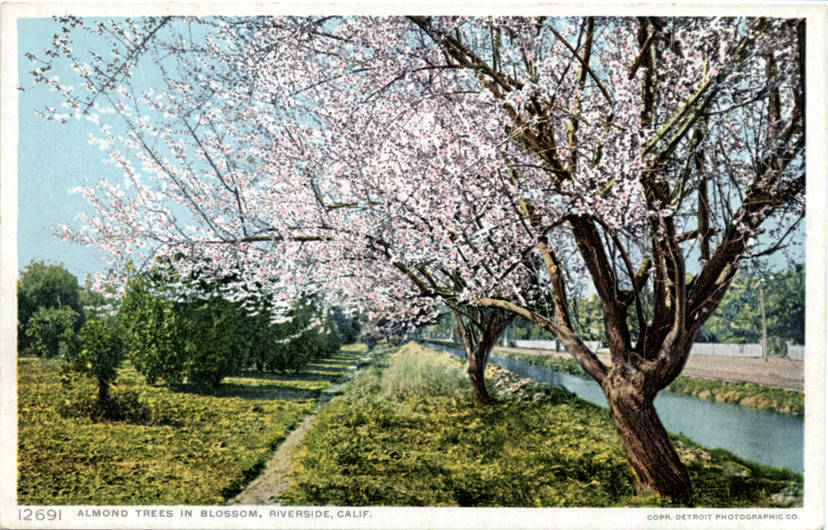
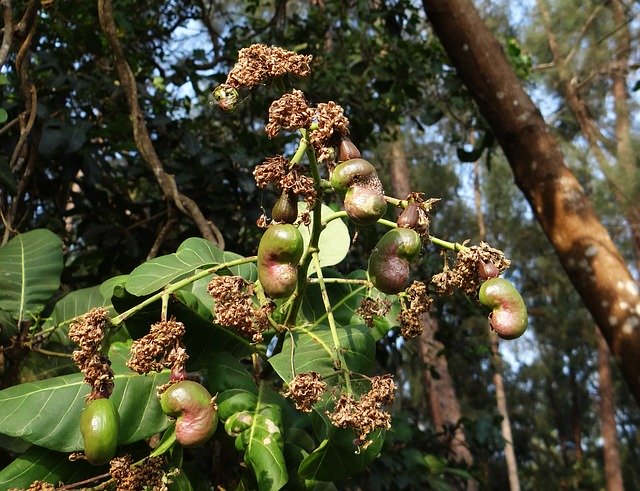
Plant trees that produce nuts, because birds are more likely to get the nuts
than insects. Also, the more birds, the fewer insects.
An old forest is carbon-neutral and a young forest captures carbon. Replace old forests
with young forests, or harness the deadwood in old forest.
World forest carbon:
Using trees to offset atmospheric carbon gain requires 4 Mkm2 of
forest, and world forests total 39 Mkm2. Forests capture carbon at a
rate of .5 kg/meter2/year.
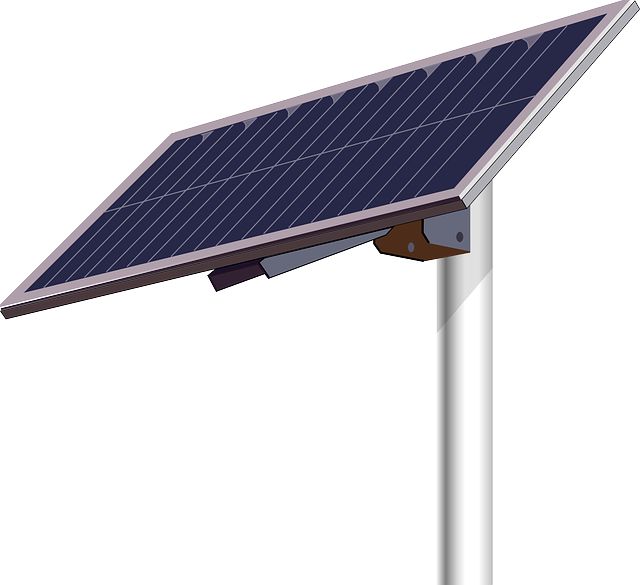
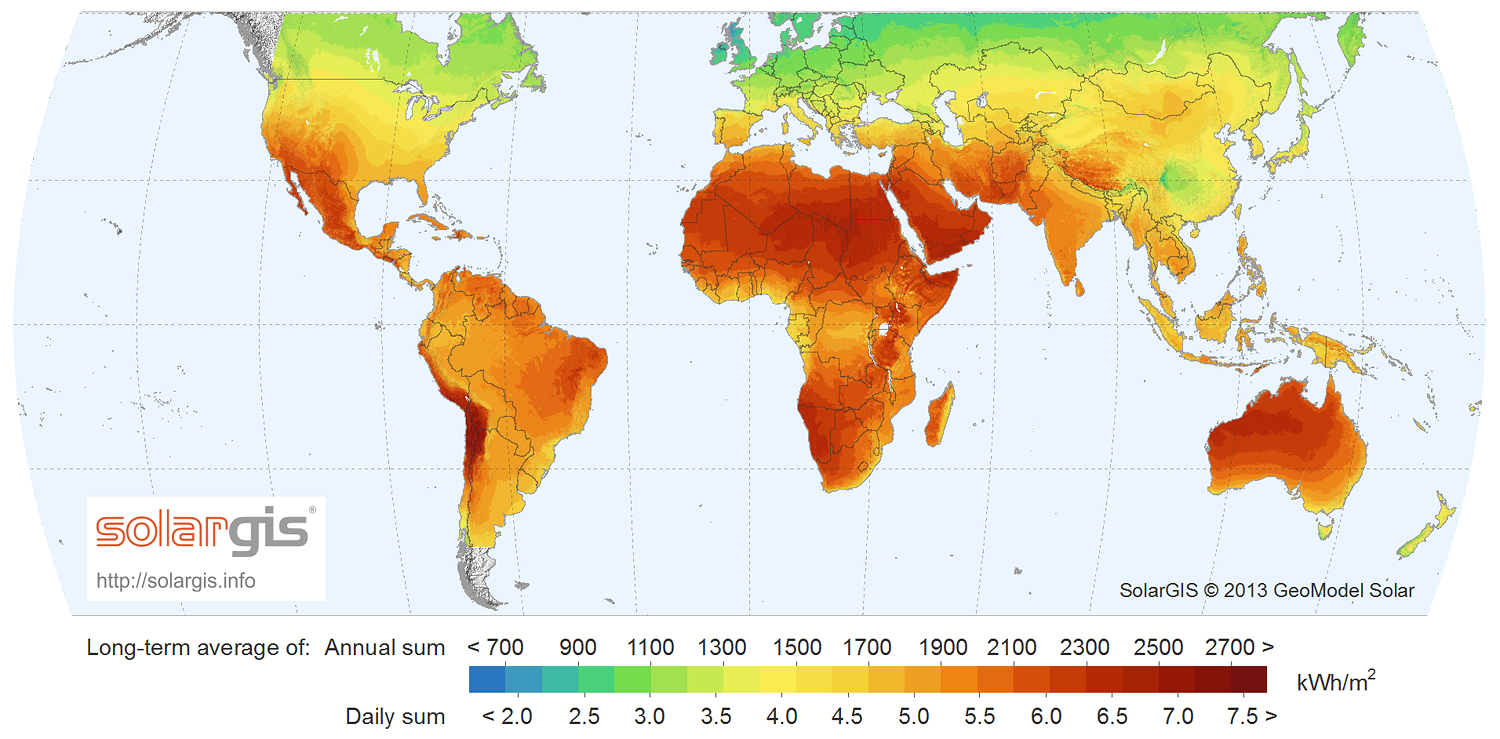
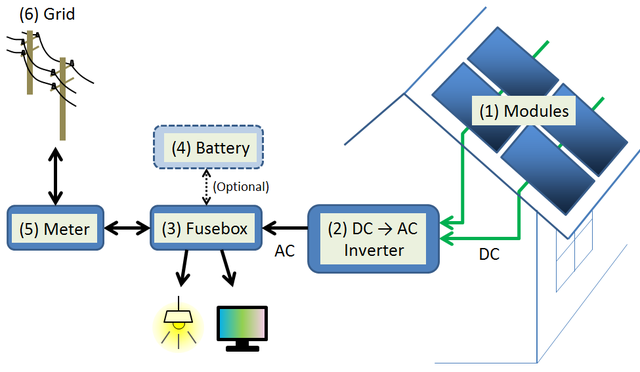
A typical solar farm costs 5 $/Watt and produces 30 MWatts/km2.
The largest solar farms are:
American solar farms tend to be in California or Arizona where sunlight is abundant and
clouds are scarse. We calculate the payback time for a typical 1 meter2 solar cell in Arizona.
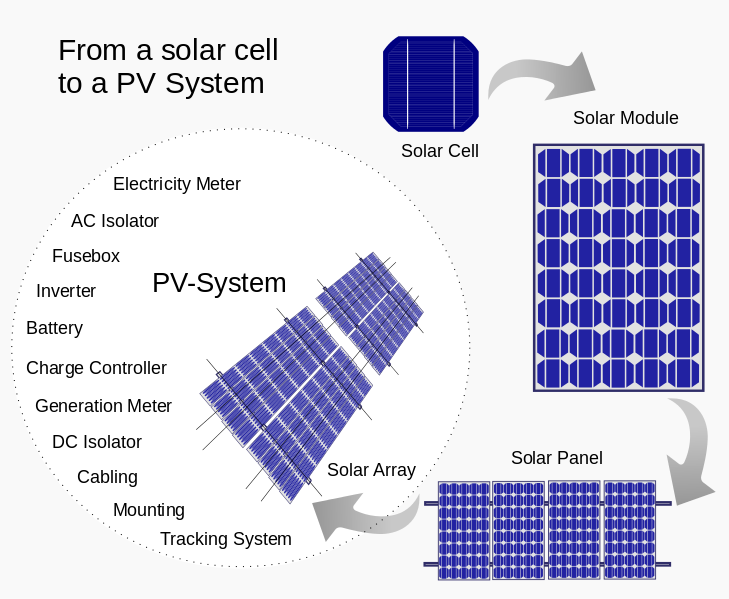
The types of solar cells are:
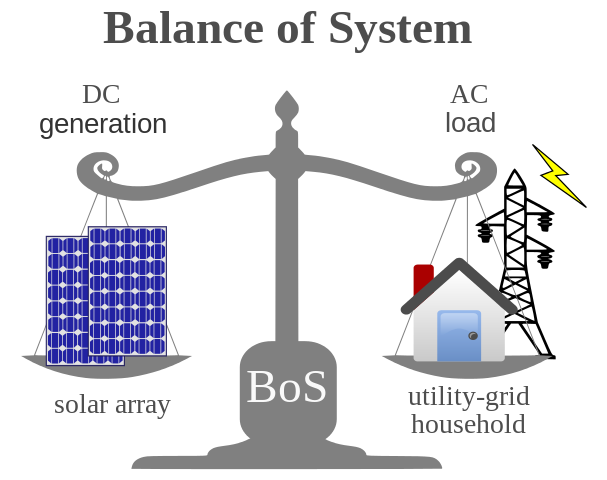
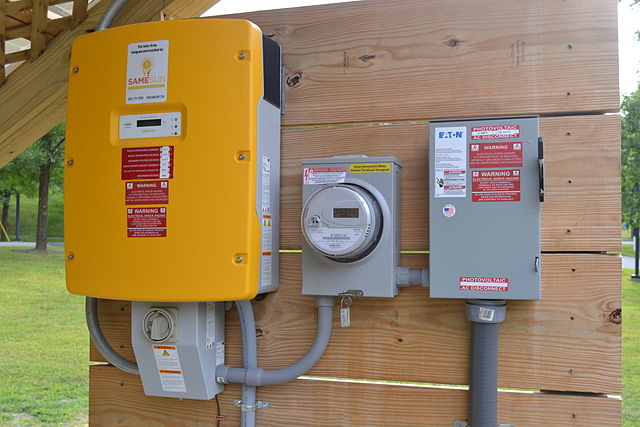
A solar cell system requires an inverter to convert DC to AC power.
For a 1 meter2 cell,
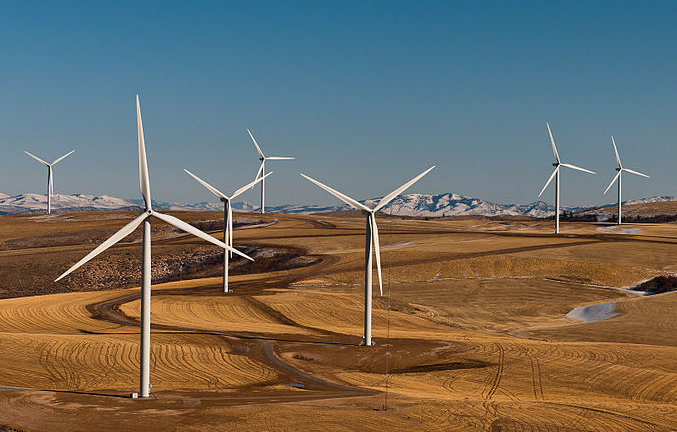
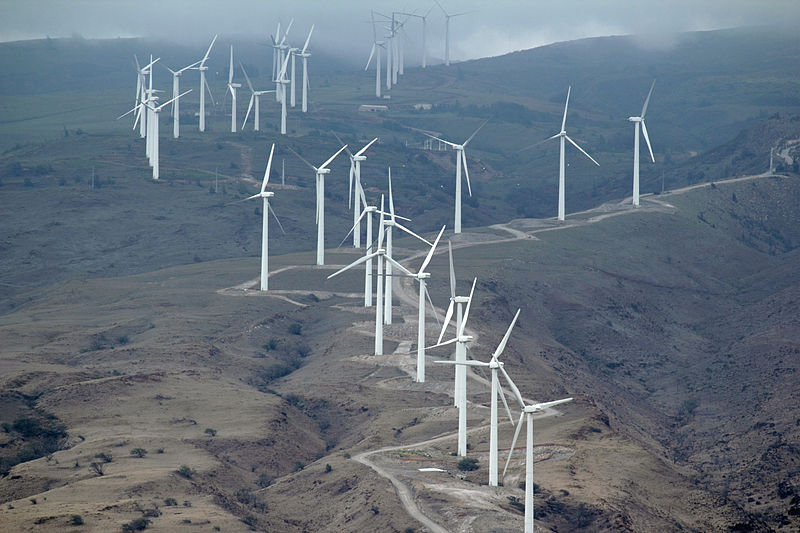
A typical wind farm costs 1.5 $/Watt and produces 10 MWatts/km2. The largest
wind farms are:
The larger the turbine, the more efficient it is. Commercial wind turbines include:
The power generated depends on wind speed cubed. For the Vesta V164,
For a typical wind turbine,
Fission reactors are used primarily for electricity and heat, and they can also
generate valuable elements. Neutron transmutation can turn cheap tungsten into valuable
rhenium, osmium, iridium, platinum, and gold. Radioactive waste is abundant in the
valuable catalysts rhodium and palladium.
Fission reactors can generate transuranic elements, which are necessary for nuclear
rockets and space engineering.
Neutron transmutation moves an element one spot to the right in the periodic table.
Burnt fission fuel contains the valuable catalyists rhodium and palladium. One
kg of uranium costs $100 and produces $13000 of rhodium and $1600 of
palladium. The elements produced by the fission of one kg of U-238 are:
Technetium is important because there are no stable isotopes and it doesn't
occur in nature. Strontium-90 is important because it can be used as a
radioisotope battery. Technetium-99 and Strontium-90 don't have
well-established market prices because they only come from fission
reactors. Xenon is easy to extract because it's a noble gas.
The numbers are for fission by fast neutrons. Fission by slow neutrons produces similar numbers.
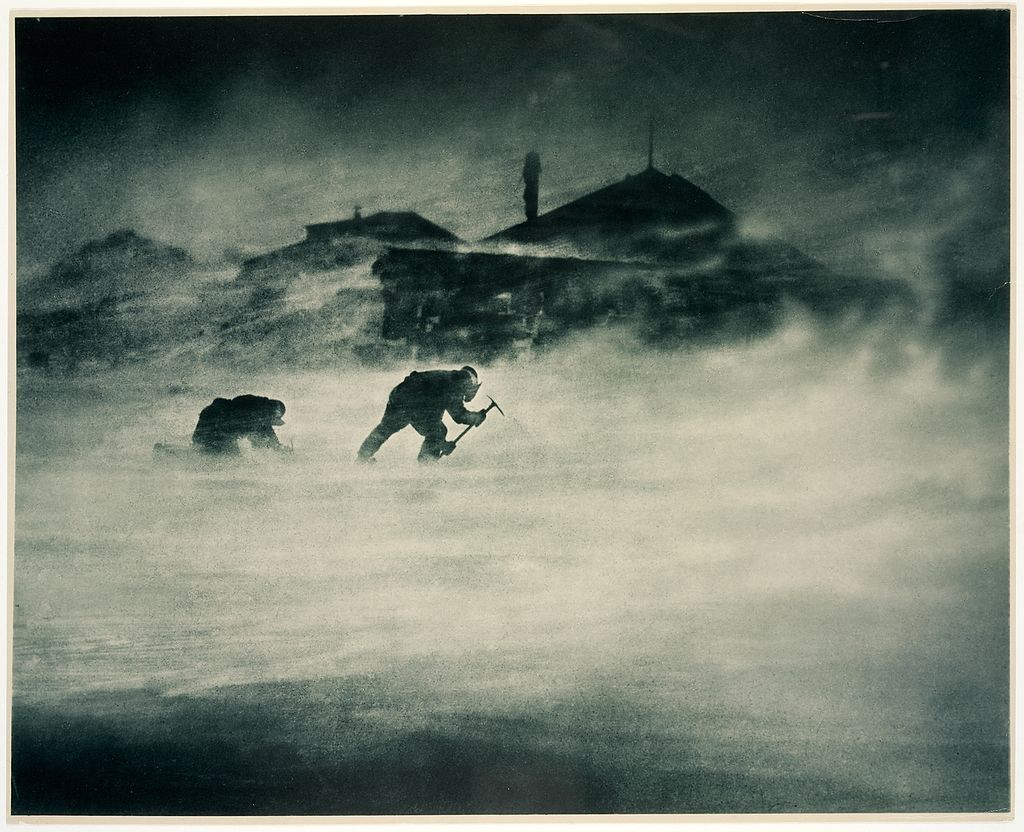
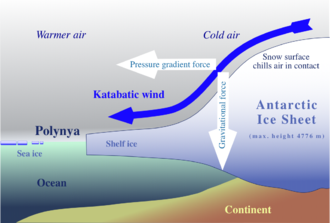
The windiest place on the planet is Cape Denison, Antarctica, with a year-round
average wind speed of 25 m/s. Wind turbine power scales as windspeed cubed.
Katabatic winds continuously blow from the
Antarctic center to the coast, gaining energy as they flow downward. The wind
at Cape Denison always blows in the same direction, simplifying
construction.
A 10 km array of wind turbines at Cape Denison can generate 5 GWatts.
The power can be used to produce metals. Ore is brought to Antarctica and
extracted with electricity. Suitable candidates include titanium,
magnesium, and aluminum.
Wood consists of a mix of cellulose and lignin, with a typical mass composition of
One can control the amount of carbon sequestered by varying the pyrolysis temperature.
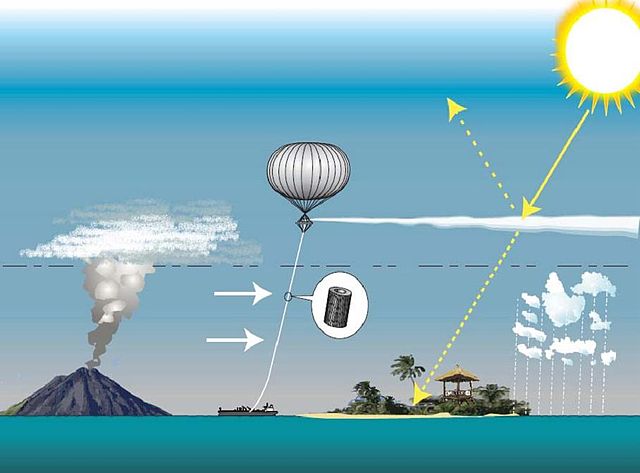
Clouds can be formed with sulfuric acid cloud seeding. Sulfur can be put into
the atmosphere in the form of H2SO4, H2S, or SO2. Sulfur
lasts 4 years in the atmosphere and has to be replenished. Power from the jet
stream can be used to launch sulfur.
Fertilizing the ocean with iron causes large-scale biomass growth, and when it dies it takes the carbon to
the bottom of the ocean.
In the ocean the microbe nutrient requirement is:
Iron is insoluble in the ocean and is usually the limiting nutrient. Between
nitrogen and phosphorus, nitrogen is usually the limiting nutrient.
A small amount of iron fertilizer can capture a large amount of carbon.
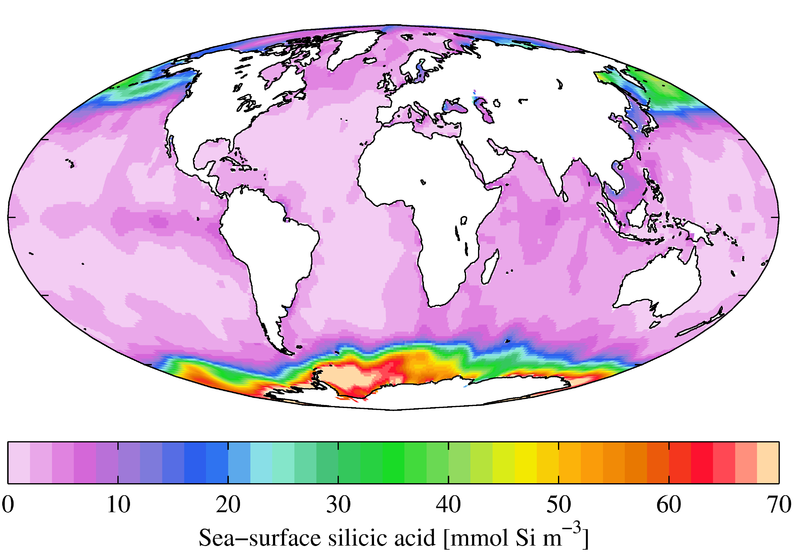
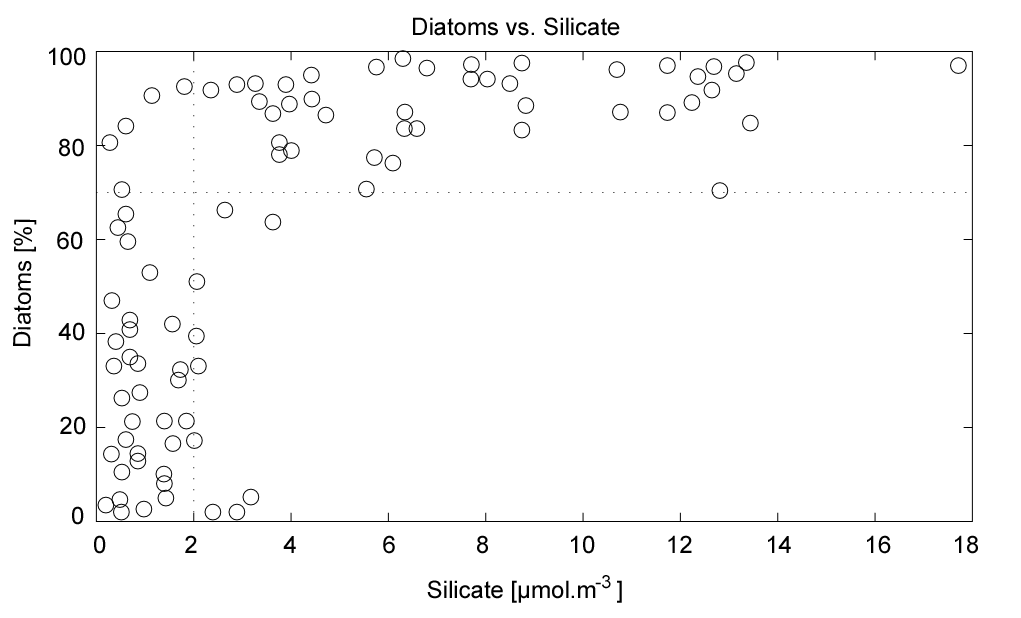
Diatoms are microbes with silicon walls as opposed to conventional lipid membranes.
If silicon is present then silicon microbes outcompete lipid microbes because
silicon walls cost 8% as much energy to make as lipid membranes.
Diatoms are good carbon fixers because when they die they sink to the bottom of the ocean,
and the carbon stays there.
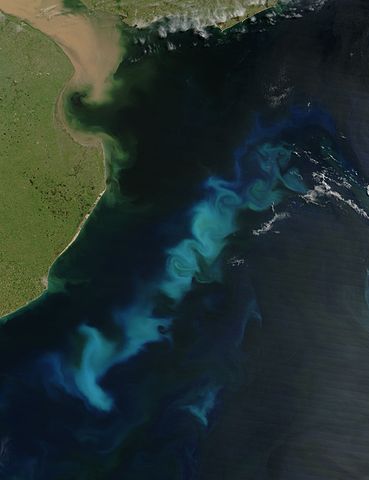
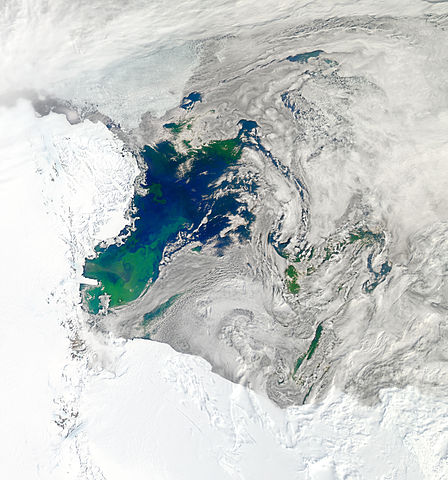
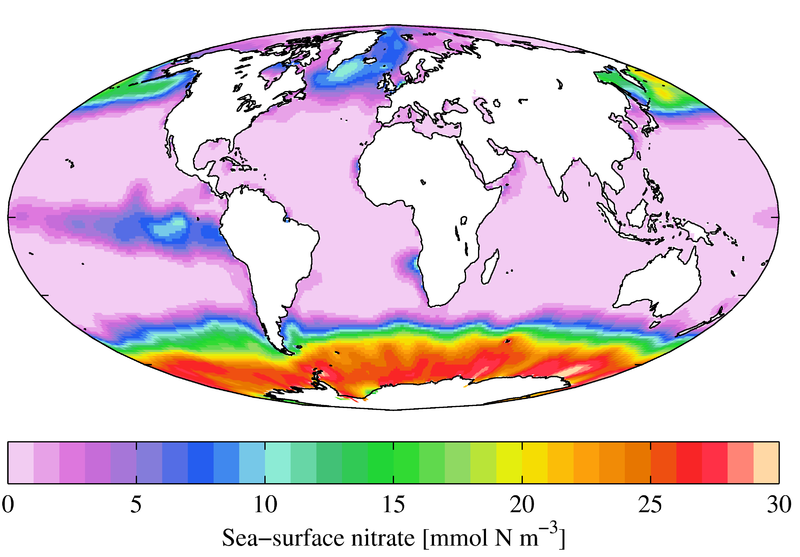
The best place to fertilize the ocean with iron is the Antarctic Atlantic, where iron is
scarce and silicon, nitrogen, and phosphorus are abundant. This is also the region where the
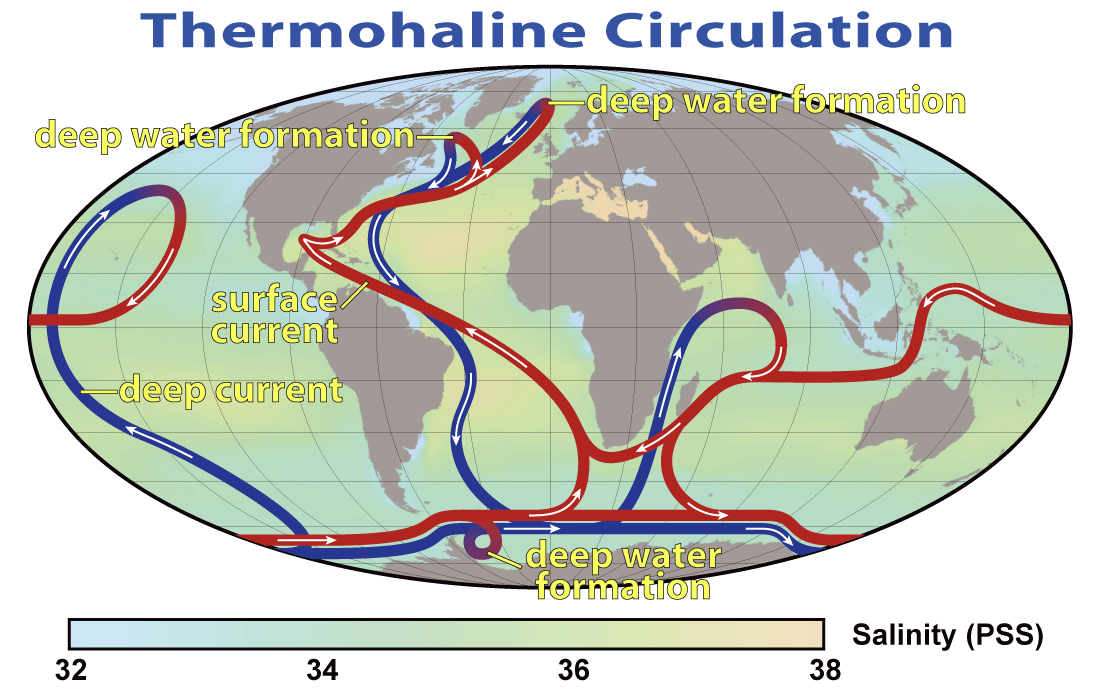
ocean currents flow downward.
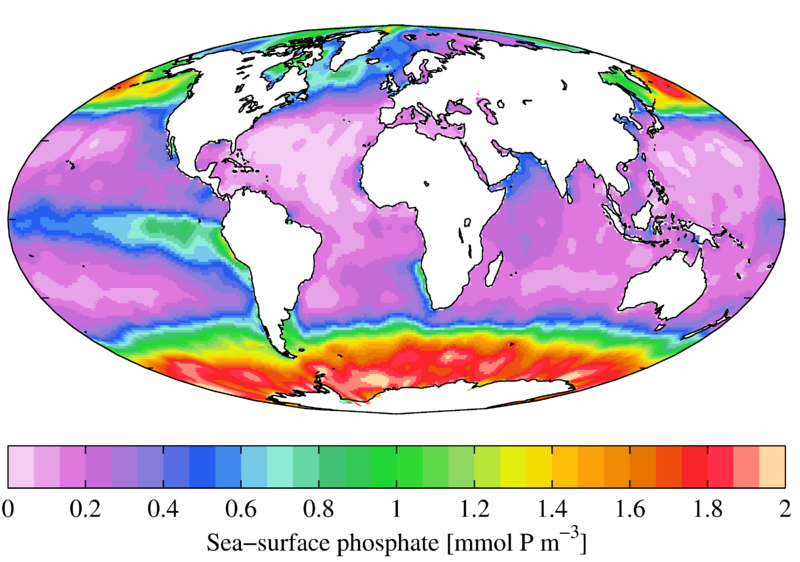
Ocean concentrations of phosphorus, nitrogen, and silicon:
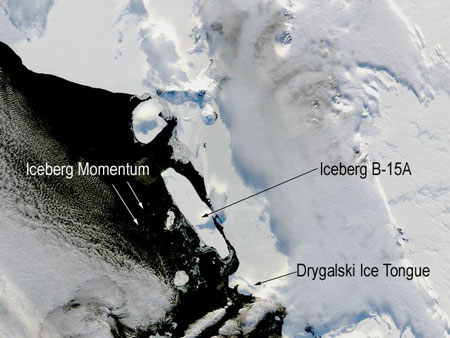
Antarctic icebergs can be moved to places in the tropics where sun is abundant but water is scarce.
The energy required to move the iceberg costs far less than the value of the freshwater delivered.
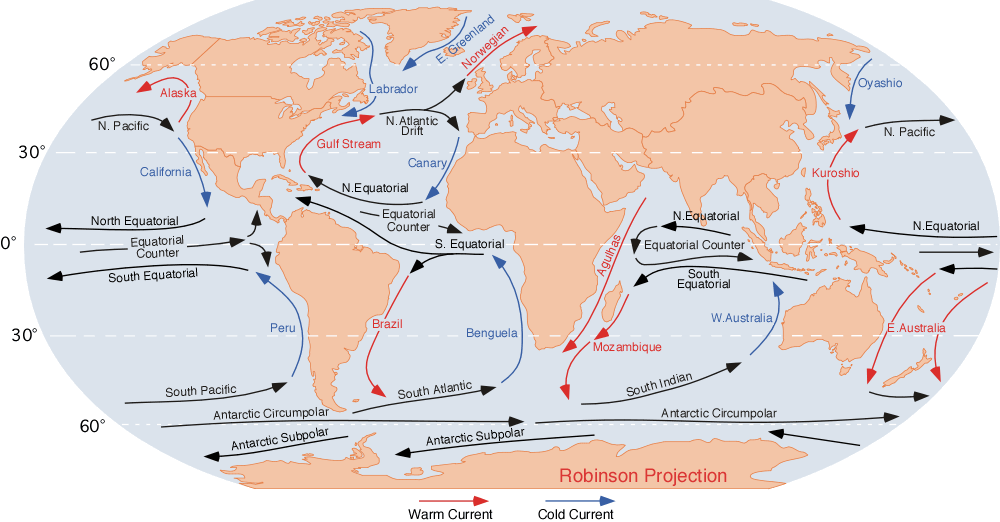
Ocean currents can help save energy. The South Indian Current brings icebergs to Australia,
The South Pacific current brings icebergs to Chile, and the South Atlantic current brings icebergs
to Africa.
We calculate the energy required to move an iceberg for a typical iceberg.
The iceberg should move as slow as possible but it should move fast enough to
reach its destination before melting. We assume a travel time of 1 year, and
this determines the velocity. Presumably, measures can be taken to slow
melting such as covering the iceberg with a white tarp.
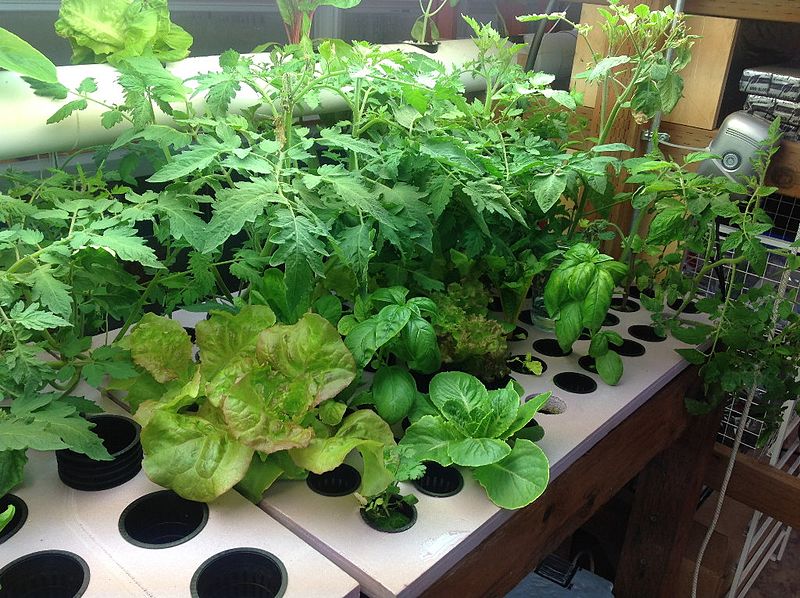
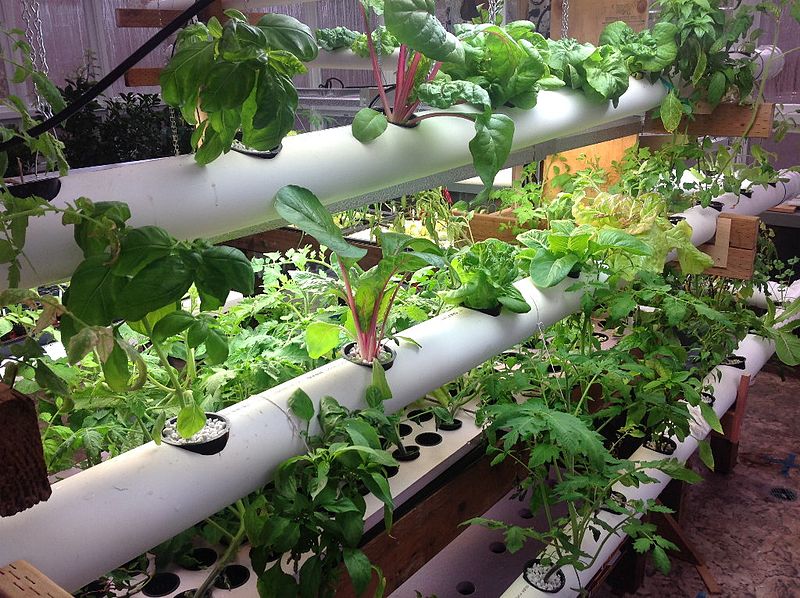
Hydroponics is the technique of growing plants in water rather than soil, where the water is
fertilized with nutrients. Hydroponics can yield 100 times as much food as soil-based
agriculture, and a person can be sustained with only 200 square meters of hydroponics.
Hydroponics is easy. One can buy a system that takes care of everything and one
need only supply the system with water and fertilizer. One can further improve
yield with greenhouses, lighting, and mirrors.
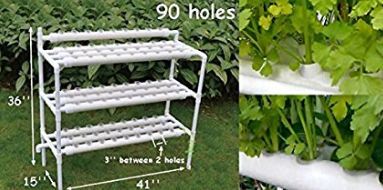
A "grow kit" takes care of supplying the plants with water. One need
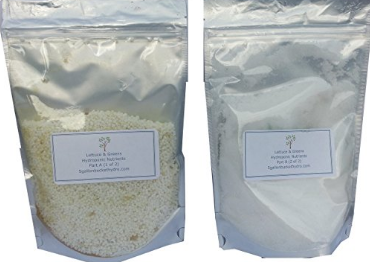
only supply the kit with water and fertilizer. Fertilizer comes in powder form
and dissolves in the water. Kits cost $2 per plant site.
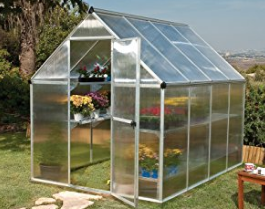
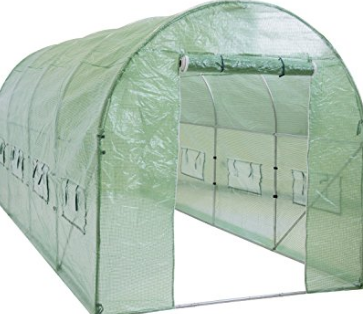
Putting a greenhouse around the kit amplifies the yield by allowing one to
control temperature and humidity. A greenhouse also allows plants to be grown
during the winter.
Mirrors can amplify the sunlight reaching the planet, and mirror film is cheap.
Lights can improve the growth rate and make it possible to grow plants 24 hours.
1 kg of nutrient powder is mixed with ton of water.
The composition of a typical nutrient solution is
Hydroponics offers gains over field agriculture in many categories. The following table shows the
amplification for each category in terms of hydroponic yield over field yield. The total
amplification is the product of the amplification from each category.
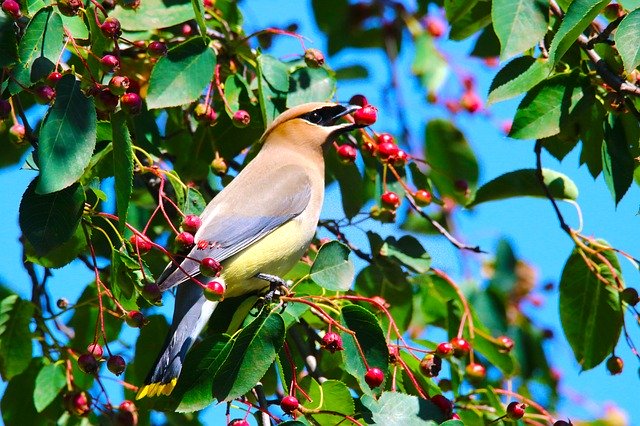
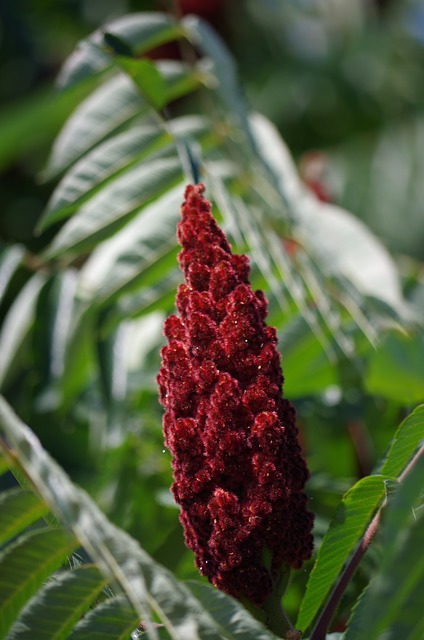
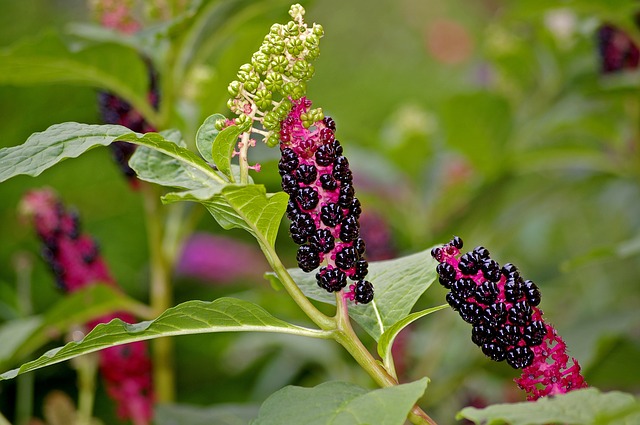
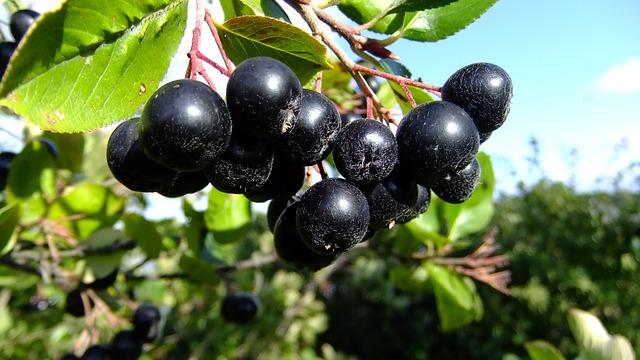
Bird populations can be increased with plants that produce nuts or berries.
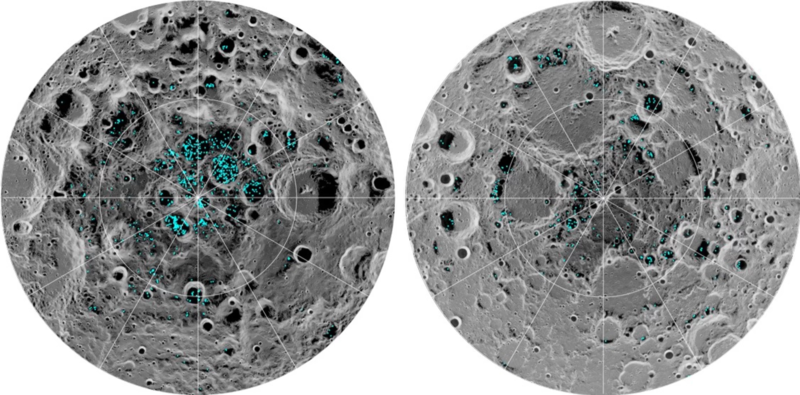
Climate engineering can be done from space, but it requires lunar ice.
Lunar ice can be used for rocket fuel, life support, and radiation shielding.
The moon's low gravity makes it easy to launch ice into space. Lunar ice is
converted into hydrogen + oxygen rocket fuel, moved to low-Earth-orbit, and
used to help rockets go from there to other destinations.
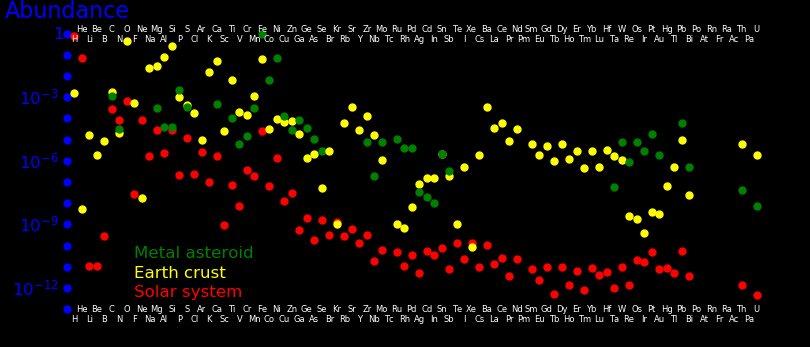
The moon has metal asteroid craters.
In a metal asteroid, the most valuable metals are osmium, rhodium, nickel, platinum, and palladium.
A cubic metal asteroid 100 meters in size has a mass of 1 billion kg, and the value of the metals is:
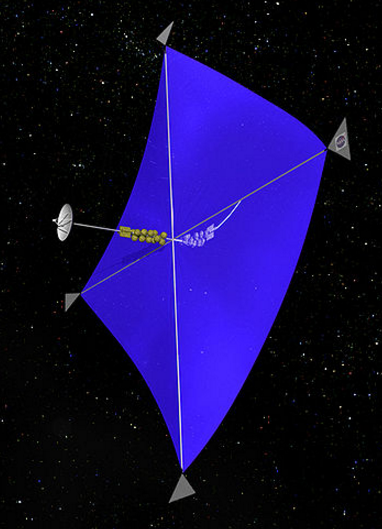
Jet Propulsion Laboratory designed a space mirror with the goal of minimizing the
mass per area. It consists of mylar coated with aluminum.
A space mirror can cool the Earth. Greenhouse gases generated by humans have
increased the sun's effective brightness by 1.5 Watts/meter2. The
size of a mirror required to cancel this is 560000 km2, which costs
3.4 trillion dollars to launch.
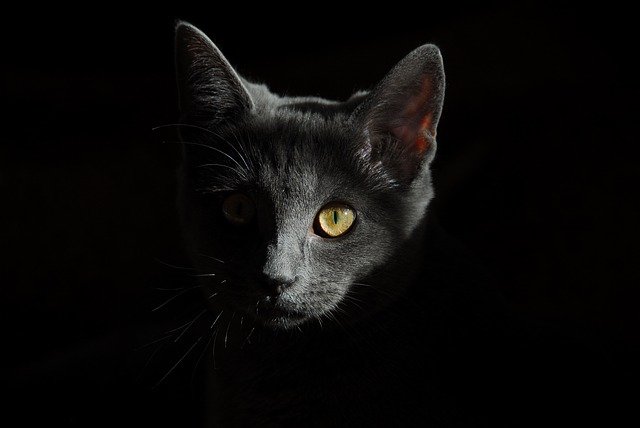
Cities often encourage wild cats to stay wild, and many have a "catch, sterilize, and release"
program. Many also do censuses of cat colonies and have a network of colony caretakers.
The plague has closed down most of New York City's animal shelters.
New York City has the same number of wild cats as house cats.
Wild cats kill on average .12 rats/day. The calorie intake is:
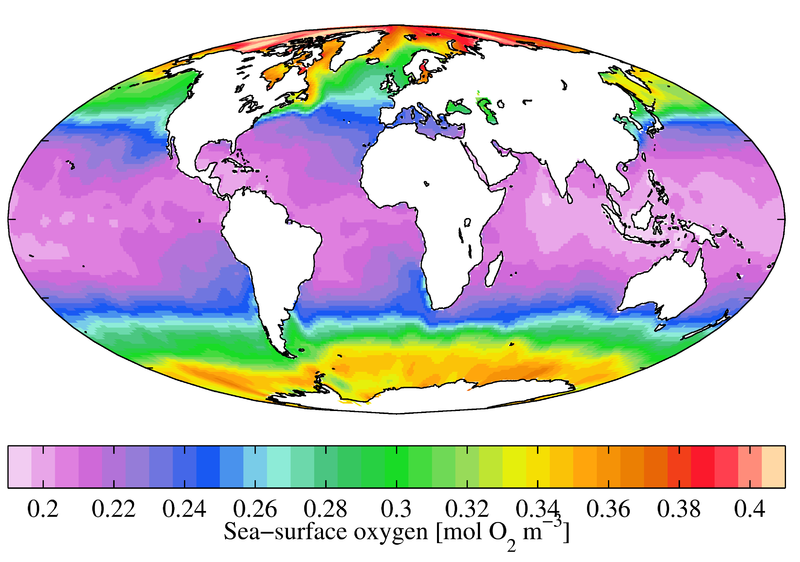
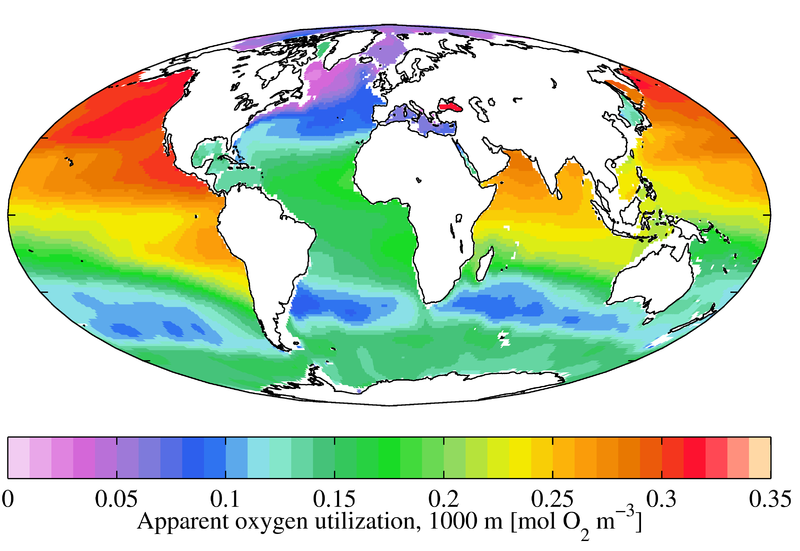
Mass fraction of elements in parts per million. For the ocean, "oxygen" means dissolved
gaseous oxygen.
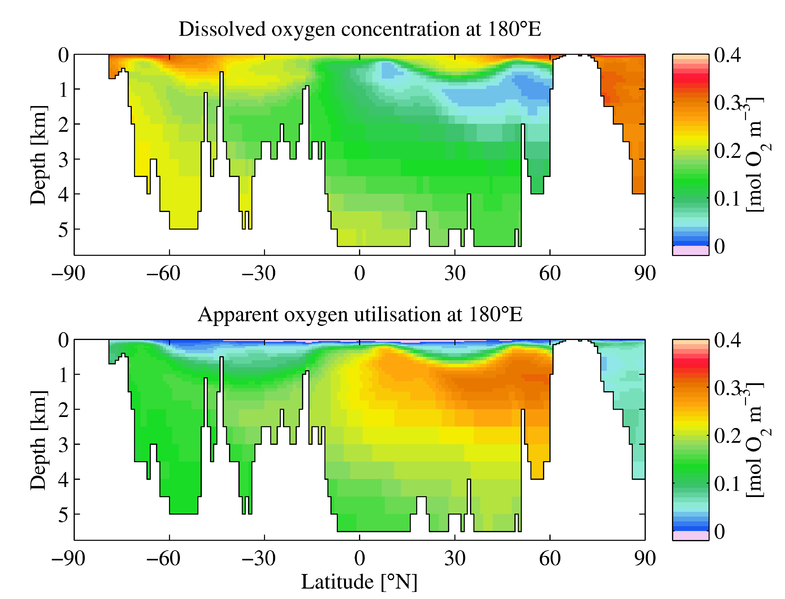
The deep ocean is richer in nutrients than the surface.
For polar oceans, iron is the limiting nutrient for bacteria.
The "Redfield ratio" for ocean carbon fixation by algae and diatoms is
The Pacific and Indian oceans both have upward flows in the global thermohaline
flow and are hence richer in nutrients than the Atlantic ocean. In the
Atlantic ocean water sinks at both poles.
The Indian ocean has a similar composition as the Atlantic ocean.
Atmospheric CO2 dissolves in the ocean and seizes an OH- ion to become bicarbonate (HCO3-).
Silicic acid is produced non-biologically by the dissolving of quartz.
The halflife of water in the ocean is 4100 years.
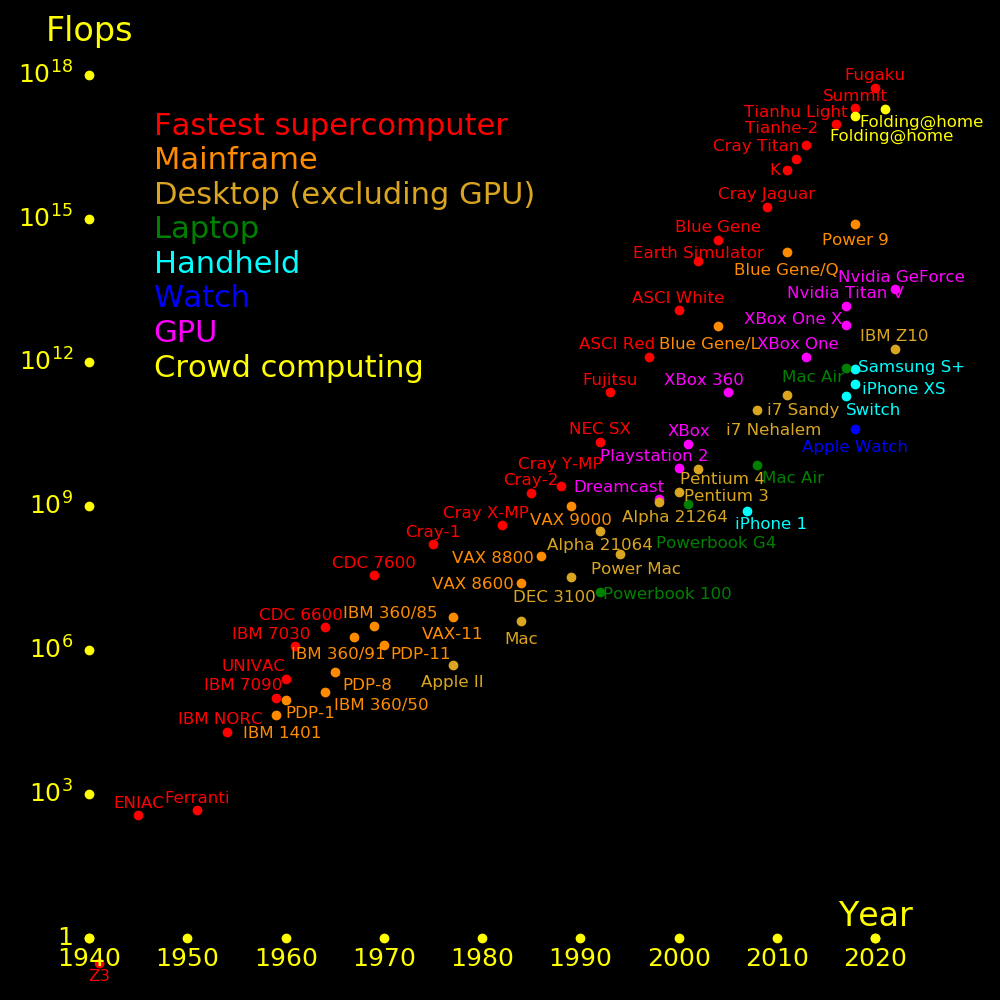
Supercomputers are critical to climate modeling.
The farther ahead we can predict weather, the greater the economic payoff.
Supercomputing is driven by speed/$ and mobile computing is driven by speed/power.
We list the full set of fertilizer molecules.
For example, 1 dollar buys 649 grams of potassium chloride.
Urea = CO(NH2)2 = 1032 gram/$.
                 Albedo

Water             .07
Forest, conifer   .10
Forest, deciduous .16
Grass             .20
Crop              .20
Snow              .62
Latitude     Power at Earth surface, averaged over the year, in Watts/meter2.

    0          230
   15          250
   30          210
   45          180
   60          110
Wood density           =   11  kg/meter2
Wood energy/mass       =   20  MJoule/kg
Wood energy/meter2     =  220  MJoule/meter2
Wood value/kg          = .036  $/kg
Wood value/meter2      = .4    $/meter2
Wood production rate   =  1.0  kg/meter2/year
Energy production rate = 20    MJoule/meter2/year  =  .6 Watts/meter2
Wood nitrogen mass fraction     = n       =  .01
Price of nitrogen in fertilizer = p       = 5.7   $/kg
Nitrogen price / kg wood        = P = p n =  .057 $/kg
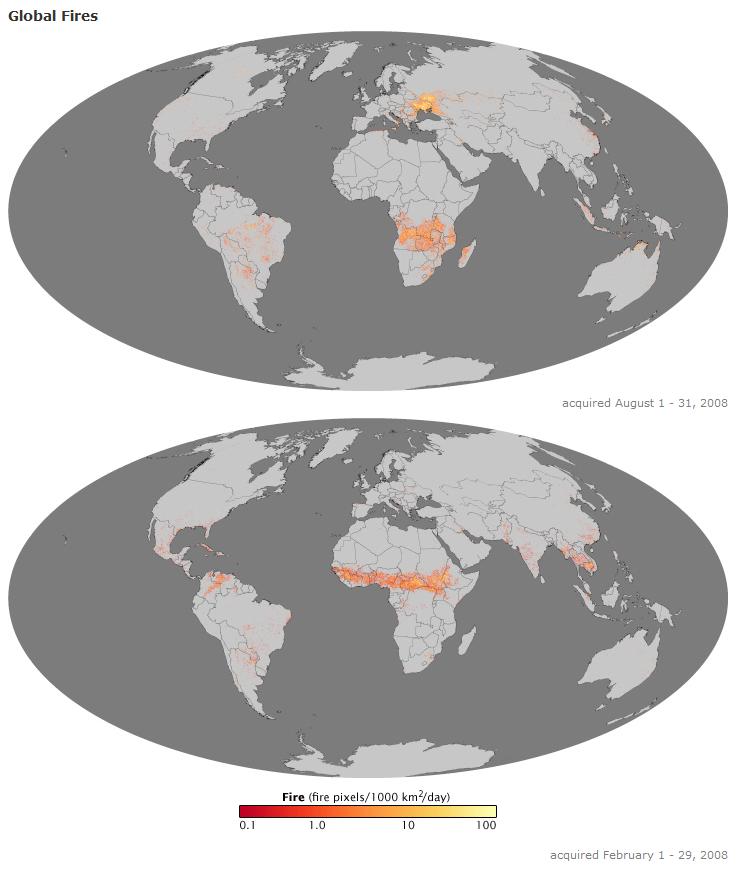
          World fraction  Forest  Deforestation  Fires
                %          Bkg       Bkg/yr      Bkg/yr

South America   22        96000        400         50
Russia          21        92000          ?        100
Africa          17        73000        240         50
Canada          12.6      55000          0         50
USA              7.9      34800          0         15
S.E. Asia        5.9      26000       -120         10
China            5.3      23300       -170         20
E.U.             4.1      18000        -40          3
Asian Islands    3.6      15800         30         10
Australia + NZ   3.2      14100          ?         20
C. America       2.7      11900         60          5

World            1000    440000        350        250
Carbon in atmosphere               = 880  trillion kg
Carbon in plants                   = 550  trillion kg
Carbon in trees                    = 500  trillion kg
Total human-generated carbon       = 300  trillion kg

Forest carbon capture rate         =  45  trillion kg/year
Atmospheric carbon increase rate   =   4  trillion kg/year

World forest area                  =  39  million km2
New forest neeeded to offset carbon=   4  million km2

Deforestation rate                 = .35  trillion kg/year

Total wood carbon harvested        =4.56  trillion kg/year     Wood for power + wood for industry
Wood carbon for biomass power      =1.59  trillion kg/year
Wood carbon for industry           =2.97  trillion kg/year
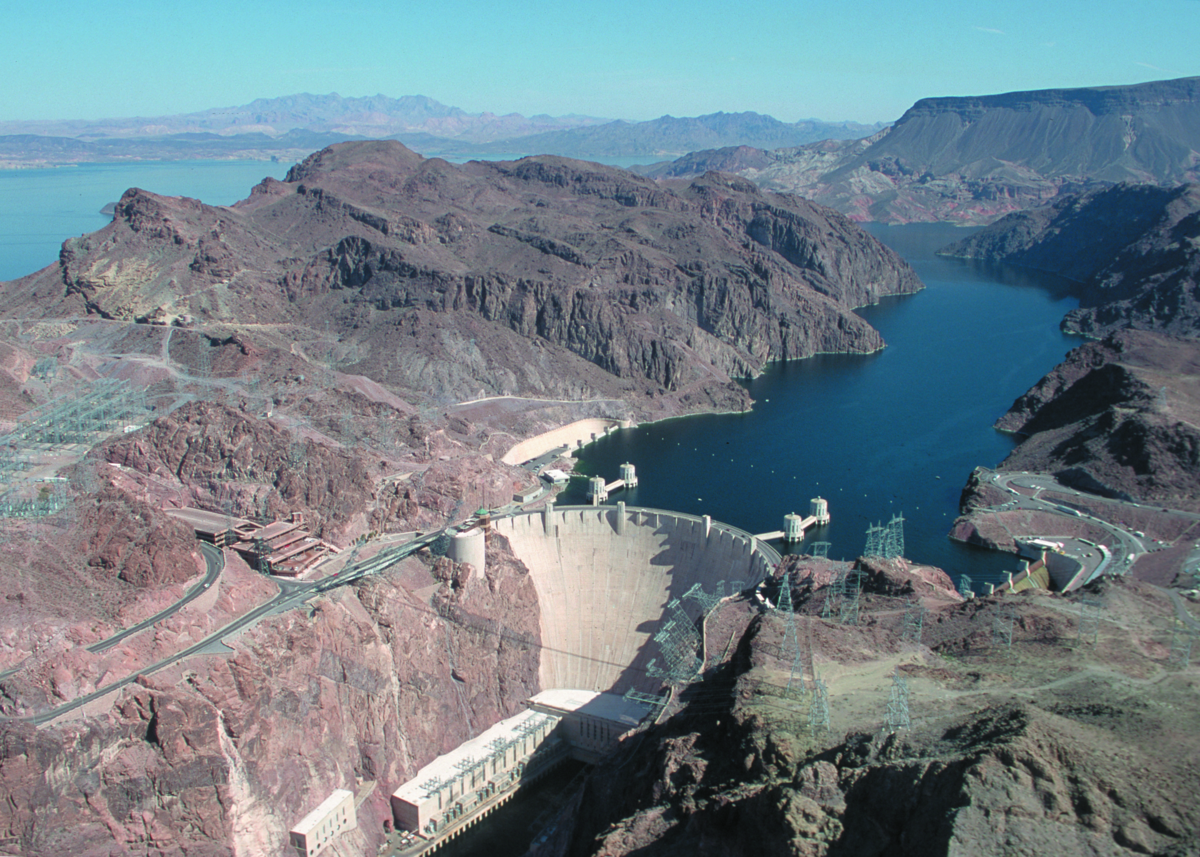
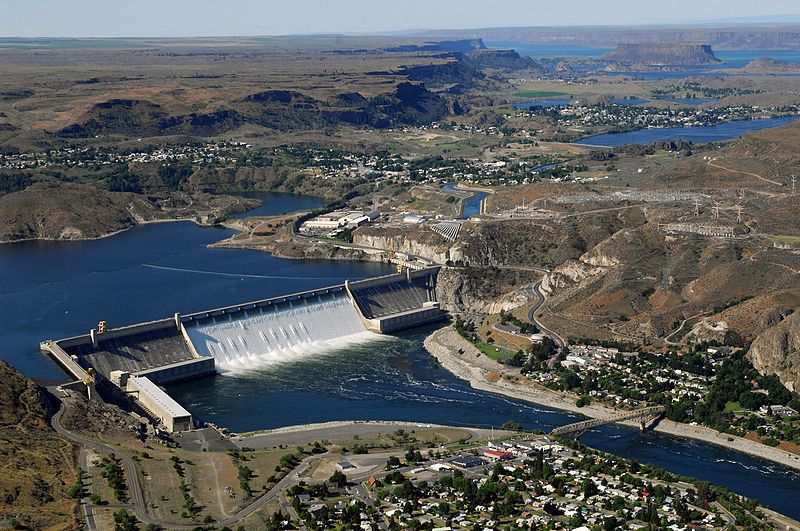
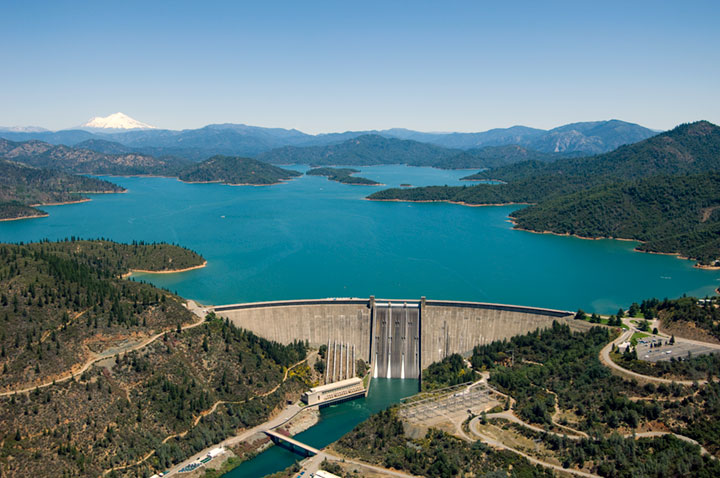
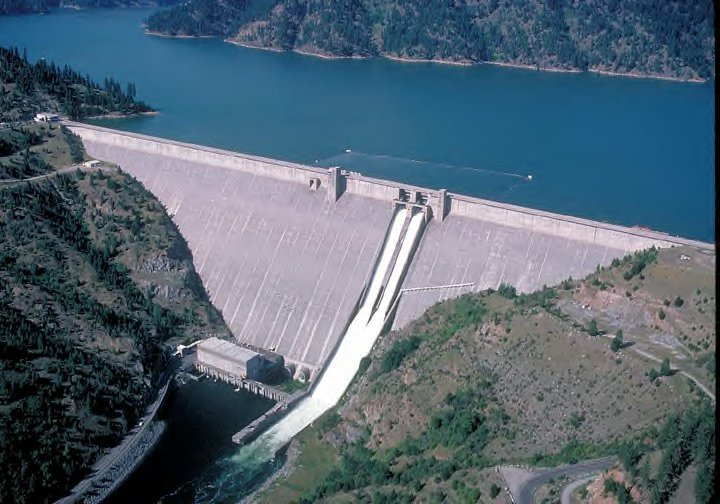
Height Year Power Capacity
meter completed MW MW
Grand Coulee 170 1942 2235 7079
Glen Canyon 93 1966 521 1320
Hoover 221 1936 360 2080
Oahe 75 1963 289 786
Garrison 64 1954 248 583
Shasta 184 1945 214 676
Niagara Adams 1895 37
Buffalo Bill 110 1910
Roosevelt 109 1911
Arrowrock 110 1915
Elephant Butte 92 1916
O'Shaughnessy 130 1923
Gorge 91 1924
Horse Mesa 93 1927 15
Canyon 109 1927 18
Pacoima 111 1929
Diablo 119 1930 76 129
Owyhee 127 1932
San Luis 93 1967 424
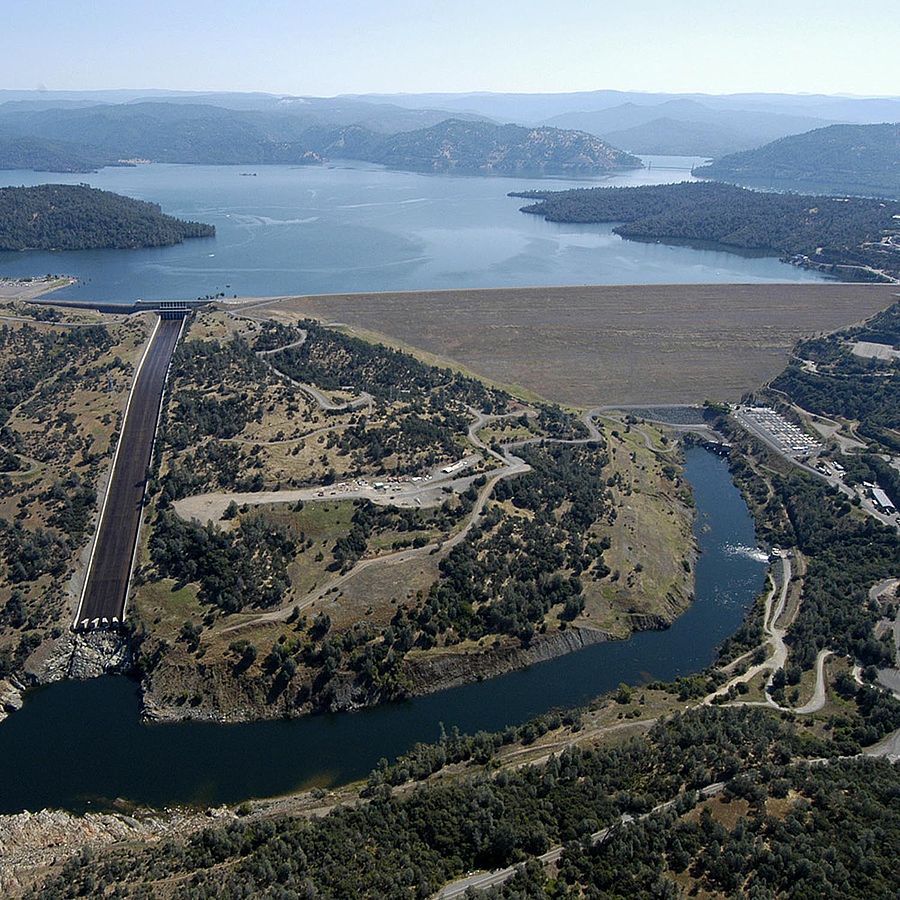
Oroville Dam 187 1968 170 819
New Bullards 197 1969 123 340
Dworshak Dam 219 1973 187 400
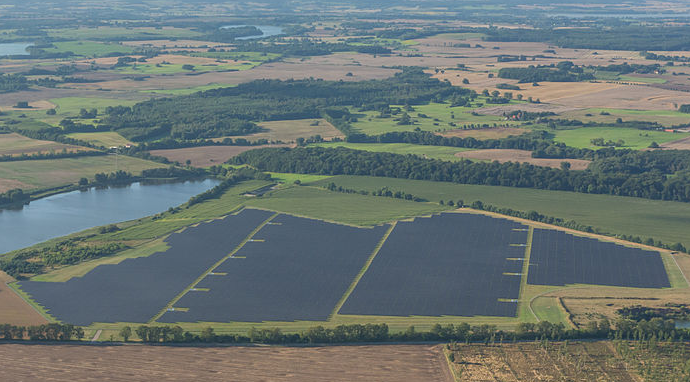
                                       GWatts  km2  MWatts/km2  B$  $/Watt

California   Solar Star                   .58   13    45
California   Topaz                        .55   25    22      2.5   4.5    Thin film CdTe
California   Desert Sunlight              .55   16    34                   Thin film CdTe
China        Longyangxia Dam              .32    9    36
California   Cal. Valley Solar Ranch      .29    8    36      1.6   5.5    Silicon crystal
Arizona      Agua Caliente Solar Project  .29   10    29      1.8   6.2    Thin film CdTe
Solar cell efficiency         =  e             =  .20               Converting solar to electric energy
Arizona solar intensity, peak =  Ipeak          = 1000 Watts         Noon in mid-summer
Arizona solar intensity, ave. =  Iave           =  250 Watts         Averaged over day and night
Solar cell peak power         =  Ppeak =  e Ipeak=  200 Watts
Solar cell average power      =  Pave  =  e Iave =   50 Watts
Technology Efficiency $/Watt Market frac Key element Element cost ($/kWatt)
Multi junction .41 Gallium
Thin film Ga As .29 Gallium
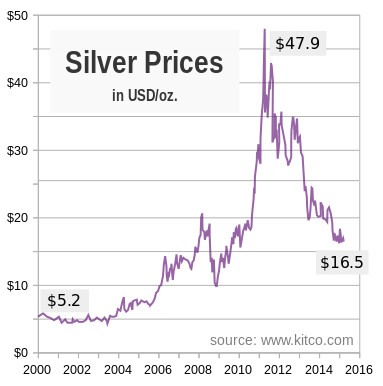
Crystalline Si (mono) .25 .50 .36 Silver 48
Crystalline Si (poly) .20 .50 .55 Silver 100
Thin film Cu In Ga Se .20 .02 Indium
Thin film Cd Te .16 .051 Tellurium 5
Thin film Amorphous Si .11 .02 -
World record .44
Solar cell efficiency               =  e
Peak power                          =  Ppeak =  e Ipeak    =  200 Watts
Cost of inverter per peak Watt      =  Qinv  =  .15 $/Watt
Cost of inverter                    =  Cinv  =  Qinv Ppeak  =  15 $
Cost of solar cell                  =  Ccell               = 100 $
Total system cost                   =  Ctotal              = 200 $
The the inverter costs less than the solar cell.
                                    Peak    Avg    km2   B$   $/Watt
                                   GWatts  GWatts

China       Gansu Wind Farm           6.0                   5.2    .9
India       Muppandal Wind Farm       1.5
California  Alta                      1.55    .31    36
India       Jaisalmer Wind Park       1.06
Oregon      Shepherds Flat Wind Farm   .84    .23    78     1.4   1.7
Texas       Roscoe Wind Farm           .78          400
Texas       Horse Hollow Wind Center   .74          190
               MWatts    M$  Watts/$  Blade diam  Height
                                         (m)       (m)
Bergey XL-1      .001    .004   .25      2.5
Bergey Excel-S   .010    .024   .42      7.0
GE 1.5 MW       1.5     2       .75     60          80
Vesta V164      8      10       .8     164         220
Air density                 =  D          =  1.22 kg/meter3
Blade radius                =  R          =    82 meter
Wind turbine cross section  =  A  =  πR2  = 21000 meter2
Wind speed                  =  V          =    10 meter/second    (Typical for a good site)
Efficiency factor           =  Q          =   .75                 (Cannot be larger than 1)
Power generated             =  P  = .59 QDAV3 =  11 MWatts
Cost per Watt               =    1  $/Watt
Peak power                  =  1.5  MWatts
Total cost                  =  1.5  M$
Height                      =   80  meters
Rotor mass                  =   22  tons
Rotor diameter              =   60  meters
Tower mass                  =   52  tons
Steel in foundation         =   26  tons
Concrete in foundation      =  456  tons
Base diameter               =   15  meters
Blade lift-to-drag ratio    =  120
Rotor cost fraction         =  .20
Generator cost fraction     =  .34
Tower cost fraction         =  .15
Geared generator Neodymium  =  .025 kg/kWatt  =  .62 $/kWatt
Gearless generator Neodymium=  .25  kg/kWatt  = 6.2  $/KWatt
Neodymium total cost        = 9300  $            (Gearless generator, 1.5 MWatts)
Neodymium fraction of magnet=  .31               (By mass)
Neodymium price/kg          =   20  $/kg
               Mass   Value of   Value of element  Half life
                      element     in burnt fuel
               gram     $/kg          $/kg           year

Rhodium-103     26.1   500000      13000            Stable
Palladium-106   22.4    72000       1600            Stable
Xenon           44.6     1800         80            Stable       A mix of Xenon-131 and Xenon-132
Technetium-99   51.4        ?          ?            211000
Strontium-90    11.8        ?          ?                28.8
Wind turbine height  =  H  =  100 meters
Coastline length     =  L  =   10 km
Wind speed           =  V  =   25 meters/second
Efficiency           =  f  =  1/4
Air density          =  D  =  1.22 km/meter3
Power                =  P  =  f D H L V3  =  4.8 GWatts
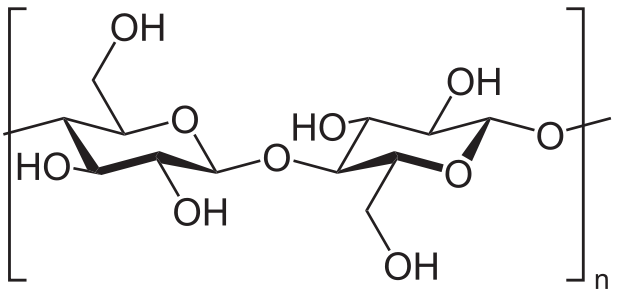
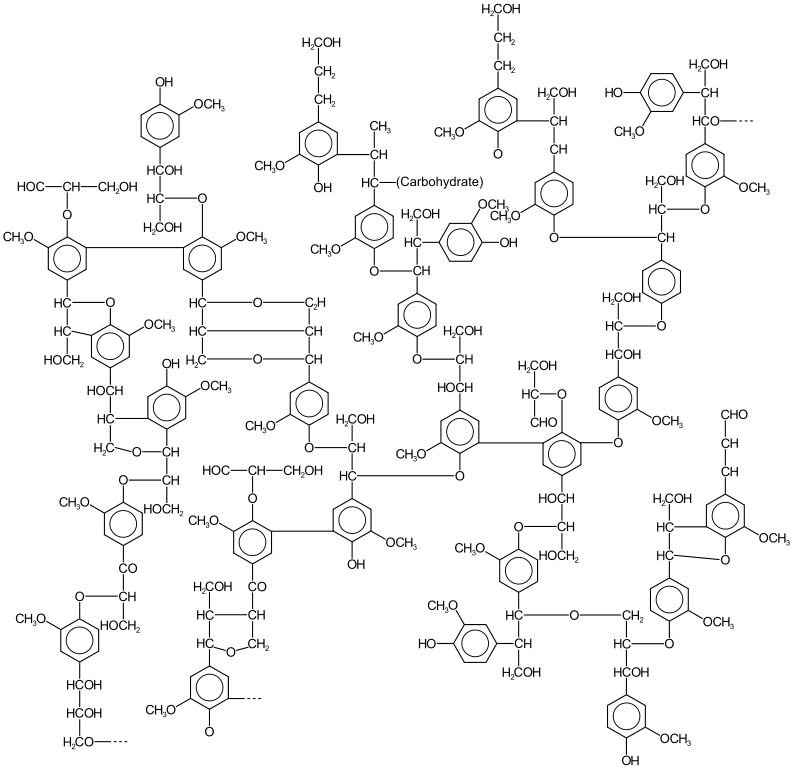
Carbon       .44
Oxygen       .44
Hydrogen     .06
Nitrogen     .01
Potassium    .01
In the process of "pyrolysis", biomass is heated in a zero oxygen environent,
producing carbon (biochar). Energy is extracted from the biomass without producing
CO2. When biochar is added to soil it improves the water retention and nutrient content.
                                 Celsius    Char     Energy yield
                                          fraction      (MJ/kg)

Bamboo cold pyrolysis (no oxygen)   400      .4           4
Bamboo hot pyrolysis  (no oxygen)   700      .2          10
Bamboo (burn in O2)               >2000      .02         18
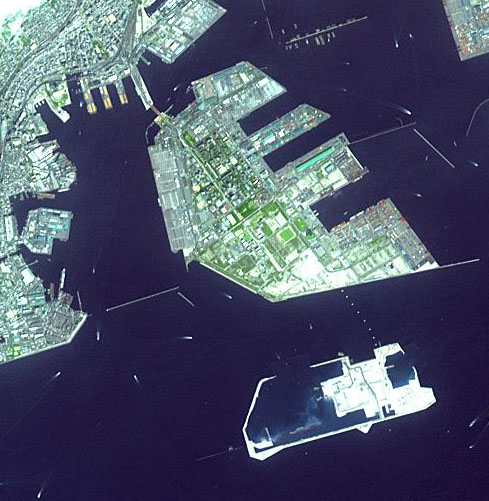
              Gain       Loss
              km2        km2

World         25000     53375
China         13500
Netherlands    7000
South Korea    1550
USA            1000
Japan           500      2190
Ecuador                 28500
Vietnam                 14700
Sweden                   3290
Iraq                     3070
Bulgaria                 2030
Element     Relative mass

Carbon        1
Nitrogen       .18
Phosphorus     .024
Iron           .000044
_(NSF).jpg)
Energy required to move an iceberg = Constant * Distance moved * Velocity2
Iceberg height           =  Z               =    .5 km
Iceberg sice length      =  X               =    10 km
Density of ice           =  d               =   917 kg/m3
Density of seawater      =  D               =  1025 kg/m3
Iceberg mass             =  M  = d X2 Z     =    46 trillion kg

Iceberg distance traveled=  L               =  1000 km     (Assume ocean currents help)
Iceberg travel time      =  T               =     1 year
Iceberg speed            =  V  =  L/T       =   .03 m/s

Drag force               =  F = ½ D X Z V2  =   2.3 million Newtons
Drag energy              =  E  =  F L       =  2300 GJoules
Drag power               =  P  =  F V       =    69 kWatts
Energy cost              =  e               =    36 MJoules/$
Freshwater value per kg  =  z               = .0001 $/kg
Iceberg freshwater value =  Z  =  M z       =     5 billion $

        Parts per million

Potassium       160
Nitrogen        150
Calcium         100
Phosphorus       40
Sulfur           40
Magnesium        30
Iron              2
Manganese          .5
Zinc               .3
Boron              .2
Copper             .1
Molybdenum         .075
Source
                  Amplification factor

Plant density               8          In terms of plants/meter2
Crops per year              4
Crop variety                2
Temperature contro l        2
LED lighting                2
Carbon dioxide enhancement  1.5
         Concentration   Value    Value in asteroid
             ppm         $/kg         Billion $

Osmium         7.6     1600000      12
Rhodium        4.1      500000       2.0
Nickel     67000            16       1.1
Platinum      19         35000        .7
Palladium      3.8       72000        .3
Cobalt      6300            33        .2
Iron      910000              .15     .1
Mirror surface density =     6  grams/meter2
Mirror thickness       = .0043  mm       (Mylar coated with aluminum)
Mylar density          =  1.39  g/cm3
Aluminum density       =  2.70  g/cm3
Greenhouse gas forcing preindustrial          =   1.5 Watts/meter2
Greenhouse gas forcing now                    =   3.0 Watts/meter2
Solar forcing change                = I       =   1.5 Watts/meter2
Solar forcing increase rate                   =  .031 Watts/meter2/year
Earth surface area                  = A       =   510 Million km2
Solar power change                  = P = IA  =   765 TWatts
Solar intensity                     = I       =  1361 Watts/meter2
Mirror area                         = A = P/I =560000 km2   =   (750 km)2
Mirror mass/area                    = D       =  .006 kg/meter2
Mirror mass                         = M = DA  =   3.4 billion kg
Launch cost per kg                            =  1000 $/kg
Mirror launch cost                            =   3.4 trillion $
Pet dogs in homes  300000
Pet cats in homes  600000
Wild cats          400000
Given to shelters   20000 per year
Adoptions           14000 per year
Euthanized           4000 per year
NYC area              784 km2
NYC humans        8300000
Wild cats/area          5 cats/hectare
Cat mass             = 4.5   kg
Rat mass             =  .265 kg
Cat food requirement = 218   Calories/day
Rat kills/day        =   .12 Rats/day
Calories in a rat    = 800   Calories
Calories from rats   =  96   Calories/day
          Human   Wood   Cane   Ocean   Ocean    Ocean   Deep     Deep     Soil   Soil    River  Ocean     Ocean
                         plant  (avg)  surface  surface  Pacific  Atlantic       (avail)        halflife   molecule
                         (dry)          polar   equator                                          (Myr)
Oxygen    650000 420000           10                        5       8                                      O2      Dissolved oxygen
Carbon    180000 400000 400000    28                                                      58      .11      HCO3-   Bicarbonate
Hydrogen  100000  60000                   .0072    .0072                                                   H+      Acid pH=8.14
Nitrogen   30000  20000  31000      .5    .50      .05       .56     .28                    .23            NO3-    Nitrate
Calcium    14000   2000          410                                        10000  10000  15      1.0      Ca++
Phosphorus 11000  13000  11500      .07   .005     .0005     .009    .003    1000     10    .02            HPO4--  Phosphate
Potassium   2500  44000  33700   390                                         1500      3   2.3   12        K+
Sulfur      2500   1000    900   910                                           40          8     11        SO4--   Sulfate
Sodium      1500               10800                                                       6.3   68        Na+
Chlorine    1500               19400                                                       8    100        Cl-     Chloride
Magnesium    500   1300         1290                                                       4.1   13        Mg++
Iron          60    165     75      .0034  .000006 .00002    .00028  .00034                 .7     .0002
Fluorine      37                   1.3                                                                     F-      Fluoride
Zinc          32                    .0049                    .0007   .00013
Silicon       20                   2.2   1.69      .140     4.2     1.4                    1.3     .02     H4SiO4  Orthosilicic acid
Bromine        2.9                67                                                                       Br-
Strontium      4.6                 8.1
Strontium                          8                                                                       Sr++
Rubidium       4.6                  .12
Nickel                              .0066
Vanadium                            .0019
Titanium                            .001
Aluminum                            .001                                                           .0006
Copper         1     190    13      .0009
Cobalt                              .0004
Manganese                           .0004                                                          .0013
Chromium                            .0002
Lead           1.7                  .00003
Boron                  3     2     4.4                                                                     BO3---  Borate
Lithium                             .17
For equatoral oceans, nitrogen is the limiting nutrient.
(Carbon, Nitrogen, Phosphorus, Iron) = (106:16:1:.001)
For the ocean, all elements with a mass fraction larger than 1e-6 are included.
Speed per dollar        =    2  GFlop/$      (CPU)
Speed per dollar        =   40  GFlop/$      (GPU)
Memory, RAM             =   .2  GByte/$
Memory, solid state     =    7  GByte/$
Memory, disk            =   33  GByte/$
Speed per power         =  200  GFlop/Watt   (GPU)

Battery energy per mass = 1000  MJoule/kg
Battery power  per mass = 1000  Watt/kg
Element     Molecule     Common name          Element  Fertilizer  Element   Solubility   Human
                                               cost       cost     fraction               edible
                                                g/$       g/$        ppt      g/Litre

Calcium     CaCl2        Calcium chloride        182       504       361        745         *
Calcium     Ca(NO3)2     Calcium nitrate          35       142       244       1212
Calcium     Ca(H2PO4)2   Monocalcium phosphate                       171         20         *
Calcium     CaHPO4       Dicalcium phosphate                         295           .2       *
Calcium     Ca3(PO4)2    Tricalcium phosphate                        388           .02      *
Calcium     Ca(C2H3O2)2  Calcium acetate                             253        347         *
Calcium     CaC6H10O6    Calcium lactate                             184         58         *
Calcium     Ca3(C6H5O7)2 Calcium citrate                             241           .85      *
Calcium     CaCO3        Calcium carbonate                           400           .013     *
Calcium     CaC12H22O14  Calcium gluconate                            93        low         *

Potassium   KCl          Potassium chloride      340       649       524        254         *
Potassium   K2SO4        Potassium sulfate       136       303       449
Potassium   KH2PO4       Monopotassium phosphate  44       153       287        226         *
Potassium   K2HPO4       Dipotassium phosphate              13                 1492         *
Potassium   K3PO4        Tripotassium phosphate                                 900         *
Potassium   KNO3         Potassium nitrate                 126       387

Phosphorus  (NH4)H2PO4   Monoammonium phosphate  185       689       269        360
Phosphorus  (NH4)2HPO4   Diammonium phosphate     38       161       235        600
Phosphorus  KH2PO4       Monopotassium phosphate  35       153       228        226         *
Phosphorus  Mg(H2PO4)2   Monomagnesium phosphate                                            *
Phosphorus  MgHPO4       Dimagnesium phosphate                                              *
Phosphorus  Mg3(PO4)2    Trimagnesium phosphate                                             *

Magnesium   MgCl2        Magnesium chloride       55       217       255                    *
Magnesium   MgSO4(H2O)7  Magnesium sulfate        33       336        99
Magnesium   Mg(H2PO4)2   Monomagnesium phosphate                                            *
Magnesium   MgHPO4       Dimagnesium phosphate                                              *
Magnesium   Mg3(PO4)2    Trimagnesium phosphate                                             *
magnesium   Mg(NO3)2     Magnesium nitrate                           164        710
Magnesium   MgS          Magnesium sulfide                                      351

Nitrogen    CO(NH2)2     Urea                    482      1032       467       1079
Nitrogen    (NH4)H2PO4   Monoammonium phosphate   84       689       122        360
Nitrogen    (NH4)2HPO4   Diammonium phosphate     34       161       212        600
Nitrogen    (NH4)2SO4    Ammonium sulfate         69       324       212        744
Nitrogen    (NH4)NO3     Ammonium nitrate                            350        150
Nitrogen    KNO3         Potassium nitrate                           139
Nitrogen    Mg(NO3)2     Magnesium nitrate                           189        710

Sulfur      (NH4)2SO4    Ammonium sulfate         79       324       243
Sulfur      K2SO4        Potassium sulfate        56       303       184
Sulfur      MgSO4(H2O)7  Magnesium sulfate        44       336       130
                 Chloride   Phosphate   Sulfate   Nitrate
                    Cl         PO4        SO4      NO3
                   g/$         g/$        g/$      g/$

Potassium   K       649        153        303*     126
Calcium     Ca      504*         -        114      142*        Calcium sulfate = Gypsum
Magnesium   Mg      217          -        336*     113*
Nitrogoen   NH3     283        698        163*       -         Ammonium nitrate is an explosive