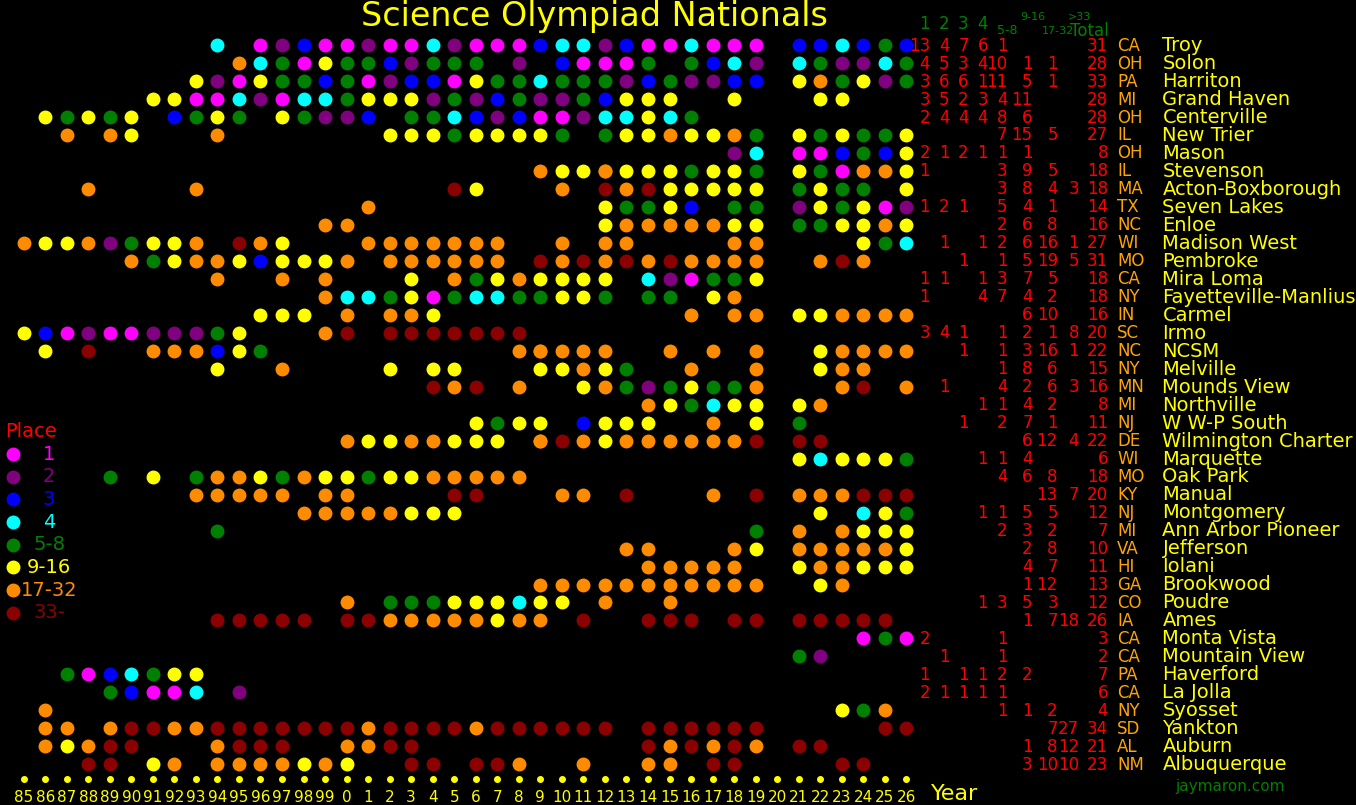
Science Olympiad History
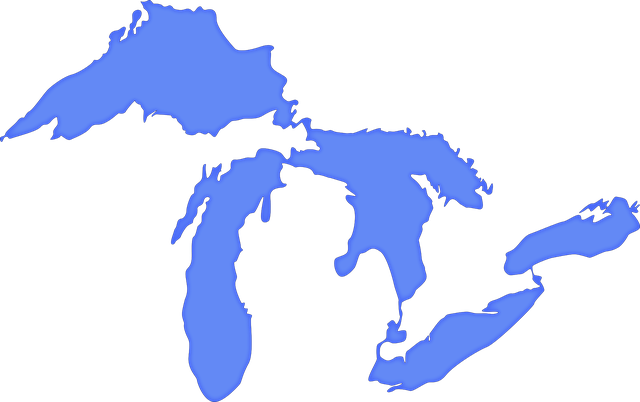
The first Science Olympiad nationals tournament was in 1985 at Michigan State
University, featuring mostly Great Lakes schools. The next year saw all states competing.
Today, 8000 schools compete and there are abundant invitationals.
Many schools field more than 4 teams and attend more than 4 invitationals.
Tournaments
SO can host massive online tournaments with sciolympiad.org, and there is a database
of results at sccioly.org and duosmium.com. Some tournaments can host 100 teams and get grading done
in time for an evening awards ceremony.
Many volunteers contribute to SO. Much work is needed for supervising events, writing tests,
and grading tests. Much money is needed for travel and materials.
The field of competition at some invitationals is almost as
strong as nationals.
Events
The SO is like a science track meet, with events in all sciences. There are engineering events
where you build things, and science events that are test-based.
Divisions
The C division is grades 9-12, B is 6-9, and A is 3-6.
9th graders may compete on a high school or middle team. 6th graders may compete on a middle school
or elementary school team.
There is an informal "Division D" consisting of alumni and volunteers.
Strong teams
Most heavyweight schools are public. For 1997-2021, there were no
private schools in the top 10 nationally. Good placements by private schools
include Pembroke Hill (3rd in 1996) and Marquette (4th in 2022).
 |
|
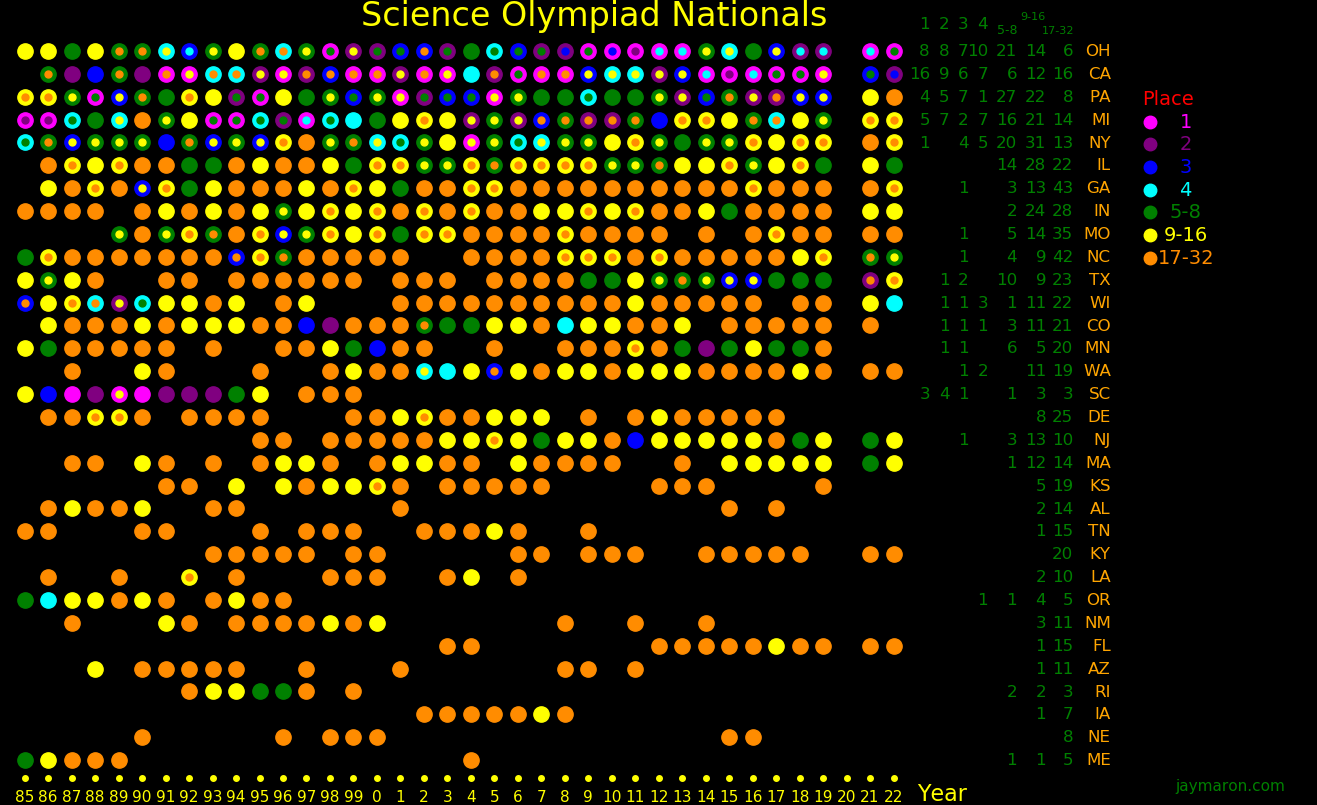
Strong states
Heavyweight states include California, Ohio, Pennsylvania, and Michigan.
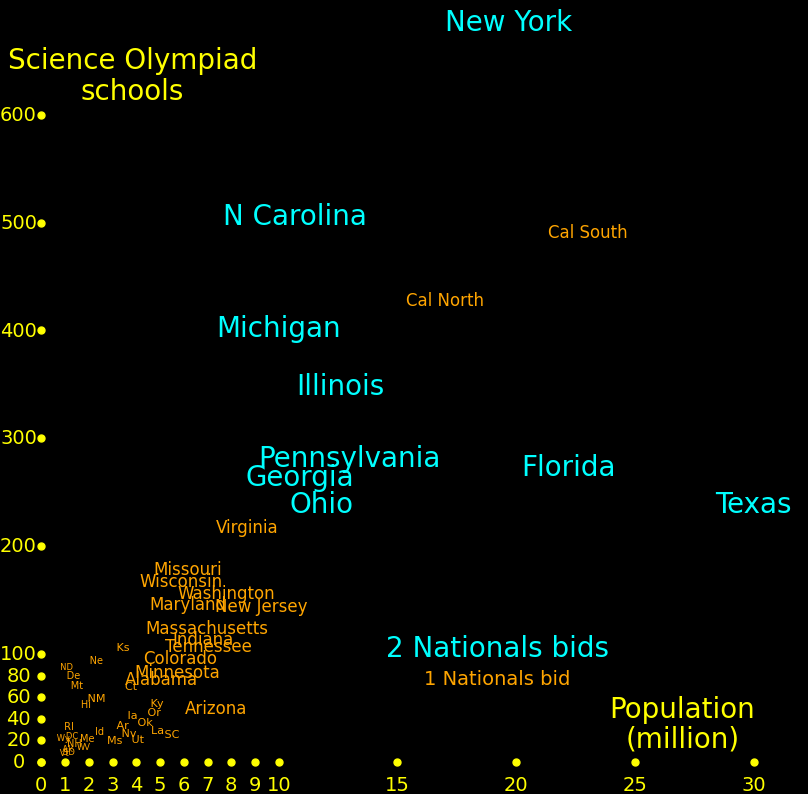
Science Olympiad Nationals bids and the 2026 season
The nationals qualification system often excludes good teams.
State champions (including DC) get a bid to nationals, and the 10 states with the most Science Olympiad
schools get 2 bids. California is a special case. North and South California hold separate state tournaments
and each gets one Nationals bid.
Invitationals give a measure of the strength of teams that don't have a nationals bid.
There are usually around 3 such teams that can place in the top half at Nationals.
The "States of death" are Cal North, Cal South, Wisconsin, New York, New Jersey, and Massachusetts.
States sometimes decline their bid, opening an at-large bid. The recipients of such bids are:
       At-large bid recipient   Nationals place     Declined bid

2026   Wisconsin    Marquette         8             Alaska   Idaho   Vermont
2025   Virginia     Woodsen          25             Alaska   Idaho   Vermont
2025   Wisconsin    Madison West      7
2024   Wisconsin    Madison West     13             Alaska   Idaho   S Dakota   N Dakota   Mississippi
2024   Virginia     Langley          30
2023   Missouri     Pembroke         35             Alaska   Idaho   S Dakota
2023   Virginia     Langley          34
2022   Georgia      Walton           22             Alaska   Idaho
2022   Virginia     Jefferson        21
2021   None                           -             None
2019   None                           -             None
2018   None                           -             None
2017   None                           -             DC
2016   None                           -             DC
At-large Madison West placed 7th and at-large Marquette placed 8th.
For 2018-21, only 9 states got 2 bids.
The strength of the field for an invitational can be calculated from last year's nationals results.
with an algorithm given in the appendix.
The table shows teams that didn't get a Nationals bid for 2026 but did well at invitationals
The number under each invitational is a measure of the strength of the field, calculated from 2025 Nationals.
The standouts are Mountain View, Marquette, Syosset, and Lexington.
The strongest invitational is MIT, which includes almost all top-16 teams from Nationals.
MIT ranks correlate well with Nationals ranks.
Placing in the top 16 at MIT indicates a national contender.
             Nationals  State rank   MIT  Penn Mich  Rickards Solon  Lexi  Gate  Prin  Mason  Corn  Loyola  USC
             rank 2026     2026      62.5  36   33     30.5     29    25    15    14    12     11    10.5   9.5

CaN Mountain View            2        3                                      2
WI  Marquette        8       2        6          3     29                               22            3
NY  Syosset                  3        9     3           7                                       4
MA  Lexington                2       12                                      5
NJ  WWPN                     2       17    11                                      7
NJ  WWPS                     3                          1                          1
CaN Castro Valley            3                         47                    9           5                  6
CaN Temple City              4                          4                    4
Strength of field for invitationals for 2026
The strength of field is computed using nationals results from the previous year.
A "*" indicates that the host is a university. A "+" indicates that the invitational
is in-person and an "o" indicates online.
MIT                   62.5  *       +
U Pennsylvania        36    *  Ivy  +
U Michigan            33    *       +
Rickards              30.5          o
Solon                 29            +
Lexington             25            o
Berkeley Golden Gate  15    *       +
Princeton             14    *  Ivy  +
Mason                 12            o
Cornell               11    *  Ivy  +
Loyola                10.5  *       +
USC                    9.5  *       +
Brown                  7.5  *  Ivy  +
Marquette U            7.5  *       +
Harvard                7    *  Ivy  +
U Texas Austin         7    *       +
Columbia               5    *  Ivy  +
U Wisconsin Badger     4    *       +
Yale                   4    *  Ivy  +
Dartmouth              3.5  *  Ivy  +
Duke                   2.5  *       +
U North Carolina       2    *       +
Stanford               0    *       +
Northwestern           0    *       +
Notre Dame             0    *       +
Strength of field of an invitational
We use nationals results from 2025 to judge team strength.
The strength of an invitational is the sum of the strengths of the
teams in the field. The conversion from nationals rank to points is logarithmic.
Points = 7 - log2 Rank
Discretizing,
Rank   Points

  1      7
  2      6
  3      5.5
  4      5
 5-6     4.5
 7-8     4
 9-12    3.5
13-16    3
17-24    2.5
25-32    2
33-48    1.5
48-      1
Invitationals
The MIT Invitational featured most of the top-16 from the previous year's nationals.
The first column is rank at the invitational and the second column is rank at 2025 nationals.
The number by the invitational is a measure of the strength of field, which is calculated from
nationals 2025 ranks.
MIT  62.5                  U Pennsylvania  36      U Michigan  33        Rickards  30.5         Solon  29               Lexington  25          Golden Gate  15

 1  5 ca Troy              1 10 nj Montgomery      1  3 oh Mason         1  - nj WWPS           1  6 il New Trier       1  5 ca Troy           1  5 ca Troy
 2 10 nj Montgomery        2 22 ny Stuyvesant      2  6 il New Trier     2  8 ca Monta Vista    2  4 oh Solon           2 22 ny Stuyvesant     2  - ca Mountain View
 3  - ca Mountain View     3 18 ny Syosset         3  9 wi Marquette     3  1 tx Seven Lakes    3 21 il Stevenson       3  - mn Mounds View    3  8 ca Monta Vista
 4  8 ca Monta Vista       4 19 va Jefferson       4 13 mi Novi          4  - ca Temple City    4  7 wi Madison West    4 22 ny Stuyvesant     4  - ca Temple City
 5 12 hi Iolani            5  1 tx Seven Lakes     5  - oh Mason 2       5  2 tx Seven Lakes 2  5  3 oh Mason           5 19 va Jefferson      5 11 ma Lexington
 6  9 wi Marquette         6  - ny Stuyvesant 2    6  7 wi Madison West  6  - fl Frazer         6 13 mi Novi            6 14 mi Ann Arbor P    6 15 tx LASA
 7  6 il New Trier         7  - va Jefferson 2     7 24 in Carmel        7 18 ny Syosset        7 20 pa Cumberland Val  7  3 oh Mason          7  - ca Troy 2
 8  7 wi Madison West      8 17 nc Enloe           8  4 oh Solon         8  6 il New Trier      8  - oh Orange          8  - ca Troy 2         8  - ca Wilson
 9 18 ny Syosset           9  2 pa Harriton        9 14 mi Ann Arbor P   9  - ny Jerico         9 24 in Carmel          9  - ny Bronx Sci      9  - ca Castro Valley
10 22 ny Stuyvesant       10  - ny Great Neck S   10  - in Munster      10  - ca University    10  - oh Mason 2        10  - or Sunset        10  - ca Palo Alto
11  3 oh Mason            11  - nj WWPN           11  - oh Solon 2      11  - ca University 2  11 18 ny Syosset        11  - ny Bronx Sci 2   11  - wa Tesla STEM
12 11 ma Lexington        12 30 nv Clark                                12  - tx Tompkins      12  - ny Great Neck S   12  - ca lynbrook
13  2 pa Harriton         13  - pa Garnet Valley                        13  - ca N Hollywood   13  - ma Wellesley      13  - ca Westview
14  - ma Acton-Box 2      14  - ny Melville                             14  - 22 ny Stuyvesan  14  - ny Cardozo        14  - ca Mission San Jose
15  - ma Acton-Box        15  - nj Montgomery 2                         15  - ca Portola       15  - ny Stuyvesant 2   15  - ca Sunny Hills
16 17 nc Enloe            16 26 md Centennial                           16  - il New Trier 2   16 24 in Carmel         16  - ca Amador Valley
17  - nj WWPN             17  - pa Harriton 2                           17  - ca West View
18 21 il Stevenson        18  - pa Lower Merion                         18  - ca American
19  - ca Mountain View 2  19 23 ga Walton                               19  7 wi Madison West
20 15 tx LASA             20 31 fl Boca Raton C
21 20 pa Cumberland Val
22 31 la Boca Raton Comm                                                22  - ca Lynbrook
23  - ca Nortwood
24 13 mi Novi
                                                                        25 31 la Boca Raton C
27  - ga Chattahoochee
                                                                        29  9 wi Marquette
32  - tx Clements
                                                                        33 33 fl Archimedian
38 33 fl Archimedian
 -  1 tx Seven Lakes
 -  4 oh Solon
 - 14 mi Ann Arbor Pioneer
 - 16 ga Fulton
 - 19 va Jefferson
State tournaments
The 10 states with the most schools get 2 nationals bids and the rest get 1.
California is divided into North and South, with each gettting one bid.
North Dakota sent its 7th-place team to Nationals (Davies).
Numbers are nationals ranks for 2026.
# of teams        1st               2nd              3rd            4th            5th           6th        7th

686   New York    Stuyvesant    17  Great Neck S 20  Syosset        Brooklyn Tech
506   N Carolina  Enloe         16  NCSM         28  Green Hope     Raleigh Charter
402   Michigan    Ann Arbor P   13  Novi         19  Northville     Troy of Mich
348   Illinois    New Trier      9  Stevenson    14  Vernon Hills   Lane Tech
273   Florida     Boca Raton C  22  Frazer       25  Archimedian    Rickards
272   Penn        Harriton       5  Cumberland V 23  Lower Merion   Penncrest
268   Georgia     Walton        26  Cattahoochee 31  Fulton         Brookwood
239   Ohio        Mason         12  Solon         6  Olentangy Orange  Centerville  Beachwood
239   Texas       Seven Lakes    2  Jordan       27  LASA           Clements

491   Cal South   Troy           3  University       Wilson         Temple City
428   Cal North   Monta Vista    1  Mountain View    Castro Valley  Lynbrook
217   Virginia    Jefferson     10  Oakton           Fairfax        Woodson
174   Missouri    Watkins       24  Pembroke         Lindbergh      Parkway West
163   Wisconsin   Madison West   4  Marquette     8  Medford        Menomonie      Hudson        Boyceville
156   Washington  Tesla STEM    29  Interlake        Camas          Eastlake
153   Maryland    Centennial    30  Montgomery       River Hill     Marriotts Ridge
151   New Jersey  Montgomery     7  WWPN             WWPS           Hillsborough
124   Mass        Acton-Boxbor  11  Lexington        Winchester     Newton South
114   Indiana     Carmel        18  Northridge       Munster        Lake Central
111   Tennessee   White Station 38
106   Kansas      Blue Valley W 37
100   Colorado    Homeschool S  36
 94   Nebraska    Lincoln East  57
 85   N Dakota    Legacy         -  Century          Red River      Bismarck       Carrington P  Langdon    Davies  52
 80   Delaware    Wilmington    34
 76   Minnesota   Mounds View   21
 76   Alabama     Clemens       43
 75   Montana     Hamilton      54
 74   Connecticut South Windsor 40
 59   New Mexico  Socorro       46
 54   Kentucky    Manual        33
 53   Hawaii      Iolani        15
 50   Arizona     BASIS Chandler 32
 46   Oregon      Sunset        39
 43   Iowa        Cedar Falls   44
 37   Oklahoma    Cassidy       47
 33   Rhode Is.   Barrington    42
 30   Arkansas    Basis Chandler 32
 29   Louisiana   Baton Rouge M 41
 28   Idaho       Nampa          -
 26   Nevada      Advanced Tech 35
 25   S Carolina  Clinton       53
 24   DC          Basis Chandler 45
 22   Wyoming     Walsh         56
 21   Utah        West          51
 20   Miss        Madison Cent  55
 18   Maine       Deering       49
 17   N Hampshire Phillips Exe  48
 14   W Virginia  Morgantown    59
 12   Alaska      -              -
  9   S Dakota    Yankton       58
  8   Vermont     -              -
Number of teams in each state
California North has 428 teams and 8 regionals.
Most of the strong teams are in the Santa Clara regional.
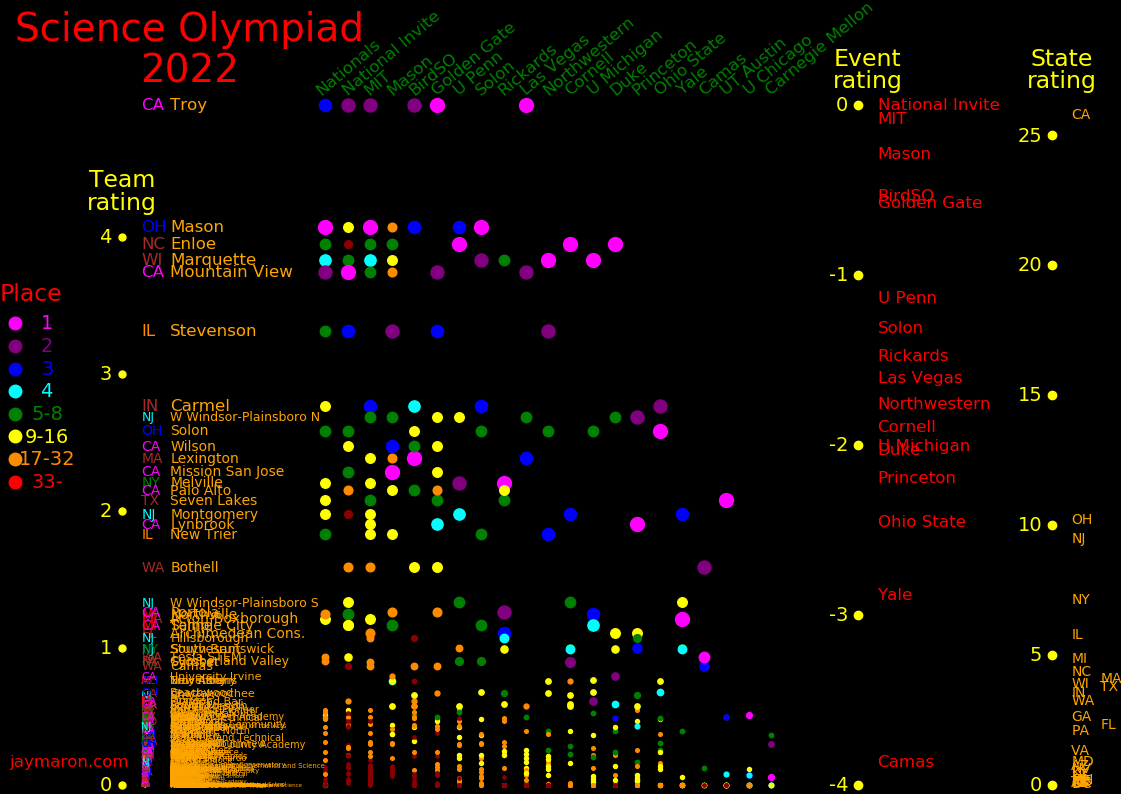
Ratings algorithms and the 2022 season
Rating invitationals by previous nationals results is simple.
A more complex rating uses feedback from regionals to rate regionals.
The algorithm rates regionals and teams simultaneously.
Discussion of the ratings algorithm
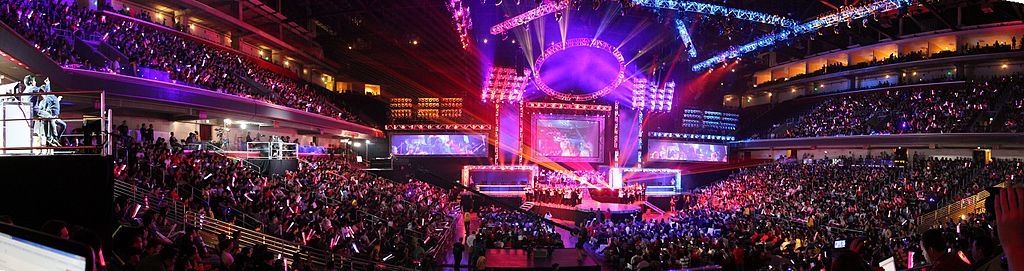
A League of Legends game can fill a stadium, and there is big prize money.
Robot events can involve a game that is fun to watch.
A team can have many robots, so that there can be diversity of robot design.
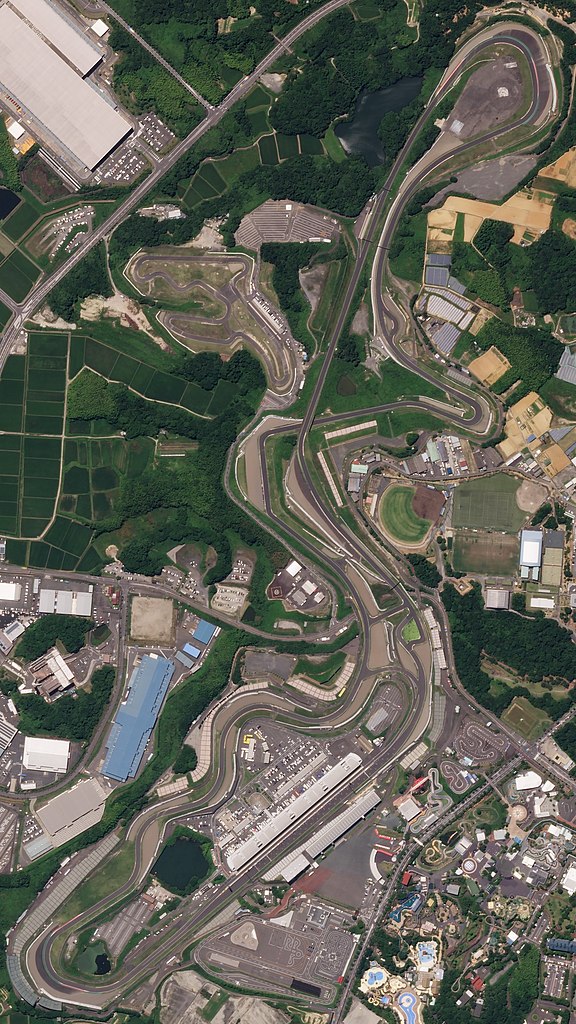
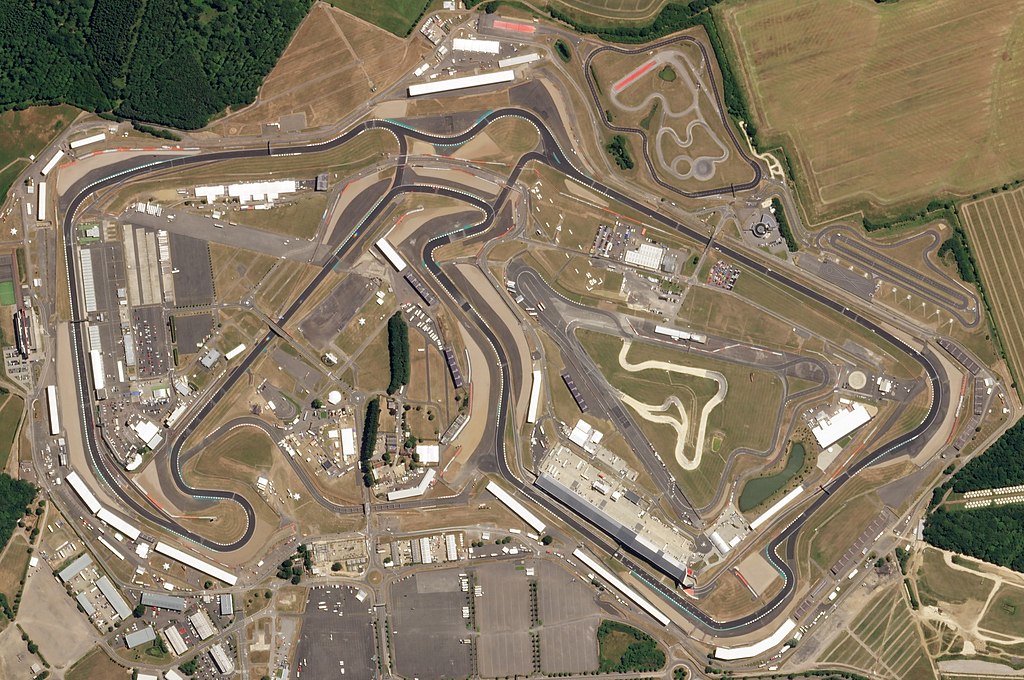
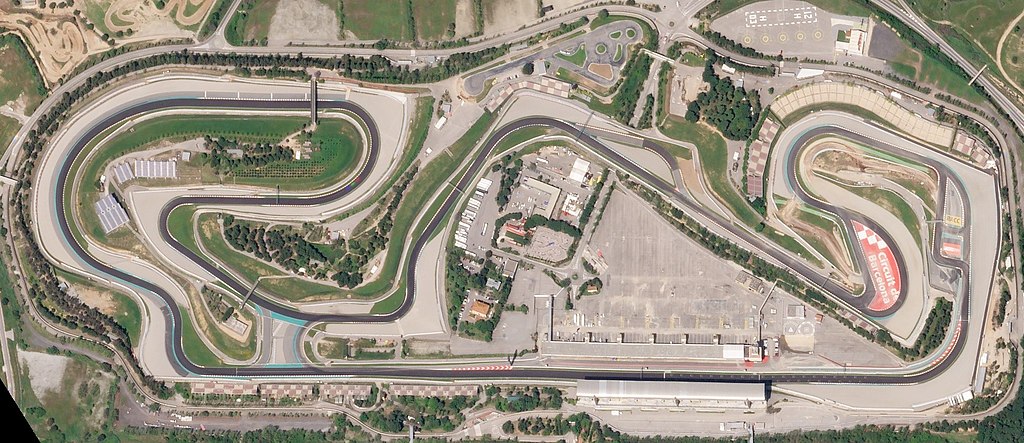
Each tournament can be unique, so that robot design has to be tuned to the tournament.
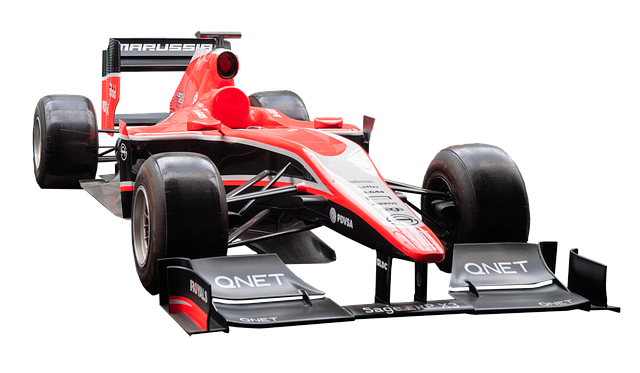
For example, each Formula-1 circuit is unique.
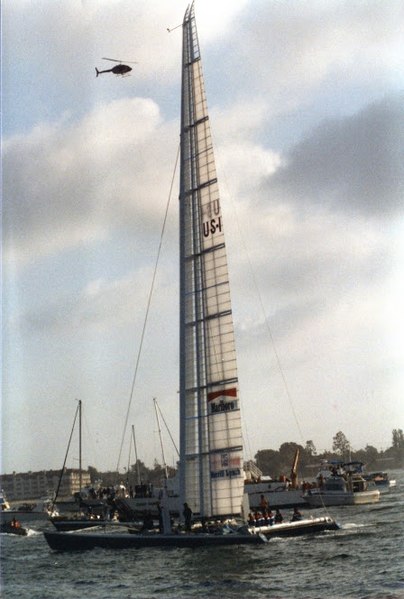
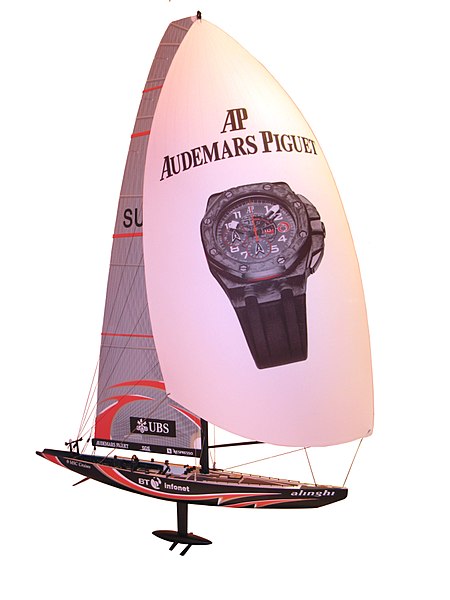
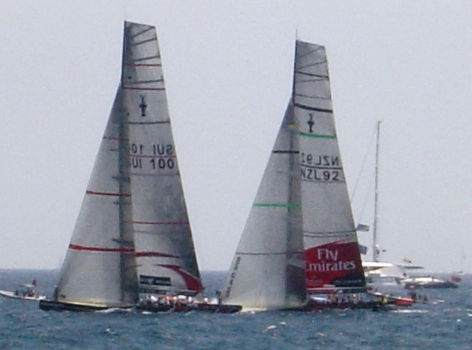
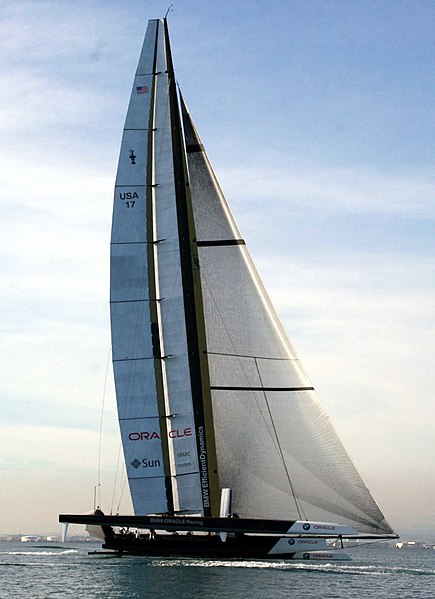
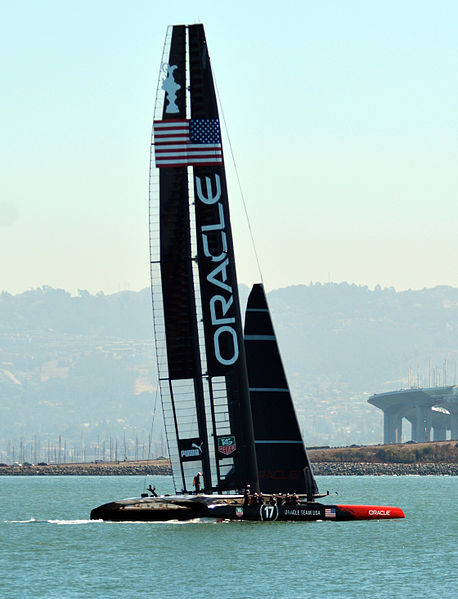
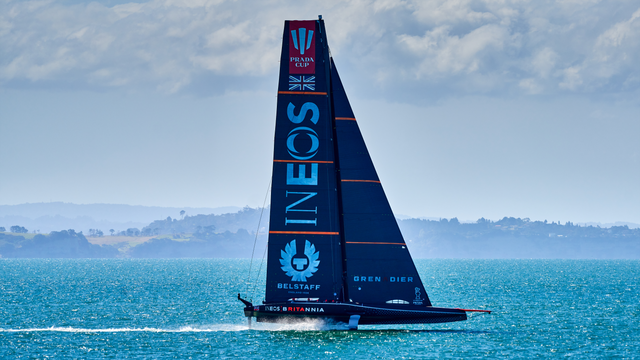
Formula-1 changes the formula each season, to prevent hyperoptimization. Many other sports do
so as well, such as America's Cup yacht racing.
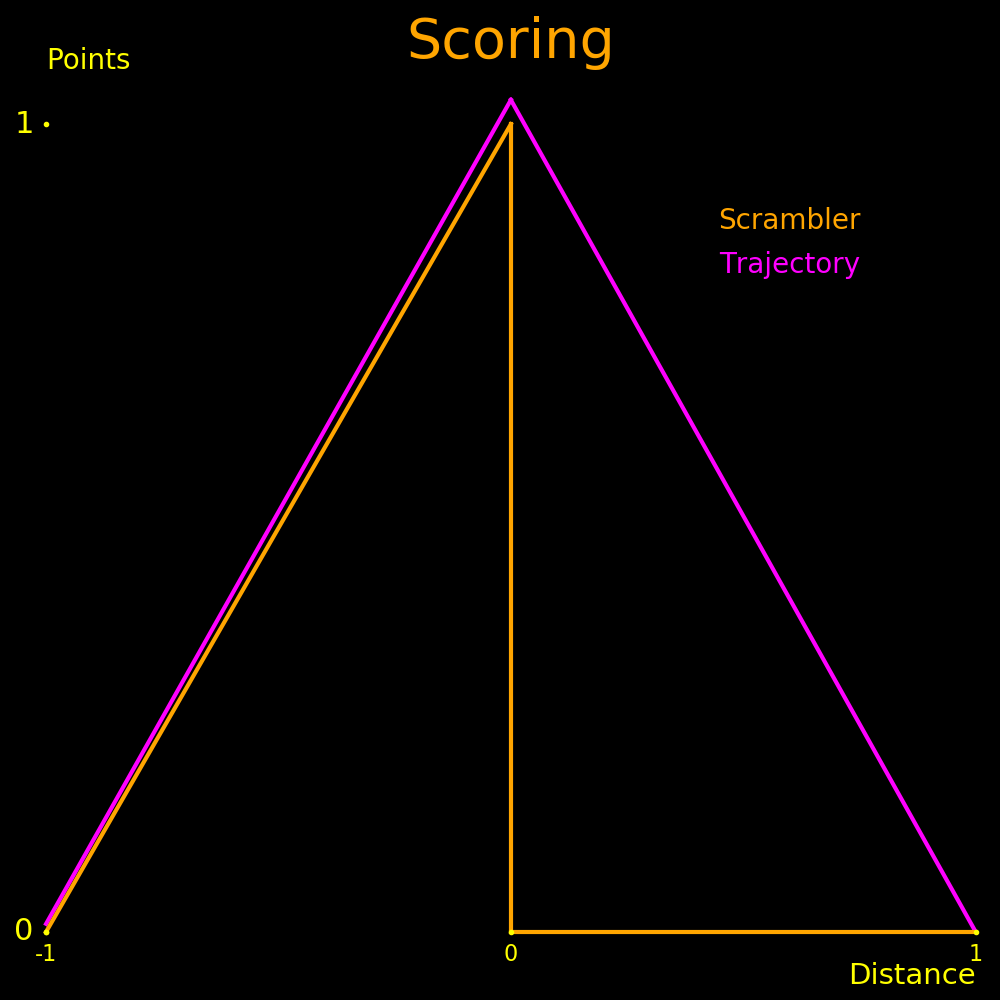
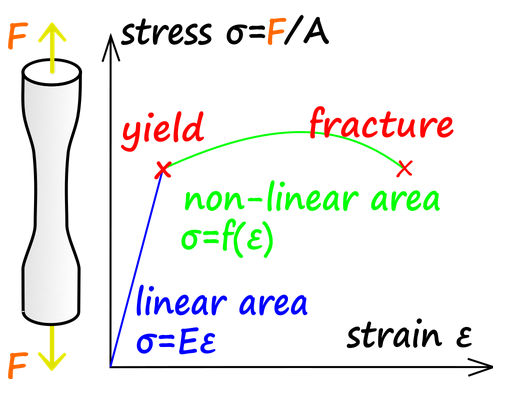
Scoring systems
In the "trajectory" event, you fire a projectile at a target, and the score
depends on how close the projectile got to the target.
In the "scrambler" event, you design a car to stop as close to a wall as possible without touching it.
The closer to the wall it stops, the higher the score. If it touches the wall, the score is zero.
The scrambler score function is a sawtooth function and the trajectory score function is a sharktooth
function. Scoring functions should be continuous.
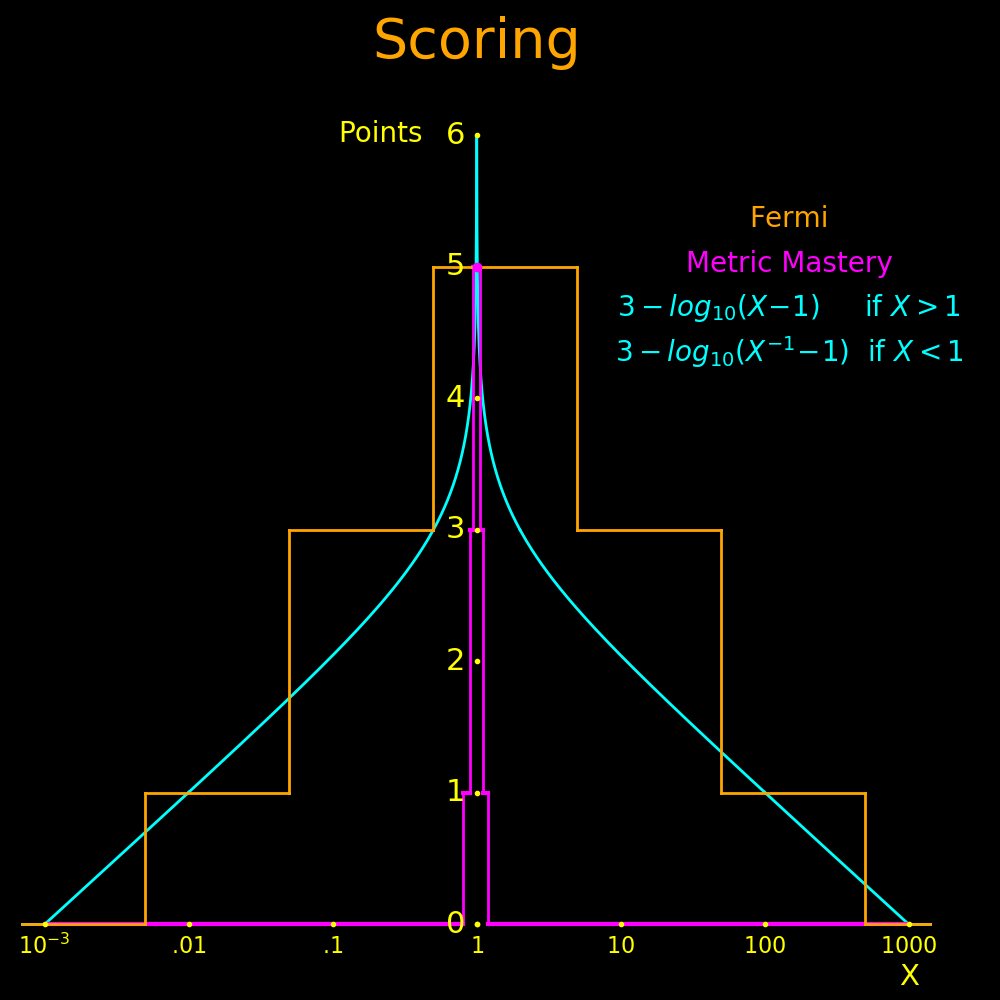
The scoring functions for Fermi Questions and Metric Mastery can be unified, enabling
the possibility of Fermi-style questions that have an accurate answer.
In the plot, the correct answer is "1" and the submitted answer is "X".
If X/x < 1, replace X/x with x/X.
Each problem has its own ceiling C and floor F.
If S > C, S is reset to C.
If S < F, S is reset to F.
The Fermi function is asymmetric logarithmically.
As it is, if X > 5 and X < 50, X is set to 10.
Caltech has a class on Fermi-style questions called "Order of Magnitude Physics", and the
techniques can usually calculate things to better than 20% accuracy.
Academic Contests
Dr. Jay Maron
Robot soccer
Build a team of remote-control robots to play soccer. The robots will push a
ball around. The robots may have moving parts, but they're not allowed
to carry the ball.
Robots are allowed to ram each other.
A team may have at most 6 robots. The total mass of the robots must be less than 1 kg.
You may equip any robot with flight.
The ball is a beach ball with a diameter of 30 cm and a mass of 15 grams.
The field is the size of a half-size basketball court. Goals are 3 meters wide and .5
meters high. The boundary extends vertically to the gym ceiling.
If the ball goes out of bounds, the team that didn't touch it last gets a free kick from outside the
boundary, from any point behind where the ball went out of bounds.
There is no special "goalie" status for robots.
A game is 15 minutes.
Robot construction is governed by the robot rules.
Robot derby
Build a team of remote-control robots to race a racecourse. You are racing against another team 1-on-1.
You may have up to 6 cars, and the total mass must be less than 1 kg.
Your score is the number of laps completed by your top 3 cars.
Cars may ram each other.
Flight is disallowed.
The race lasts 15 minutes.
Parts of the course are on-road and parts are off-road. The racecourse is unique to each venue.
Robot construction is governed by the robot rules.
Robot rally
Build a remote-control robot to race a racecourse. You are racing all teams at
once, like a Formula-1 race. You may have 3 cars in the race.
Ramming is allowed.
The race lasts 15 minutes, and the time for one lap is around 30 seconds.
Flight is disallowed.
Parts of the course are on-road and parts are off-road.
The racecourse is unique to each venue.
A photograph of the racecourse will be provided at least 1 week prior to the race.
The car mass has a maximum of 30 grams.
The car can have moving parts. For example, it can have a wing with a variable angle of attack.
Robot construction is governed by the robot rules.
Robot golf
Design a robot to play golf. The ball is a whiffleball the size of a golf ball. The game features
both fairway shots and putts.
The robot must be able to move to the ball.
No caddy or golf bag allowed. The robot has be one connected object.
The robot can have moving parts. Whatever is being used as a golf club can have moving parts. The golf club
face can have a variable angle of attack.
The course will feature crooked fairways. Spin will be essential.
Robot construction is governed by the robot rules.
Robot rules
For structural material, you may use wood, glue, cotton, rubber, and lubricant.
No metal, carbon fiber, or plastic allowed. This applies to the chassis,
wheels, wings, and propellers.
Cotten may be used for cable, sails, wings, or any other purpose.
Gears and axels may be metal.
Metal may be used for electric components such as motors,
batteries, capacitors, wires, and tranceivers.
For power sources, you may use batteries and capacitors.
No commercial kits are allowed. You have to build everything yourself from raw materials.
You must carve the wood yourself.
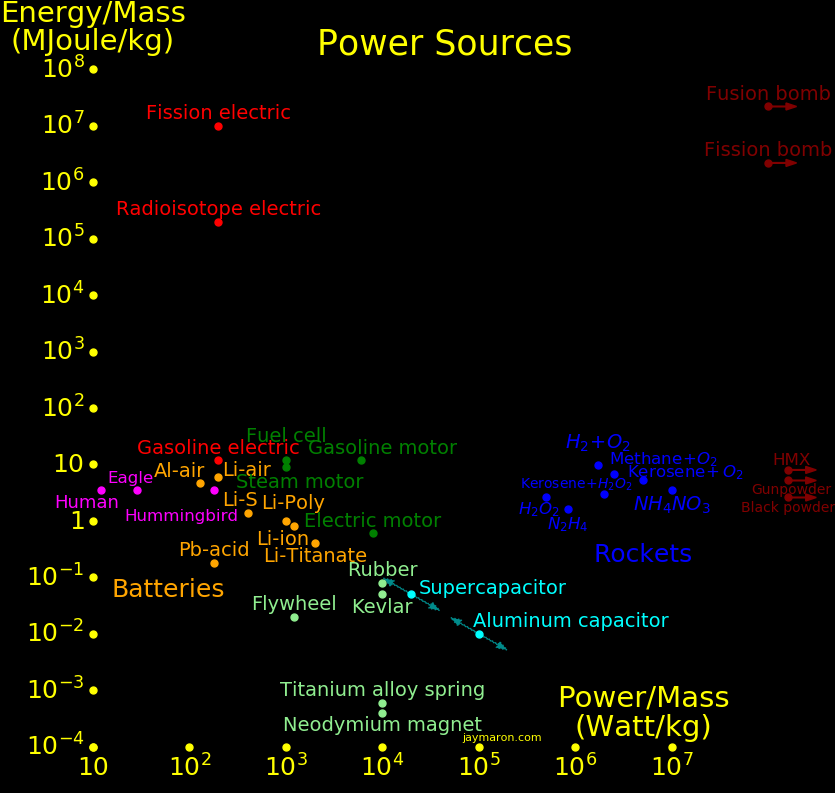
Power sources:
                 Energy/Mass   Power/Mass
                  MJoule/kg     kWatt/kg

Battery, LiPo           .55       1.4     Rechargeable
Battery, Aluminum air  4.6         .2     Not rechargeable
Battery, Formula-E      .78        .8     The battery in a Formula-E racecar
Battery, NIO EP9        .51       1.54    The battery in a NIO EP9 racecar
Supercapacitor          .05      20
Rubber band             .008    100
Aluminum capacitor      .01     100
Gasoline motor         -          6
Electric motor         -          6
Propeller              -         15
Electric generator     -           .15
A capacitor and a rubber band can deliver big power, but only for a short time.
A battery can give 1.4 kWatts. A capacitor giving this much power lasts 7 seconds
and a rubber band lasts 6 seconds. For a race lasting longer than 10 seconds, use batteries.
Also, capacitors lose voltage and power during the race. Batteries do as well, but to a much
smaller extent.
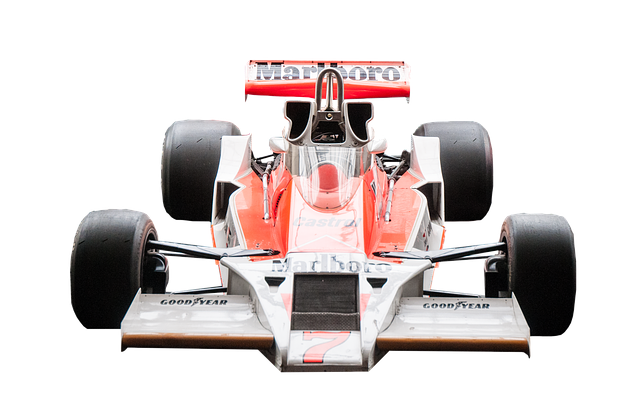
A Formula-1 car is ⅓ the mass of a mid-sized commercial car and can
take a lateral acceleration of 5g, A commercial car can take 1g.
Formula-1 cars achieve high lateral acceleration with high down acceleration.
Wings provide downforce.
To make for a thrilling engineering challenge, maximize the down acceleration
when the car is at top speed. The larger the down acceleration, the larger the
demand on structural engineering for the car.
Maximizing down acceleration means maximizing power/mass ratio, maximizing
cross-sectional area, and minimizing mass.
The rules should specify a maximum height and width for the car, and specify
a maximum mass for the battery. The car should be as large as possible, but small enough to
travel by commercial airplane.
We specify an example set of rules. For the car, the maximum width is 30 cm
and the maximum height is 15 cm. There is no maximum length. The maximum
battery mass is .008 kg. With these parameters, the maximum speed is 8
meters/second and the down acceleration is 40 g.
Battery energy/mass is independent of mass.
Battery power/mass increases as mass decreases, suggesting that cooling matters. A racecar
will likely have active cooling for the battery.
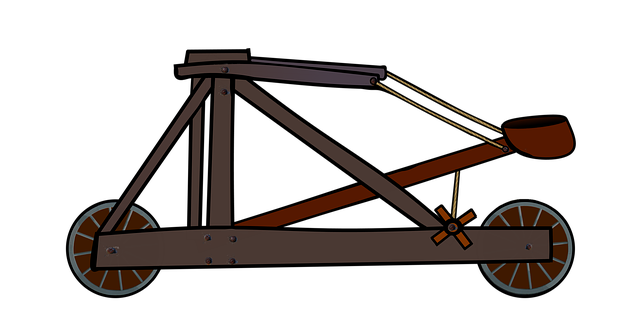
A catapult unifies strength and accuracy. The contest can have two parts:
An accuracy part and a distance part.
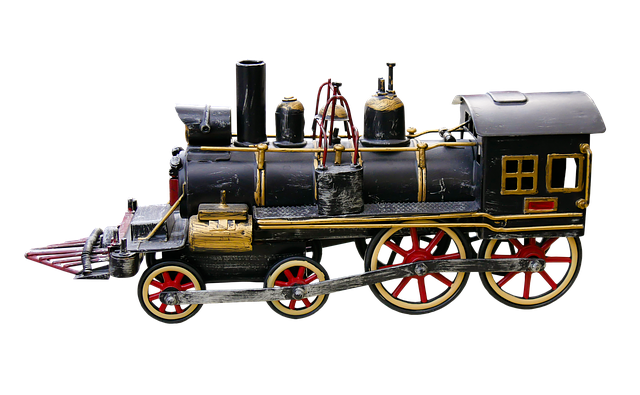
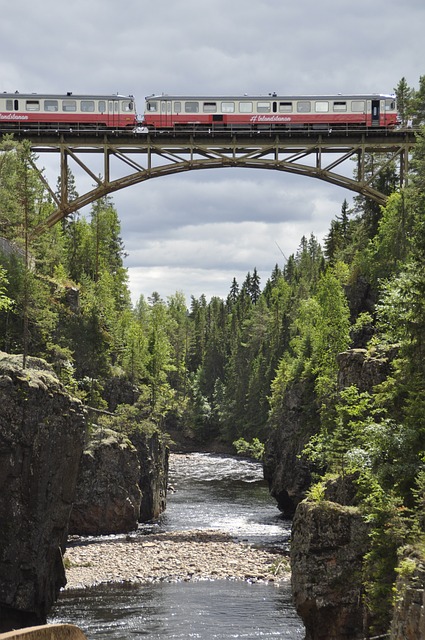
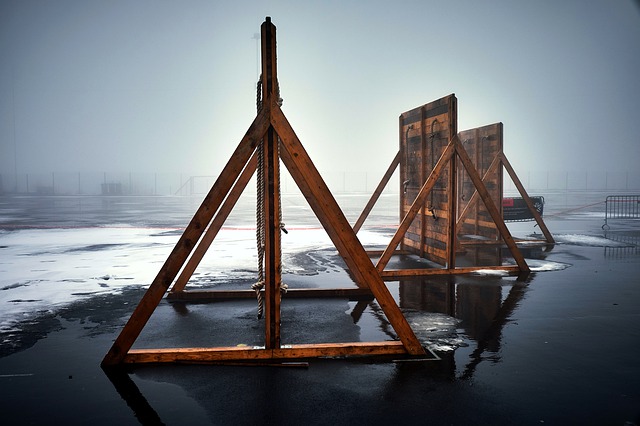
Build a bridge to span a 40 cm gap. A train car will drive across the bridge. If the bridge survives,
the train mass is increased and the train makes another pass. The train mass is increased until the
bridge fails.
The score is the mass of the train at failure divided by the mass of the bridge.
The maximum bridge mass is 8 grams. The maximum mass that the train can have is 20 kg. You can't get
credit for supporting more than 20 kg.
The bridge doesn't have to include the train rails. The testing rig will have train rails that will
be laid across the bridge. The bridge must contain a bed to support the rails.
The rails will have a breakaway design so that they can be easily reassembled.
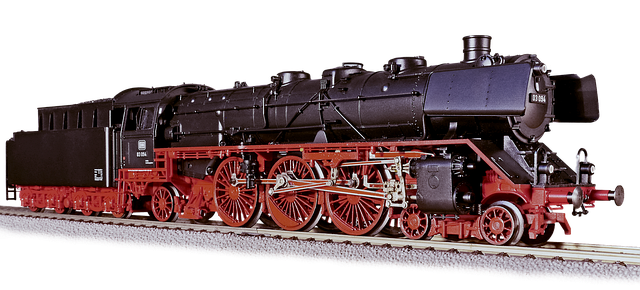
The rails will be for a standard electric model train, 16.5 mm apart. The train width and height are
both 4 cm. There will be one train car, which will have 2 axels that are 17 cm apart.
The bridge will be placed on test supports, and the train track will be at the
level of the test supports. While the train crosses the bridge, the rails may
go no higher than 1 cm above the supports and no lower than 2 cm below the
supports. This includes when the bridge is loaded with the train.
The bridge may have unlimited height, length, and width. The bridge may extend as much as 10 cm below the
test support.
Tower building
Build a tower to support a weight that is 30 cm above the ground. The tower
will be weighted until it collapses, and the score of the tower is:
If the weight sags below 30 cm, the tower is regarded to have collapsed.
You may use any wood and any glue. The wood can be in any shape. You can carve the wood.
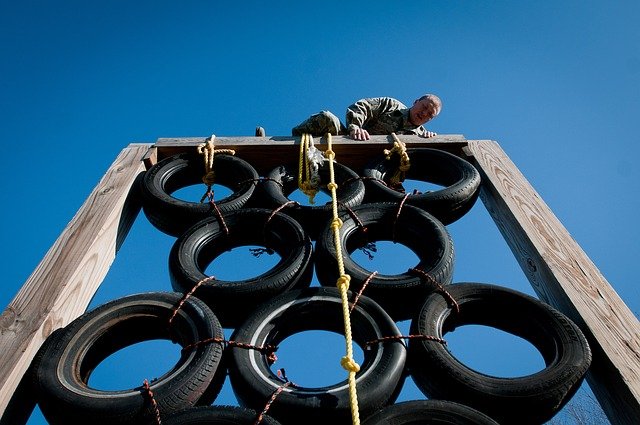
Competitors will navigate an obstacle course and then take a science test.
There is zero rest time between the obstacle course and the science test.
The obstacle course is legit hard.
The science test is timed and lasts 10 minutes. There will be way more questions than there
will be time to answer. Speed will be a factor.
For scoring, contestants will be ranked by their time in the obstacle course
and given points according to the table below. Also, competitors will be ranked
by their performance on the science test and given points accourding to the
table. The total score is the sum of the obstacle score and the science score.
Ties are broken by placement in the obstacle course.
A team consists of 4 players. Questions are asked, and teams write their answer on a
touchpad.
The contest is televised, and viewers can see what's written on the touchpads.
Current scores are displayed.
Tackle the hard problems
A contest should encourage contestants to tackle the hard problems, and this can be
done by weighting problems by difficulty.
You only know how hard a problem is after the contest.
N is a parameter that depends on the number of competitors.
A natural choice is
If a contest has 64 competitors, then if more than 48 people solve a problem, no points are awarded.
The algorithm is convergence style. Ratings are initialized at zero for each team.
Game results are a set of forces on each team's rating. The ratings are adjusted
according to the forces.
The forces depend on rating. After the adjustment, the forces change.
Repeat the cycle until convergence.
Let L be the difference in rating between a player and his opponent.
If the player has a higher rating, L is positive. If the player wins, the
force function for that game is:
The force function is constant for |L| > 2. It doesn't give
excessive weight to upsets.
The force function is rigged so that for L=1, the probability of the stronger player to
win is 3/4.
A team's rating is calculated from its scores from events (event =
tournament). For each event, a team has a rank, and the score is:
The score has a floor. If the score is less than zero, it's set to zero.
A team's overall score is the average of scores from their best 5 tournaments.
Terms in the sum have a floor of zero.
The team rating can be refined by including event rartings. An event rating is determined
by the sum of the strengths of the teams participating.
Terms in the sum have a floor of zero.
T and E are interdependent. They can be separated with a convergence
algorithm. Initialize Ee=0 for all e and compute T. Use T to compute E. Repeat until
convergence.
Ratings from invitationals correlate well with nationals results.
For each state, the table shows the number of teams with a rating larger than 1.
States of Death include California, Ohio, New Jersey, New York, Illinois, Michigan,
Wisconsin, Massachusetts, and Washington.


.jpg)