
|
|
|
|
|
|
|---|---|---|---|---|---|
 |
 |
 |
 |
 |
 |
|---|---|---|---|---|---|
 |
 |
 |
 |
|---|---|---|---|
 |
 |
 |
 |
|
|---|---|---|---|---|
 |
 |
 |
 |
|
|---|---|---|---|---|
 |
 |
|---|---|
 |
|---|
 |
|---|
 |
|---|
 |
|---|
 |
|---|
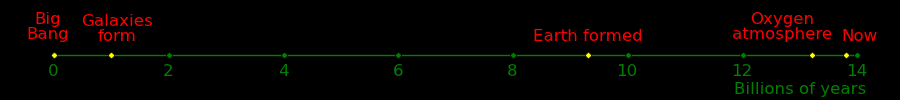
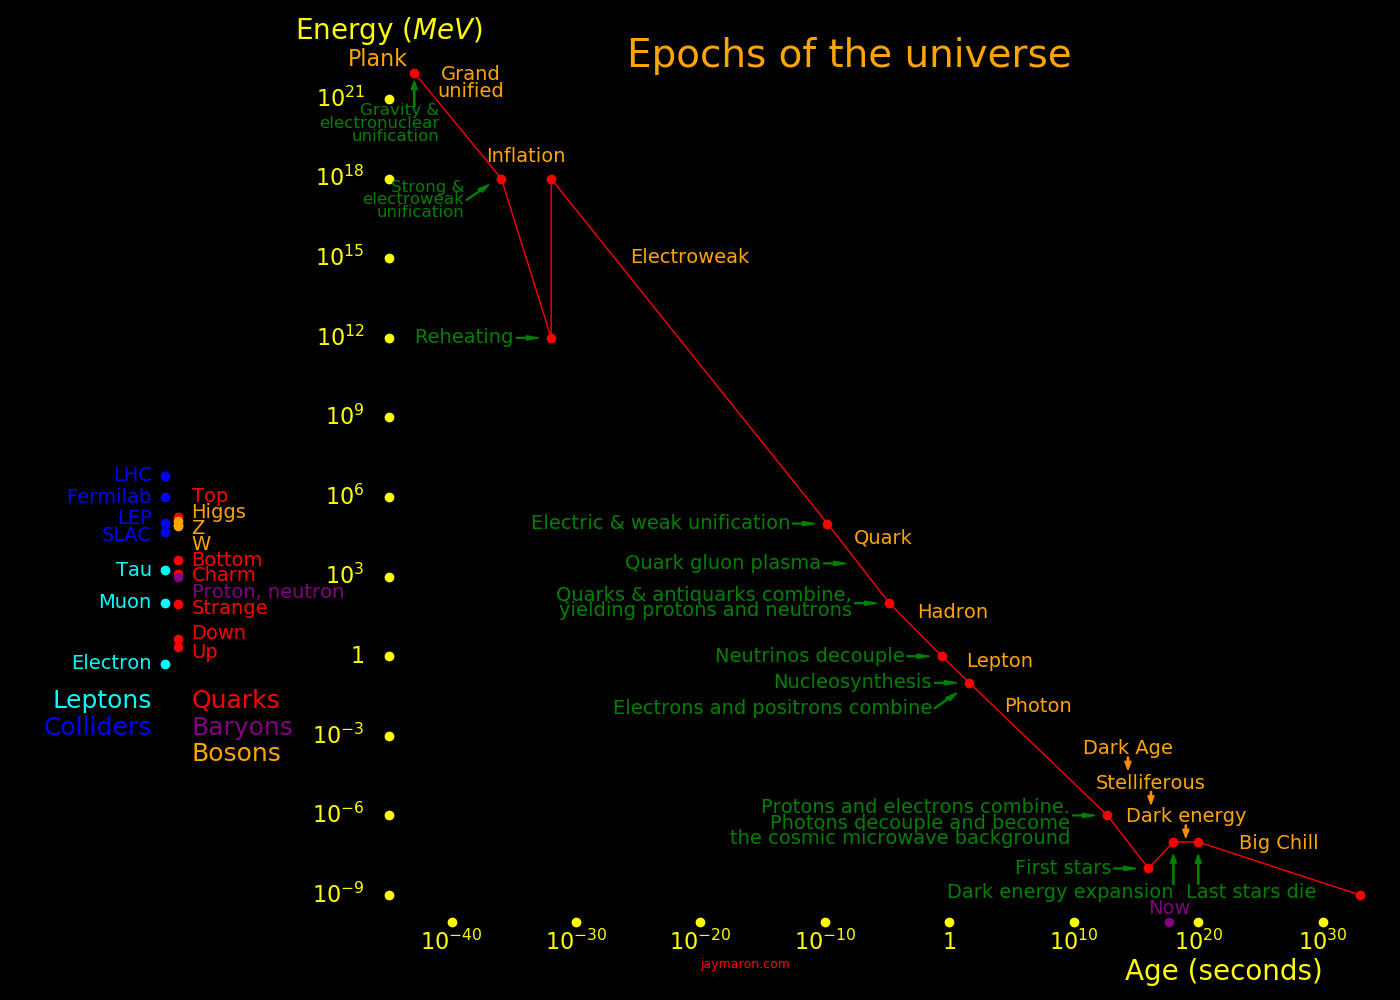
Continue to the rest of the "scales of the universe exhibit"
 |
|---|
 |
|---|
 |
|---|
 |
|---|
 |
|---|
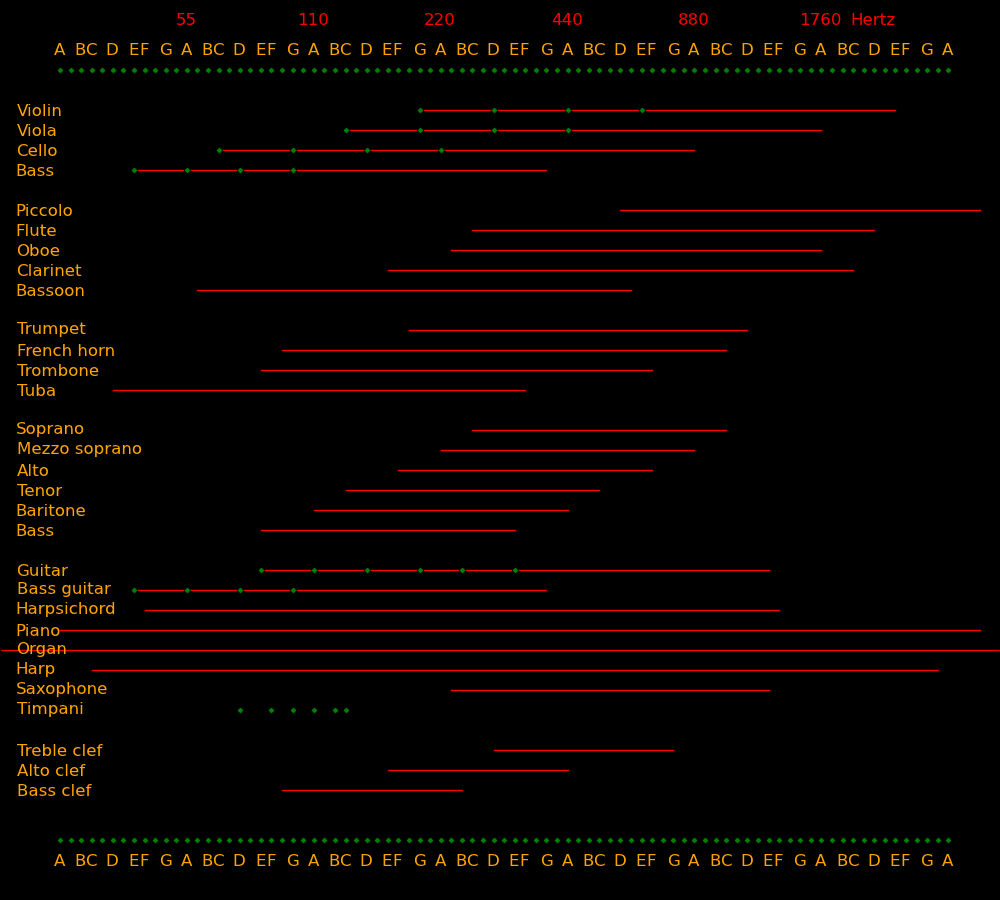
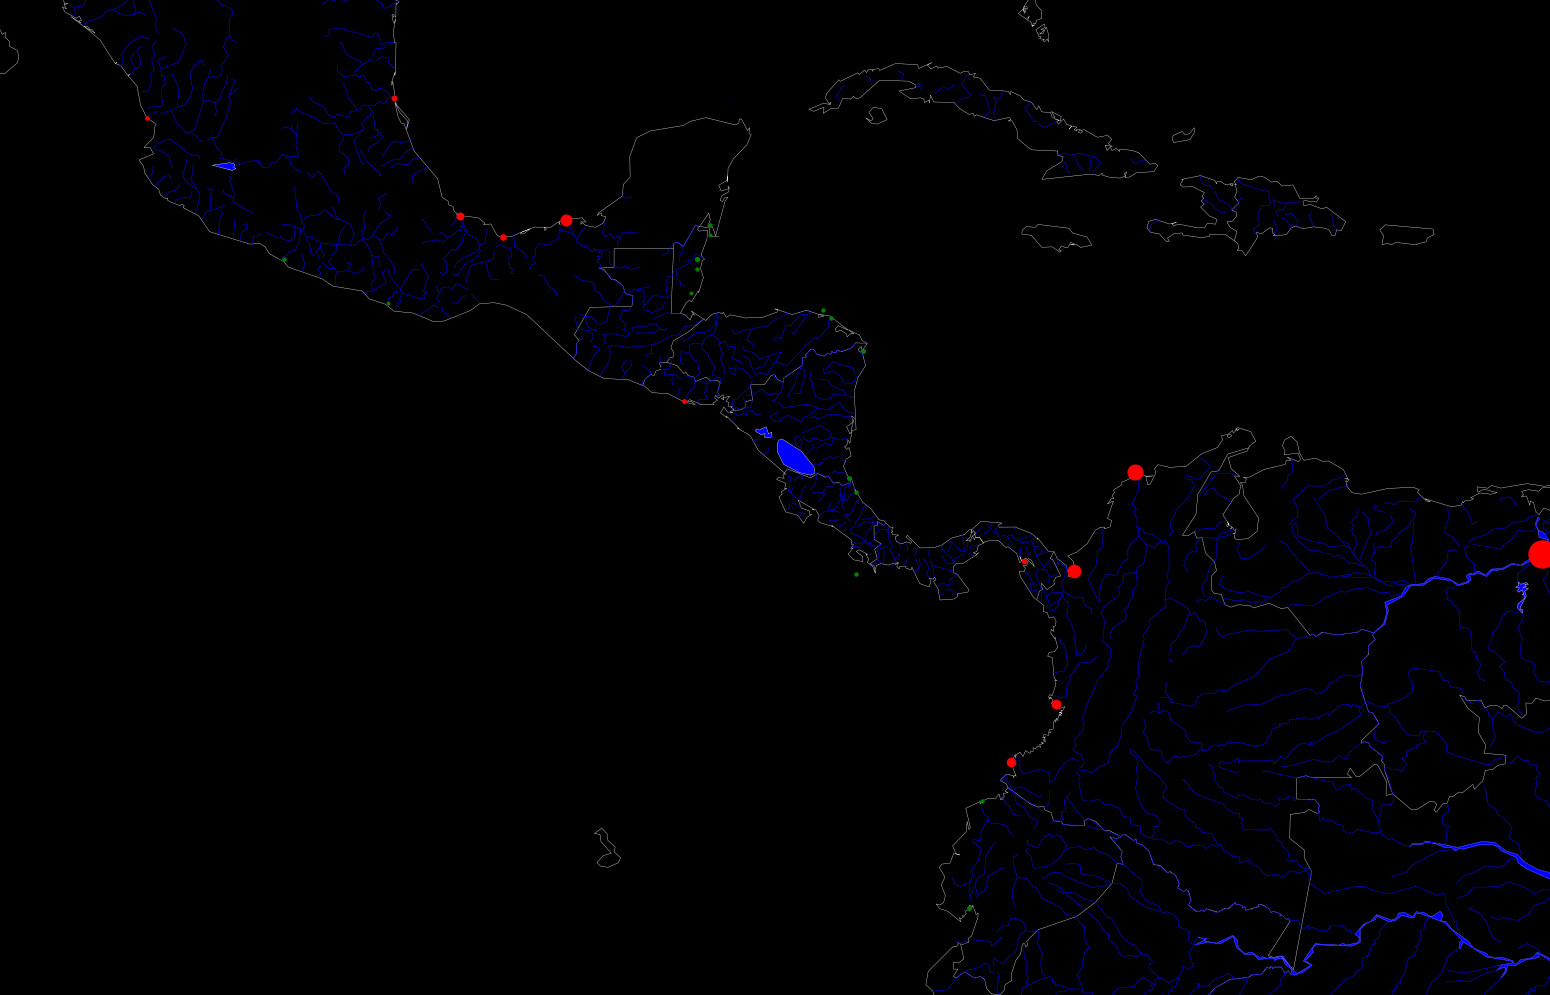
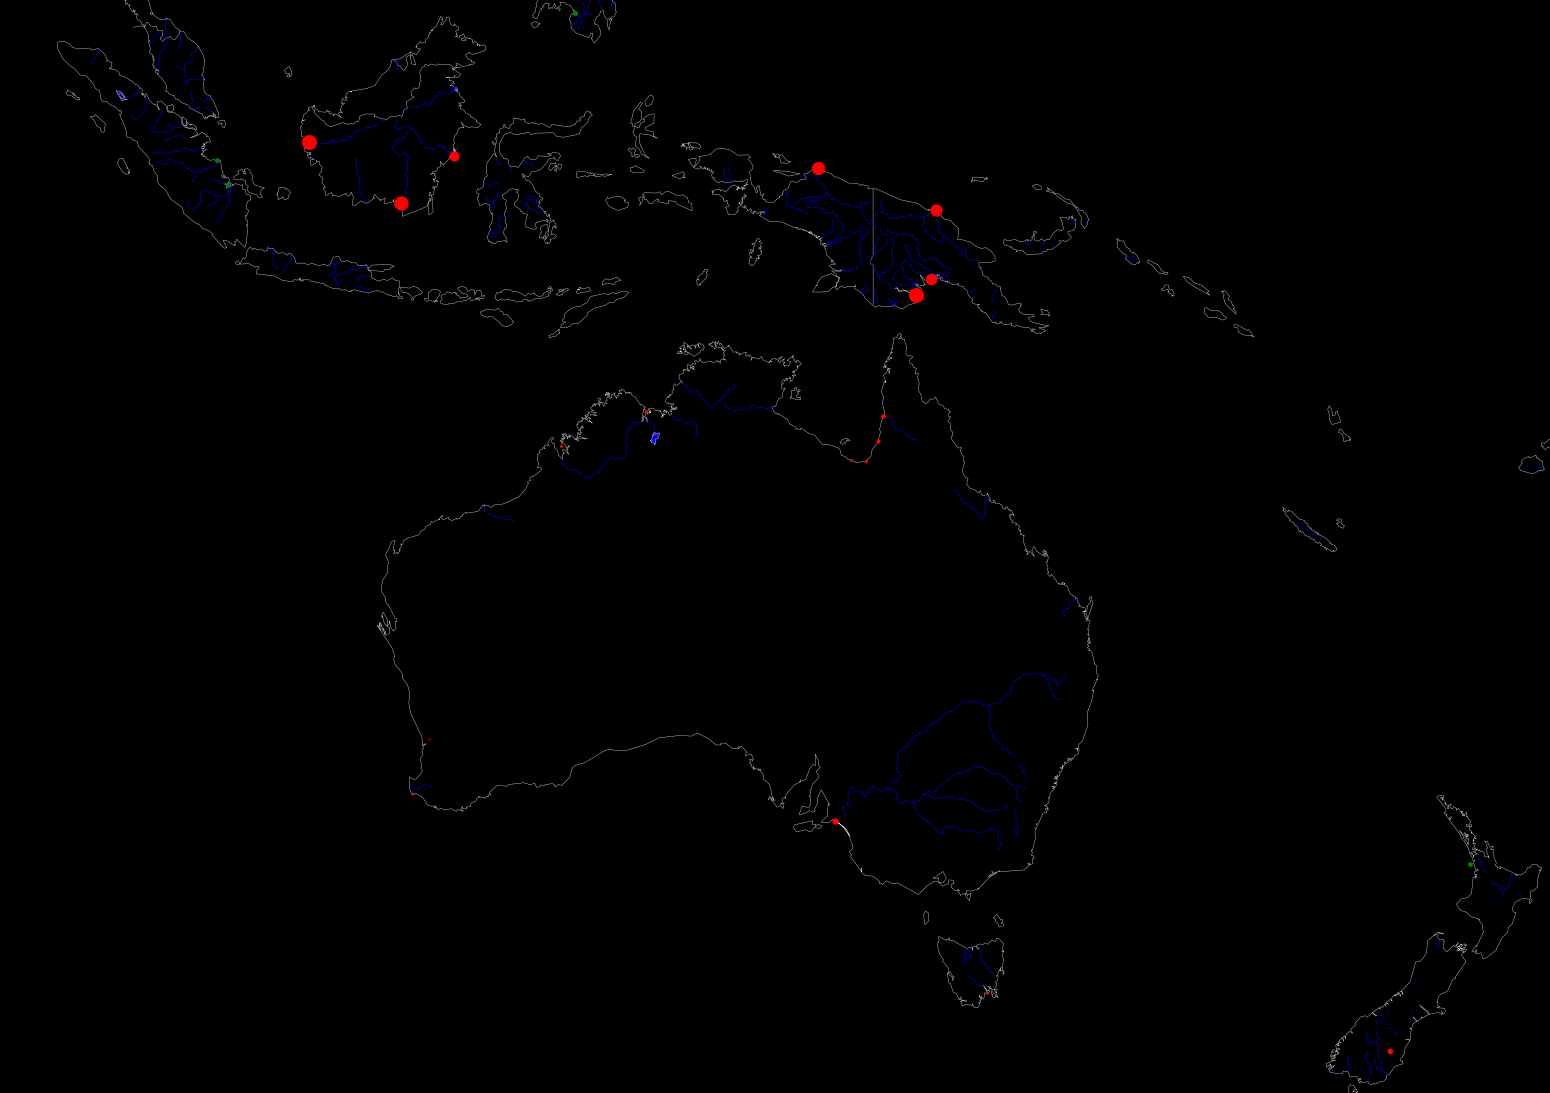
Green dots are open strings.
 |
|---|
 |
|---|
 |
|---|
 |
|---|
 |
|---|
 |
|---|
 |
|---|
 |
|---|
 |
|---|
 |
|---|
 |
|---|
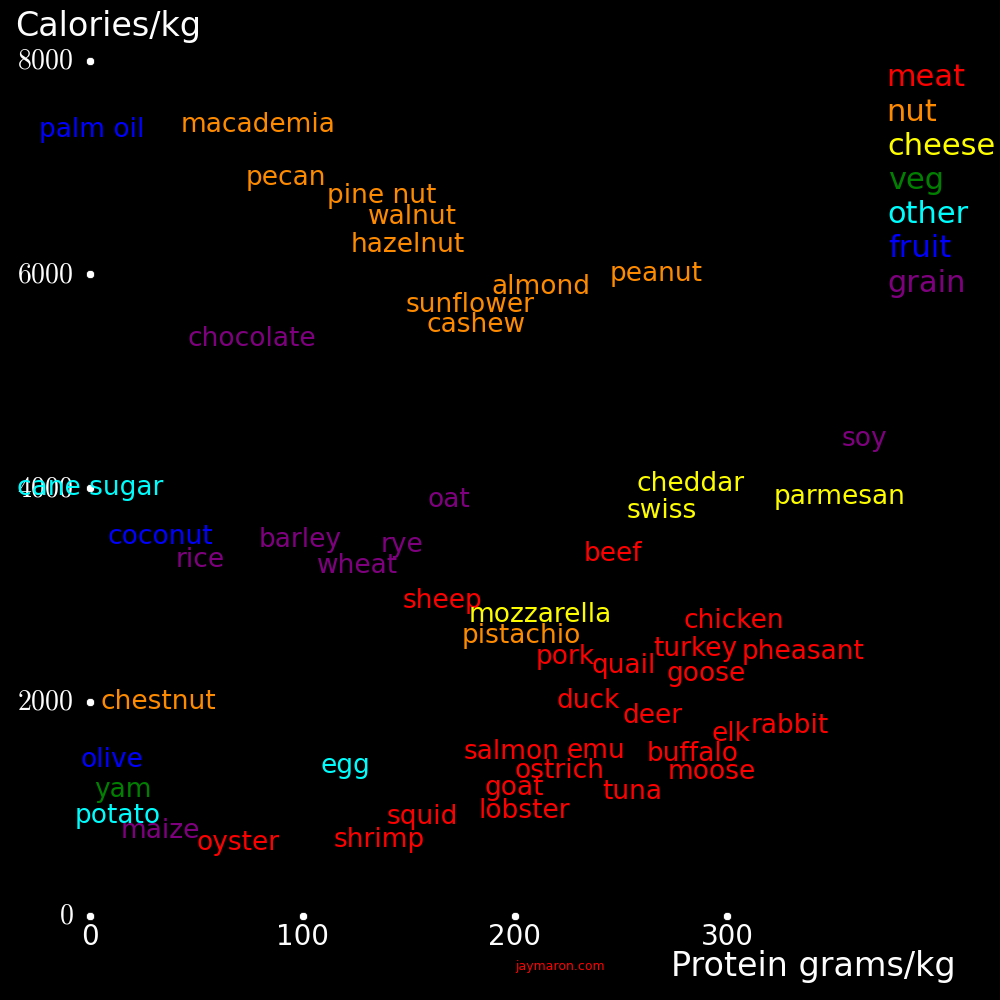
The left plot shows the protein and calorie content of food. Foods with high protein and low fat are in the lower right. Nuts are heavy in protein, especially peanuts.
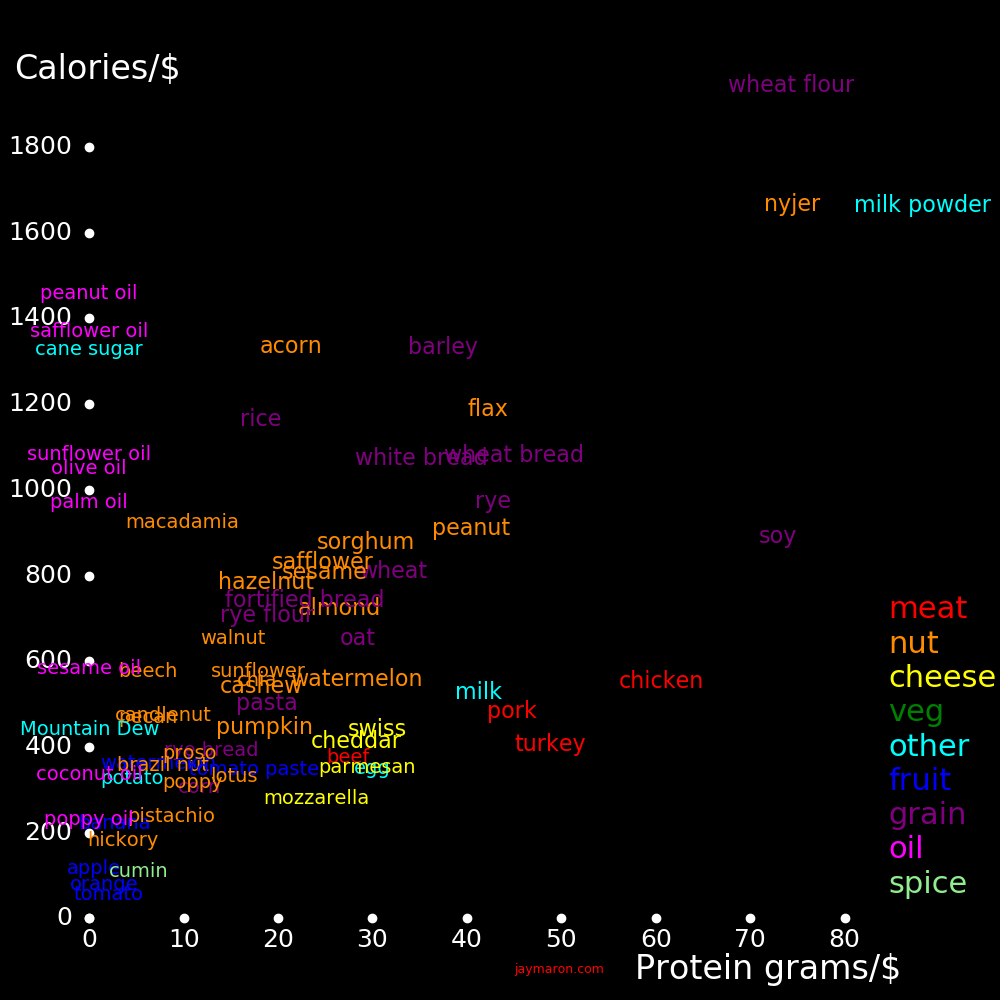
The right plot shows how much calories and protein you get per dollar. The cheapest meats are pork, chicken, and turkey.
 |
 |
|---|---|
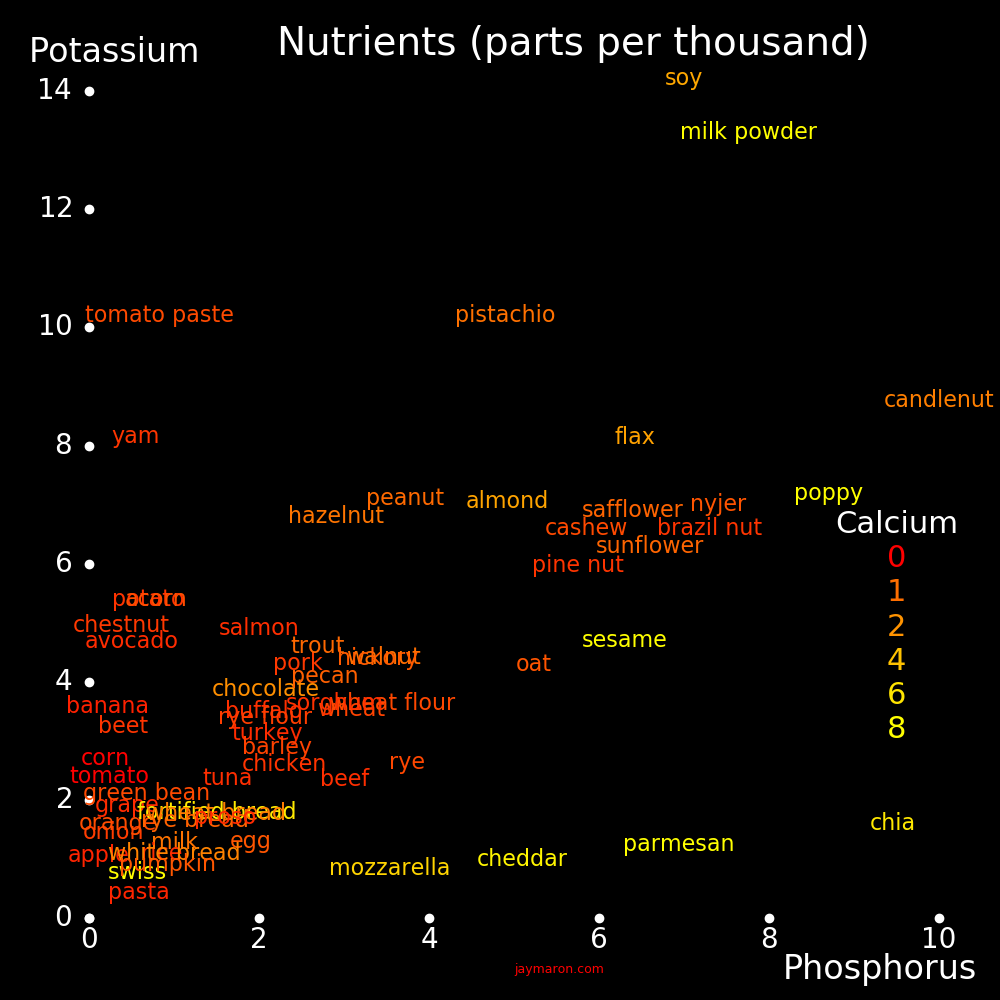
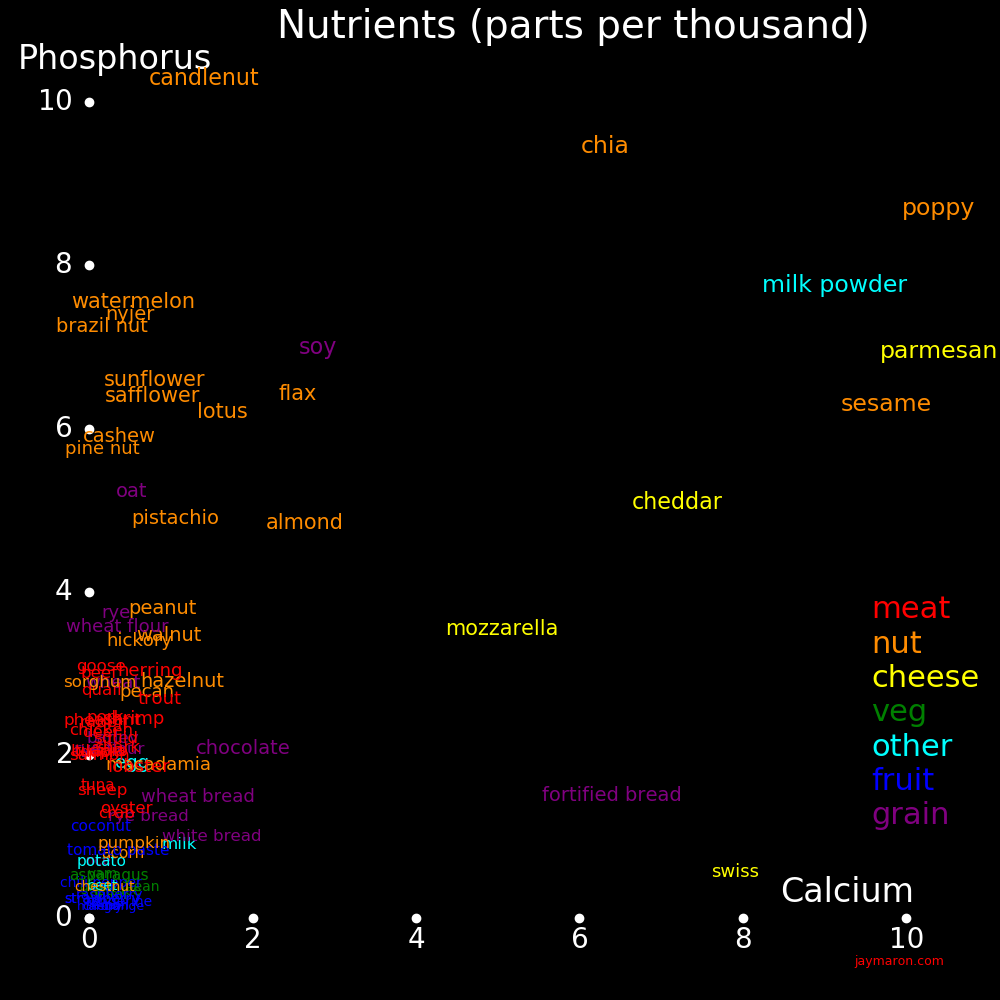
The plot shows the potassium, phosphorus, and calcium content of food. Calcium is abundant in cheese and milk and rare in other foods. Sesame is rich in calcium.
 |
|---|
 |
 |
|---|---|
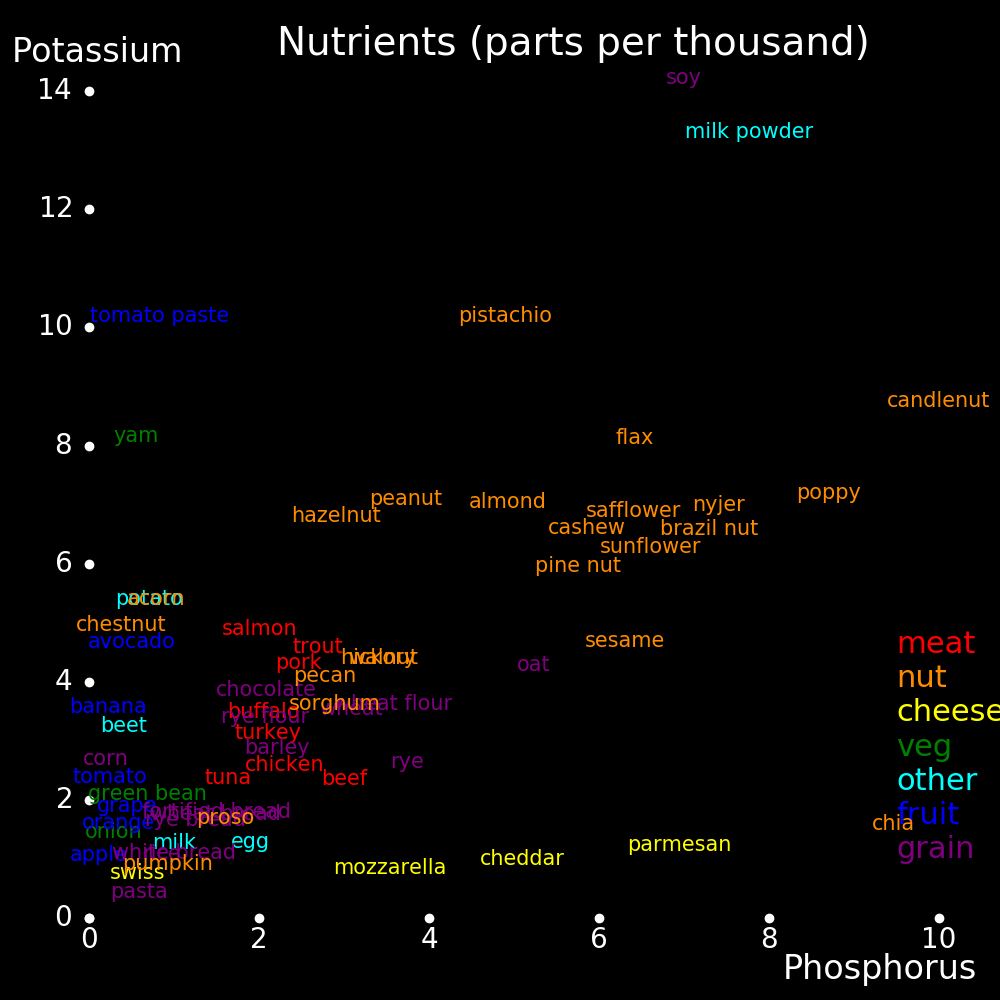
The plot shows the phosphorus and potassium content of food. Most nuts are rich in these elements.
 |
|---|
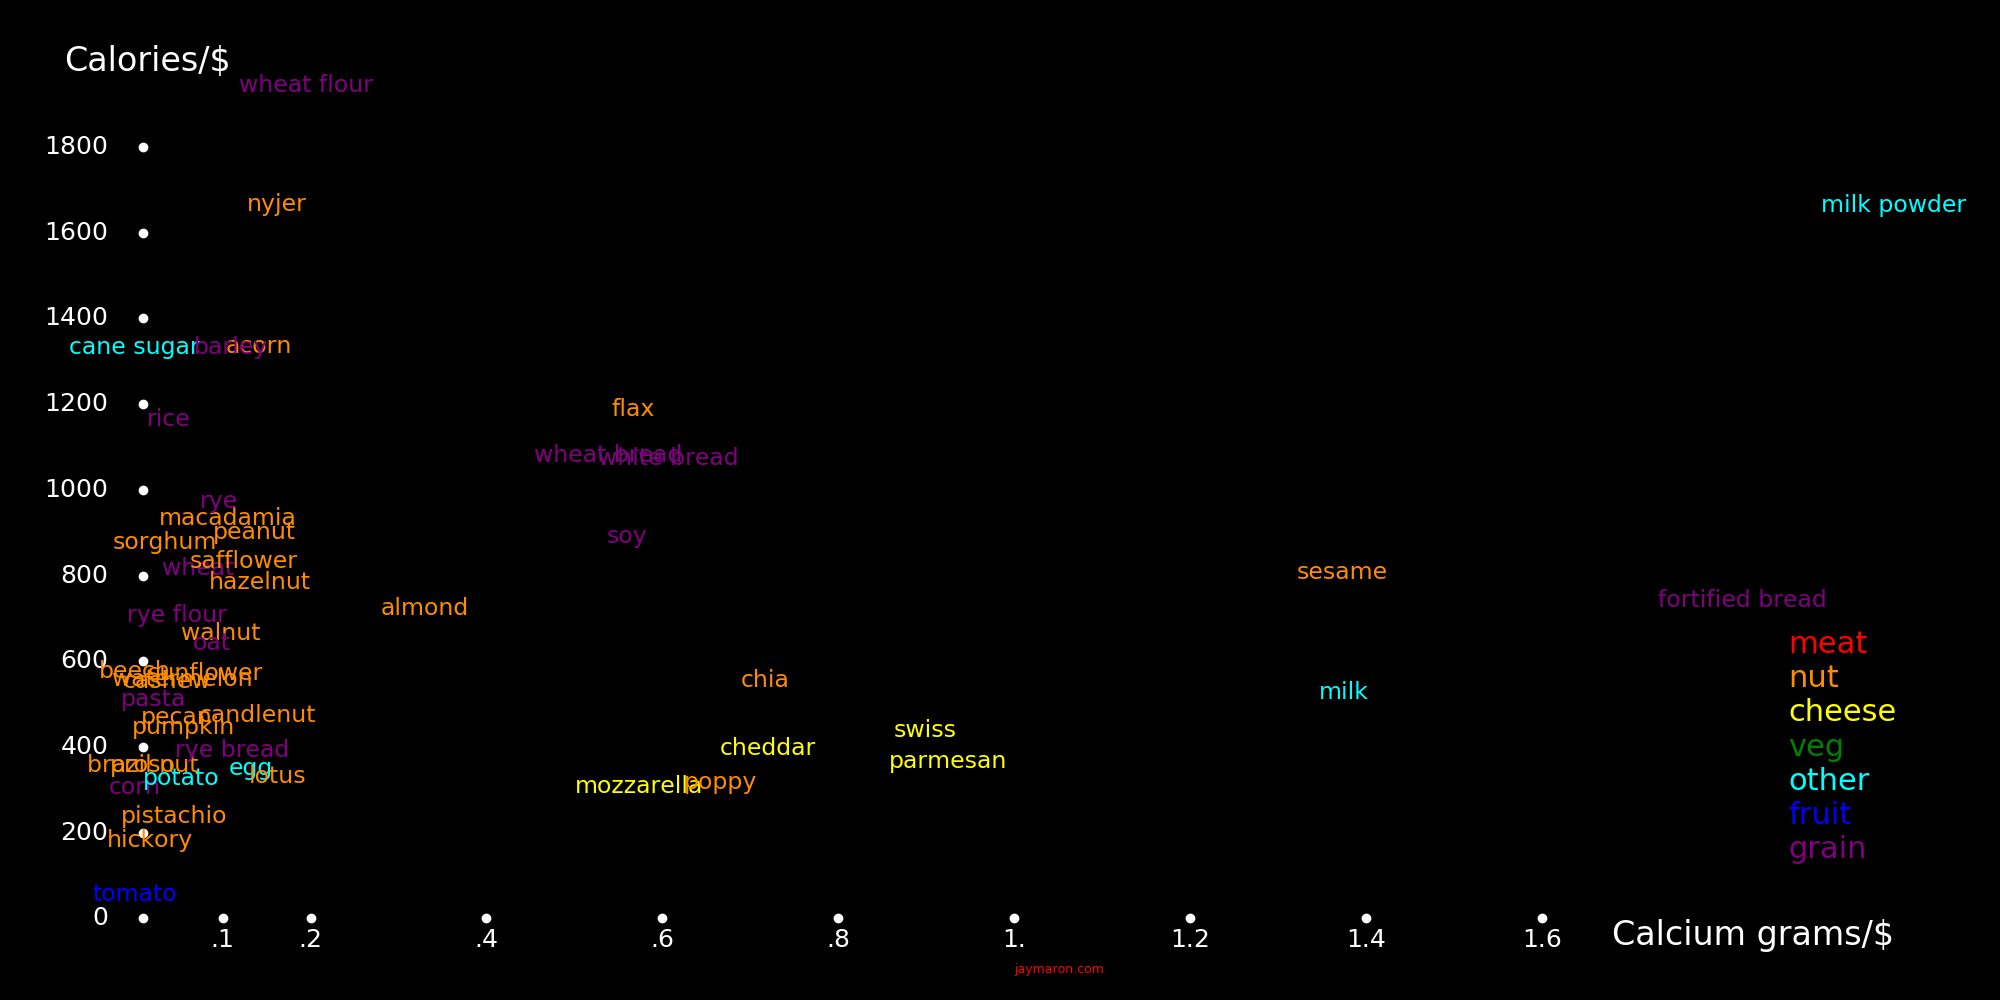
For bird seed, what matters is calories and calcium, and the best seeds are sesame and nyger.
 |
|---|
 |
|---|
 |
|---|
 |
|---|
 |
|---|
 |
|---|
 |
|---|
 |
|---|
Color is as your eye would see.
 |
|---|
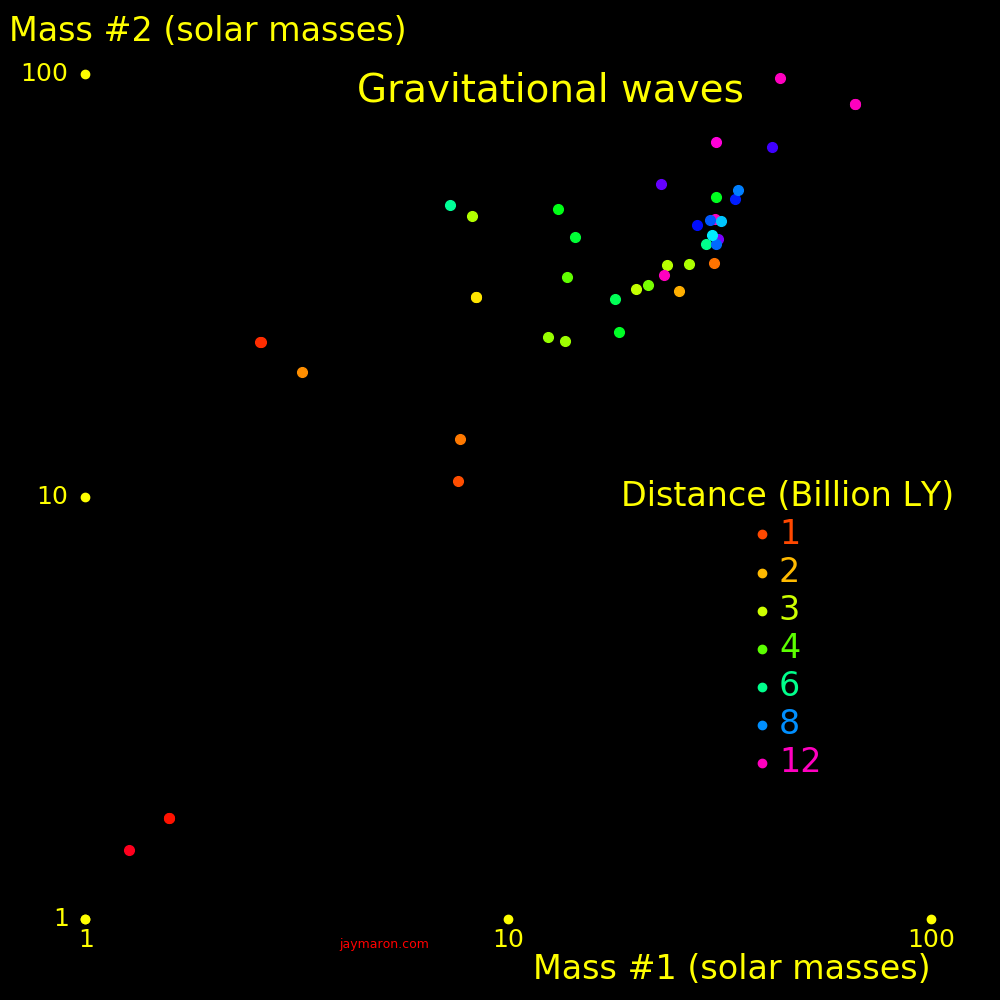
LIGO gravitational wave events.
 |
|---|
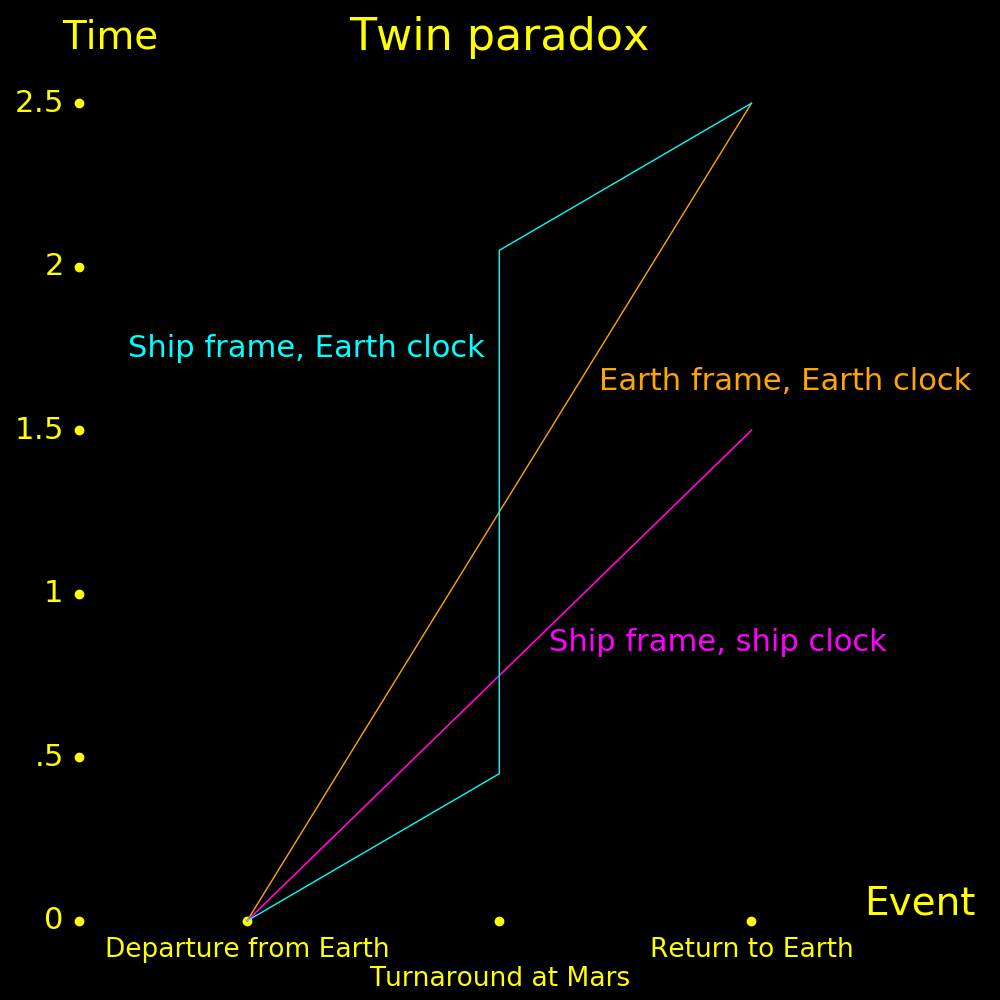
Twin paradox. Suppose a ship travels from Earth to Mars and back.
 |
|---|
 |
|---|
 |
|---|
 |
|---|
 |
|---|
 |
|---|
 |
|---|
 |
|---|
 |
|---|
 |
|---|
 |
|---|
 |
|---|
 |
|---|
 |
|---|
 |
|---|
 |
|---|
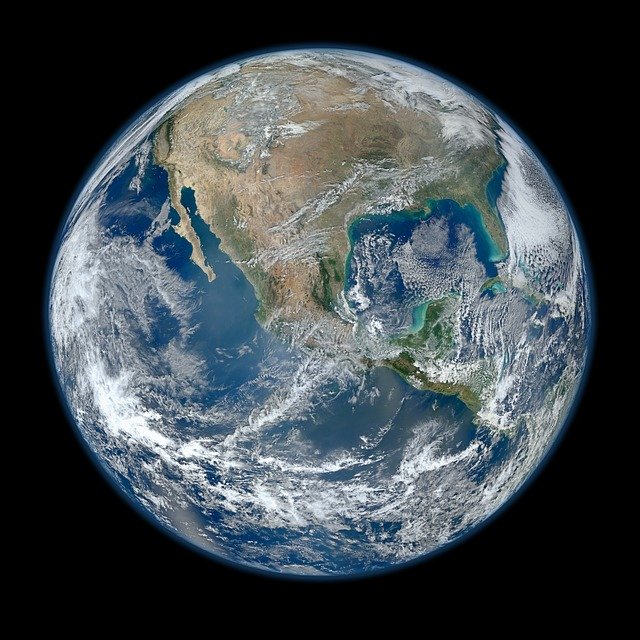
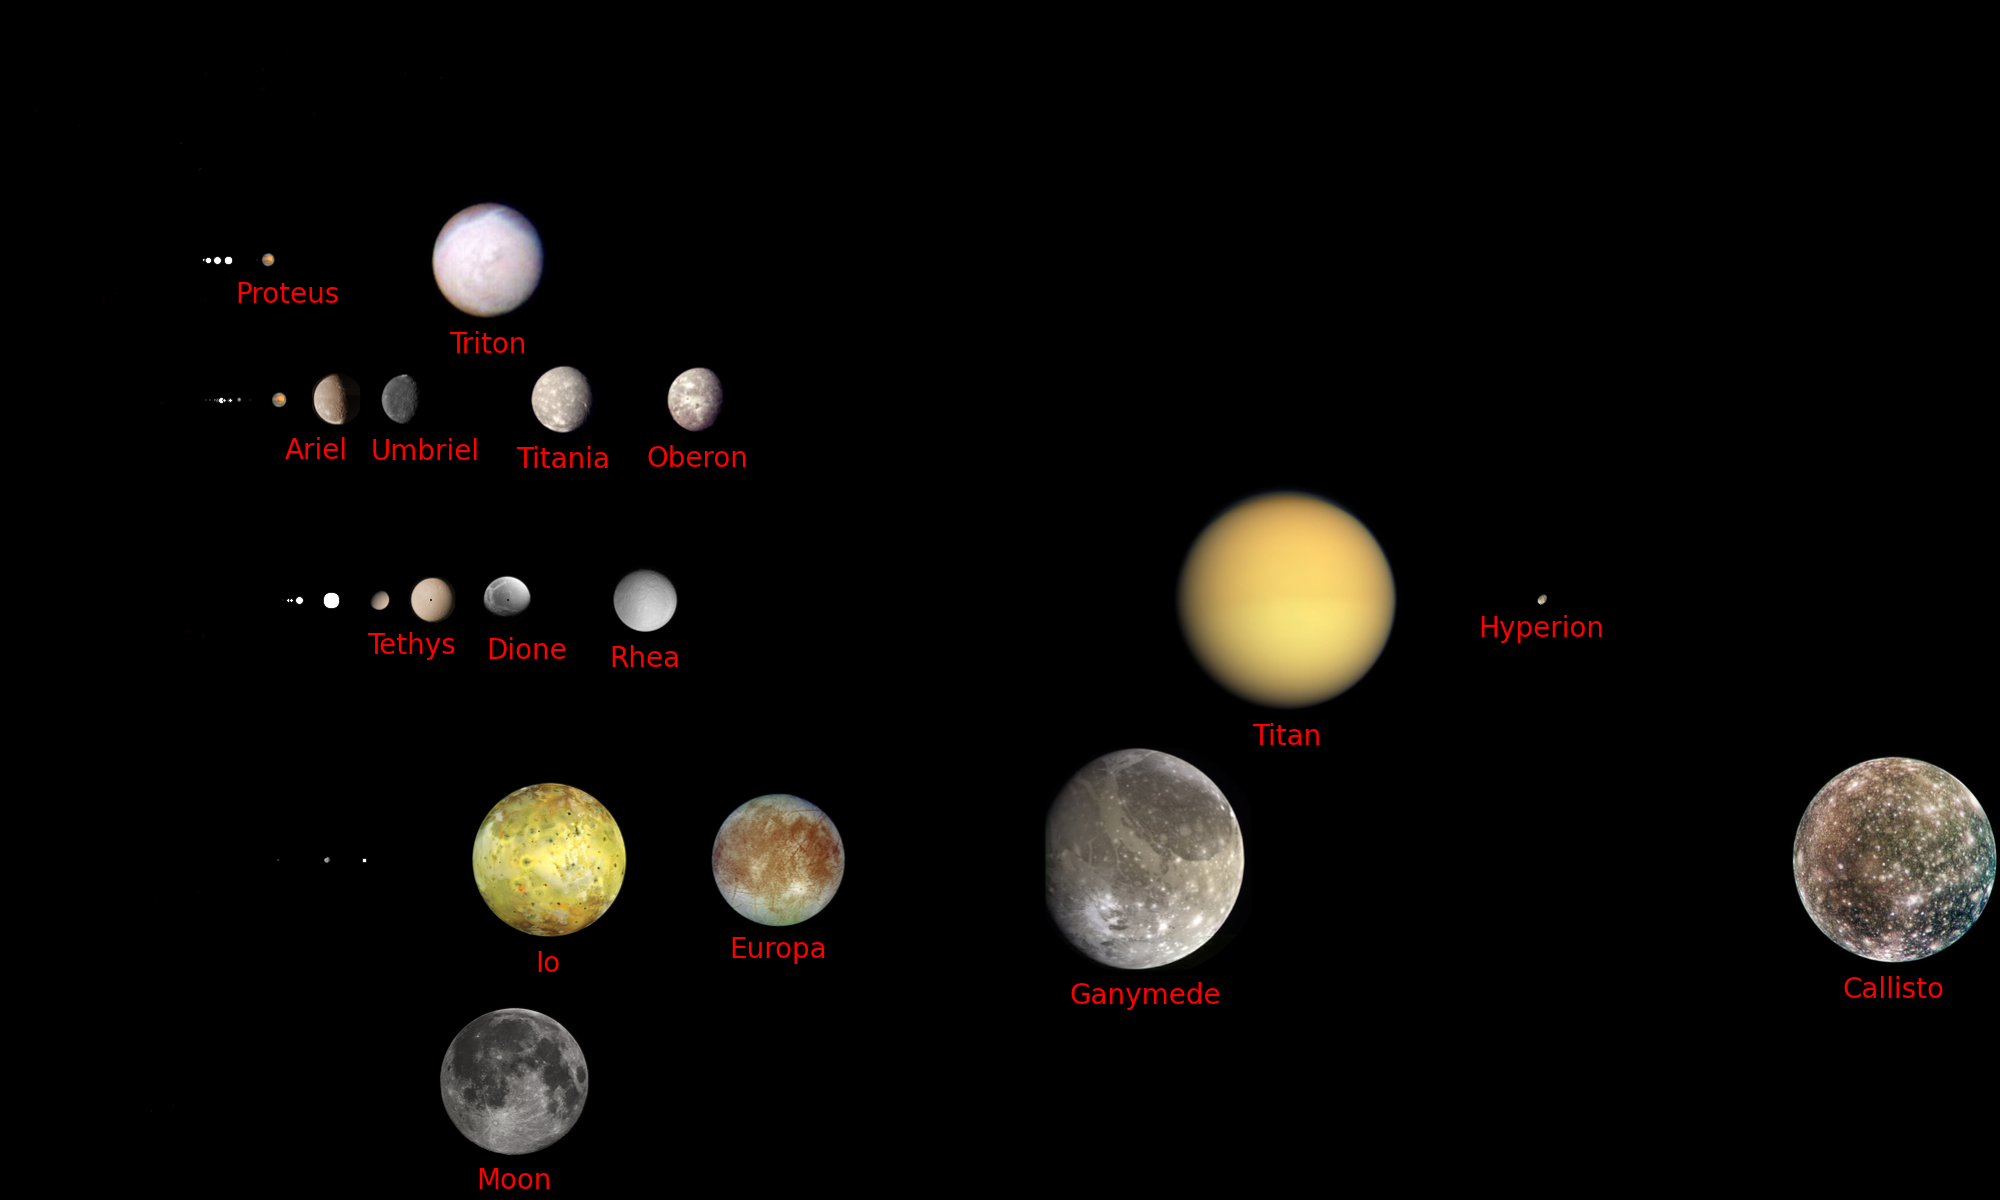
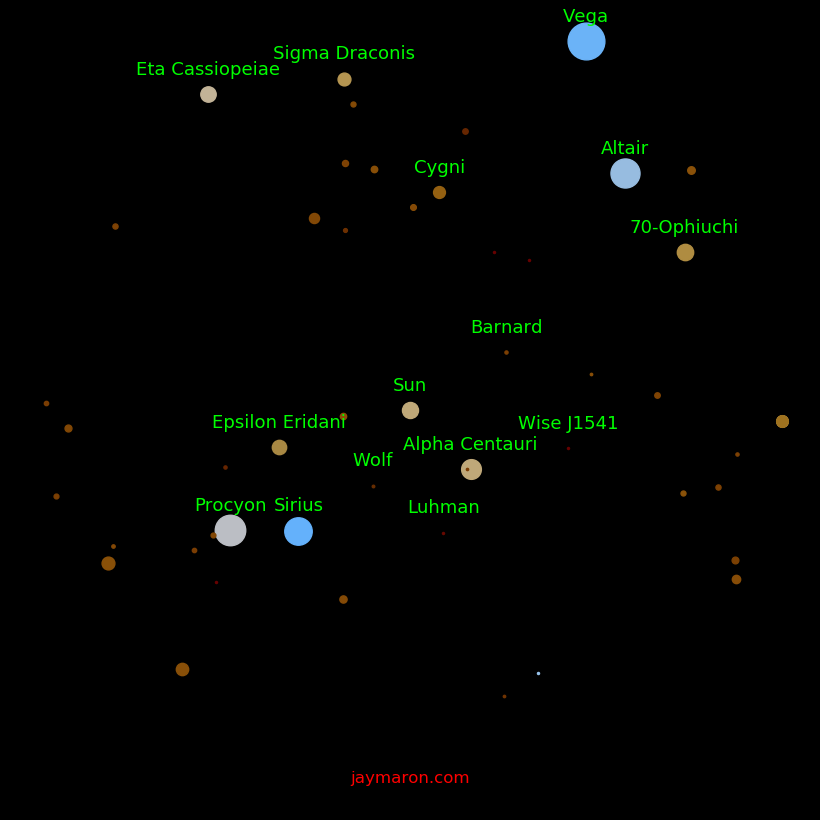
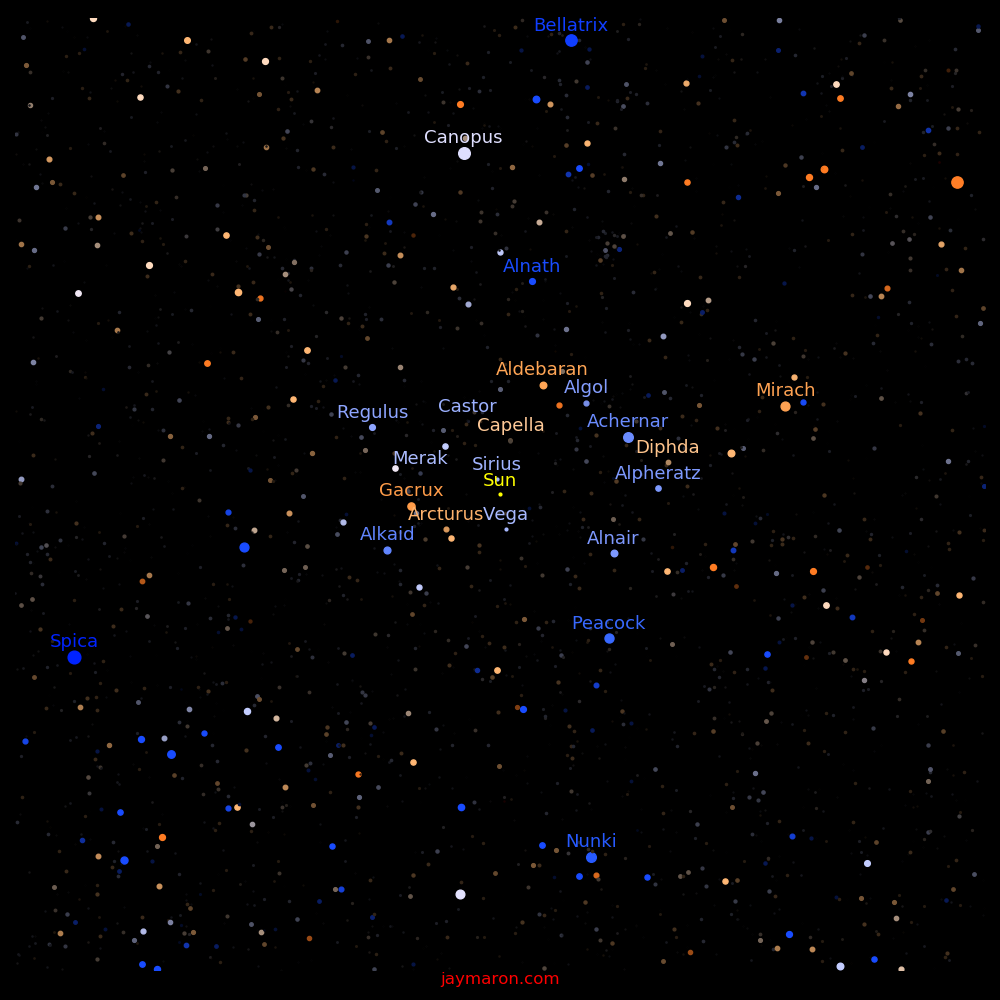
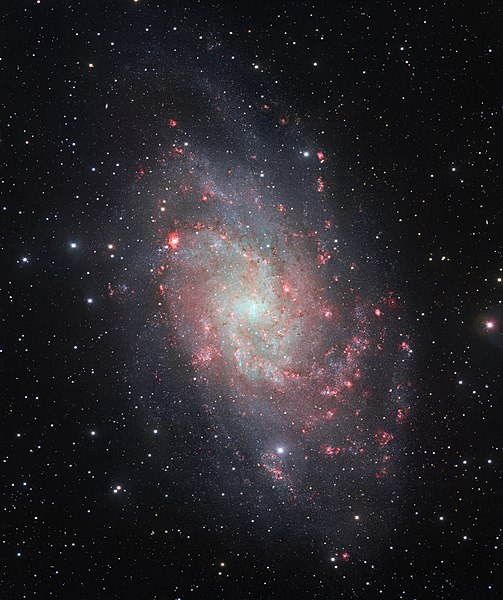
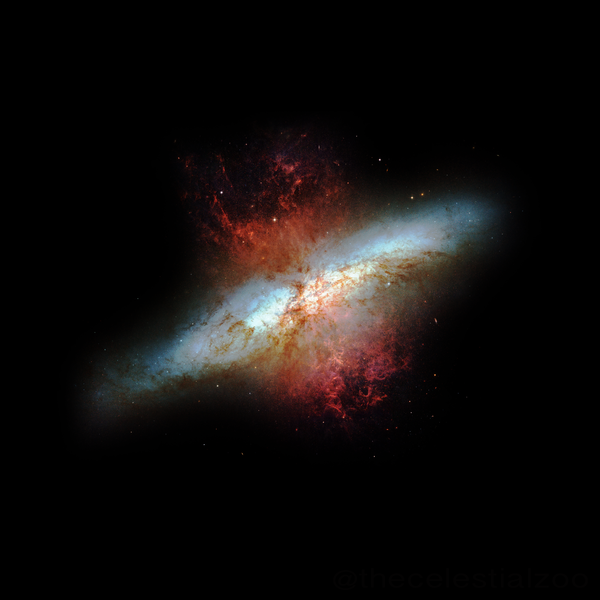
Sizes are to scale and colors are as your eye perceives. Brightness is scaled logarithmically. The image is 40 light years across.
 |
|---|
Proxima Centauri is the small red dot on top of Alpha Centauri. Beta Centauri is at the same place as Alpha Centauri, and is not shown.
Faint red dots are red dwarfs.
 |
 |
 |
 |
 |
 |
|||
|---|---|---|---|---|---|---|---|---|
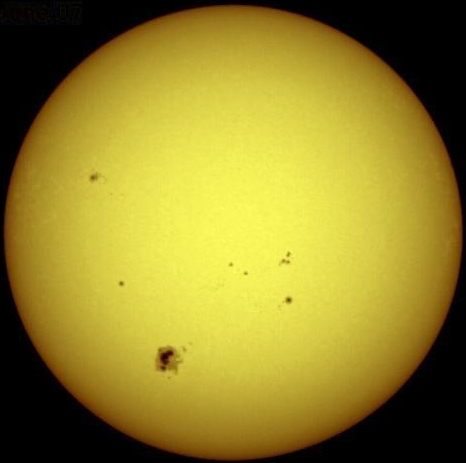
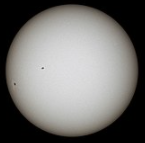
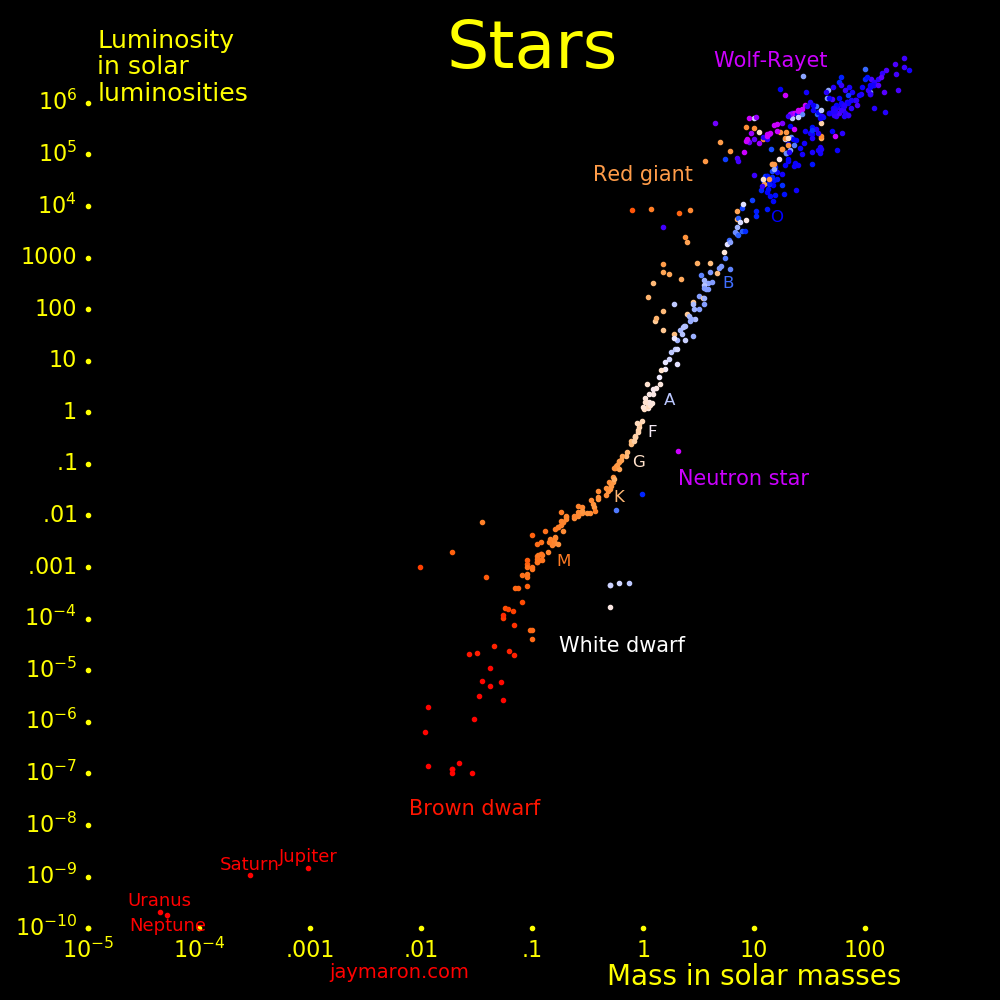
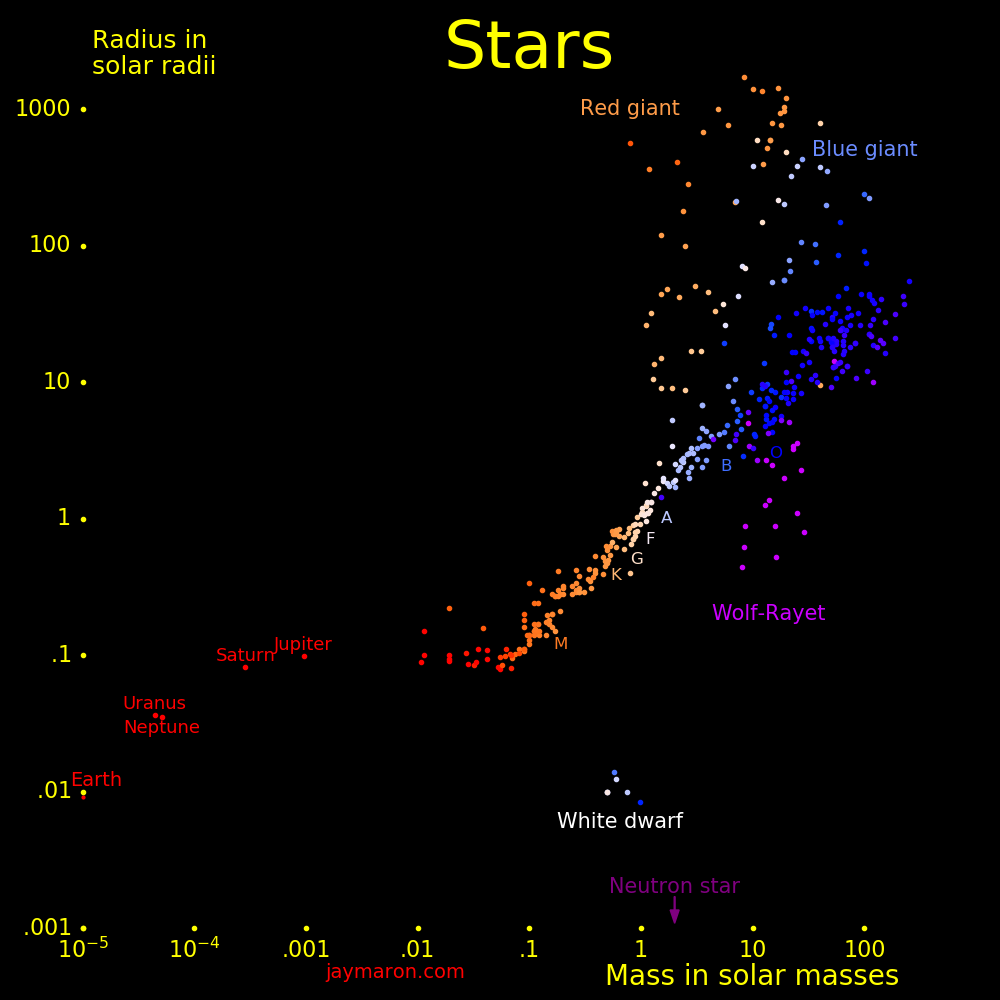
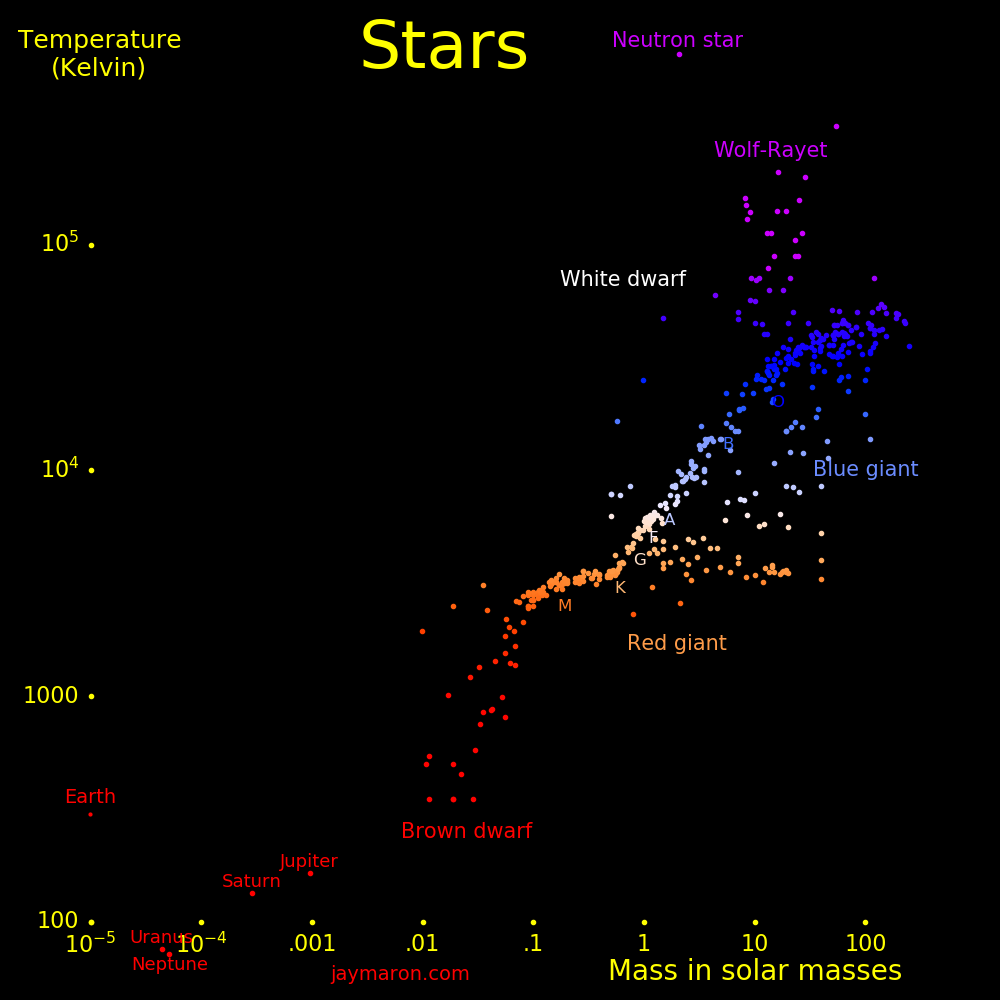
The sun is a G star.
Sizes and colors are to scale. Brightness is not to scale. Blue giants are vastly brighter than red dwarfs.
Mass increases rightward.
 |
|---|
Color is as your eye perceives, and dot size scales with the logarithm of luminosity. The image is 500 light years across, and it's aligned with the galactic plane. If you are far away from the galaxy, such that all the stars are the same distance from you, then this is what you would see. The galaxy is a mix of red, orange, white, and blue stars, and they average to white.
 |
|---|
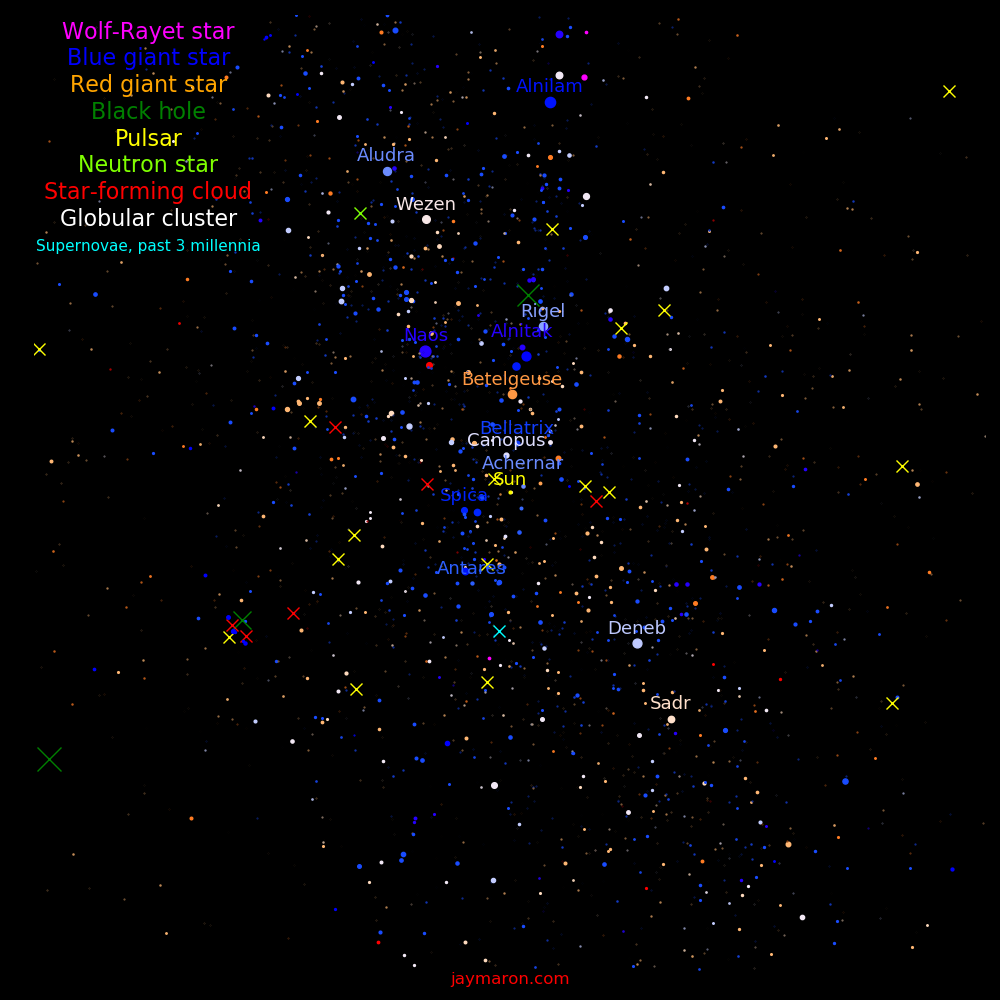
For stars, color is as your eye perceives, and dot size scales with the logrithm of luminosity. The image is 5000 light years across, and it's aligned with the galactic plane.
 |
|---|
 |
|---|
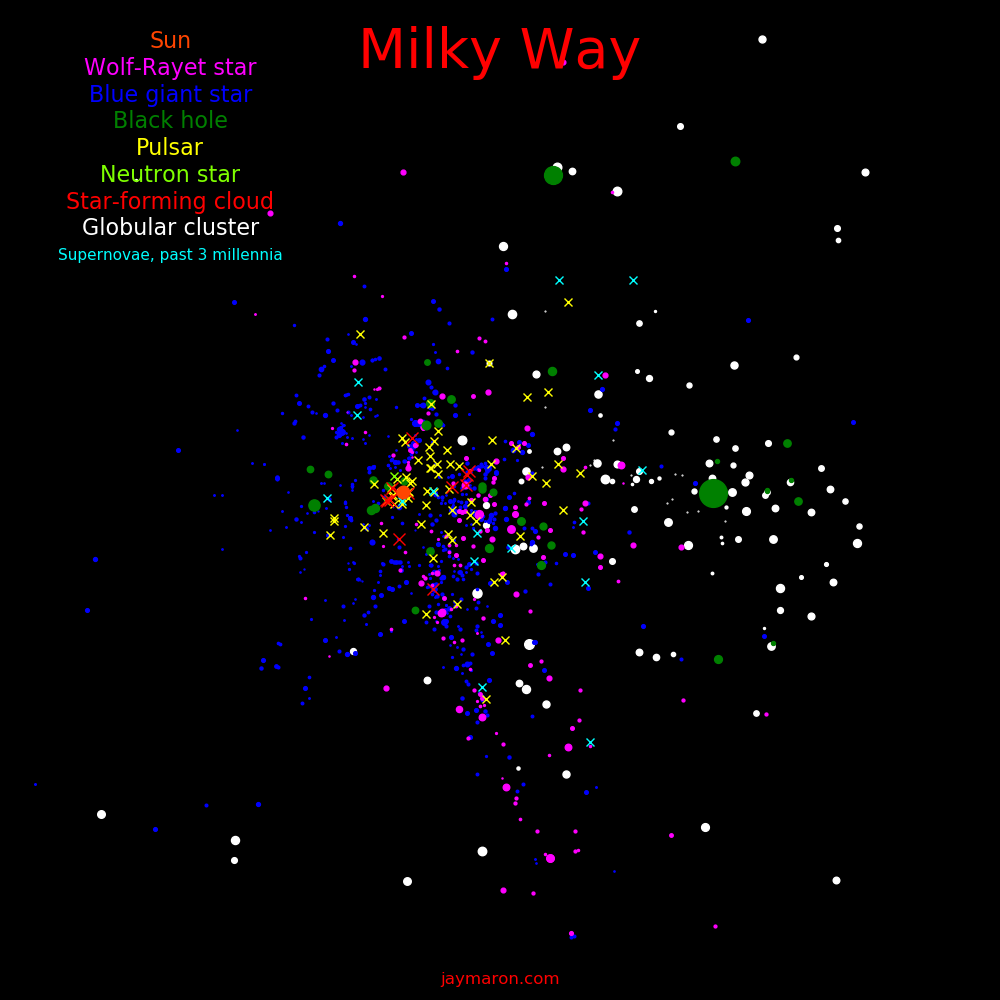
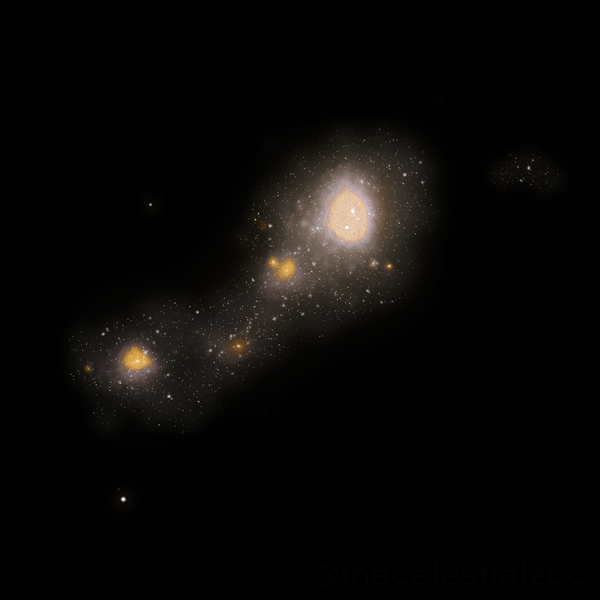
The big green dot is the supermassive black hole at the center of the galaxy, and the sun is to the left. The image is 80000 light years across.
Globular clusters are centered around the galaxy center.
The sun is in a spiral arm, which is mapped out by stars and star-forming clouds.
Most of the far side of the galaxy is obscured by dust, which is why most of the objects are on the near side of the galaxy. Globular clusters and blue giant stars are bright enough to be seen on the far side of the galaxy.
 |
|---|
 |
|---|
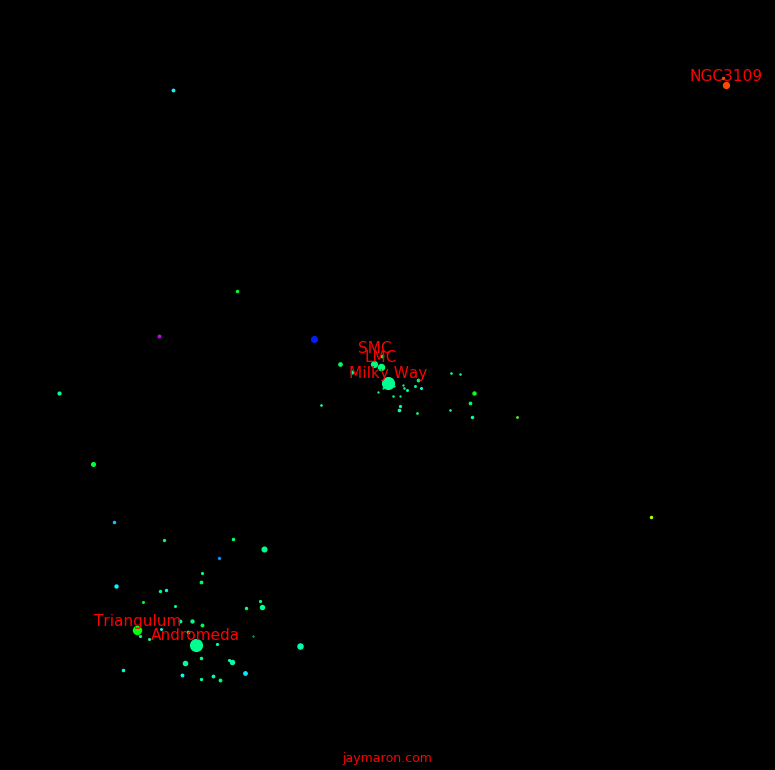
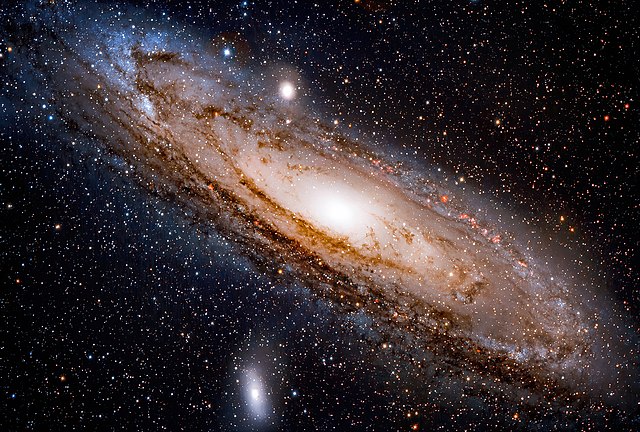
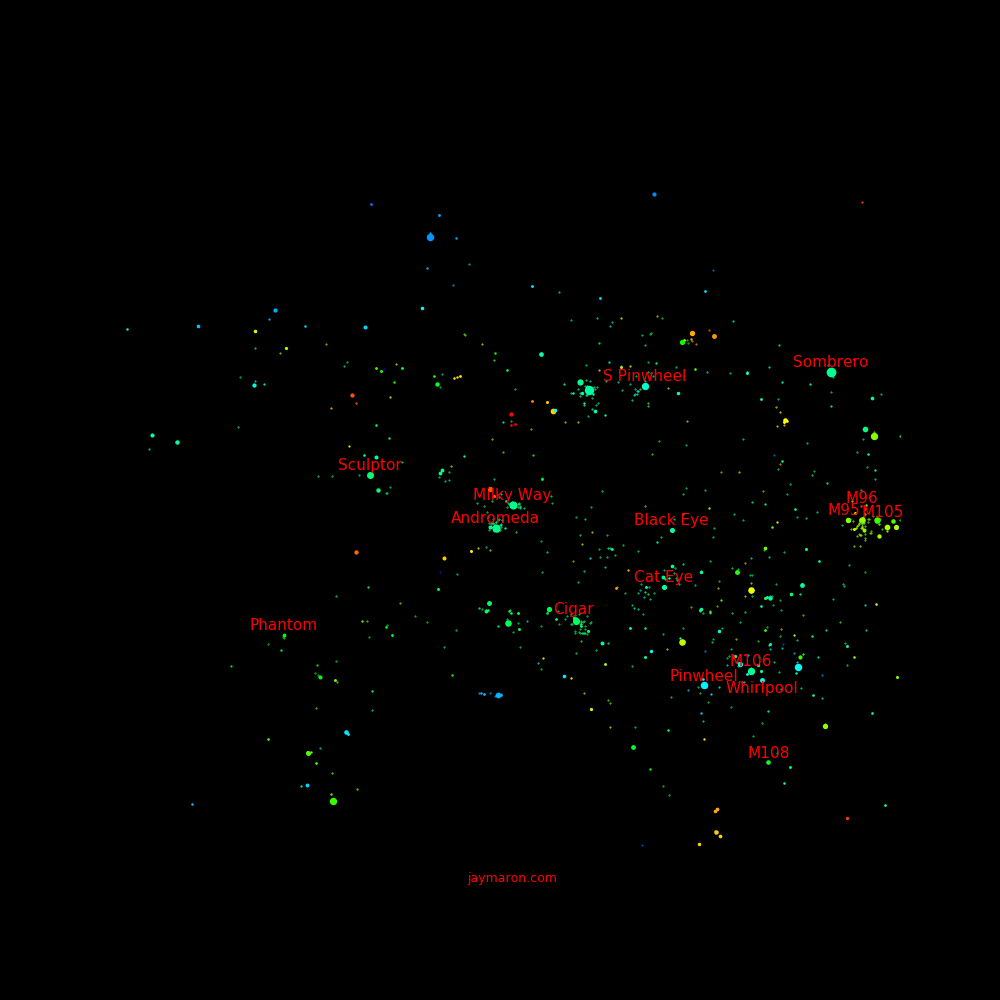
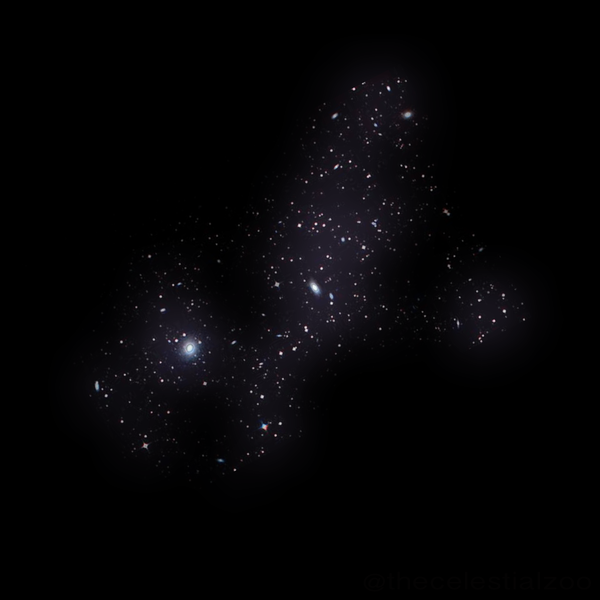
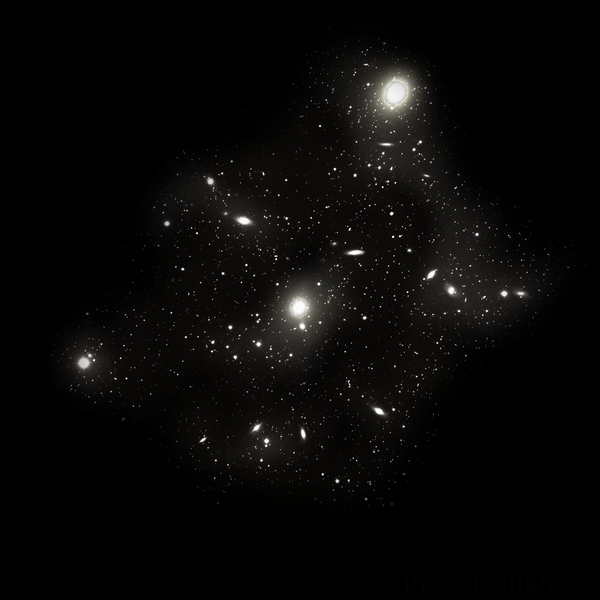
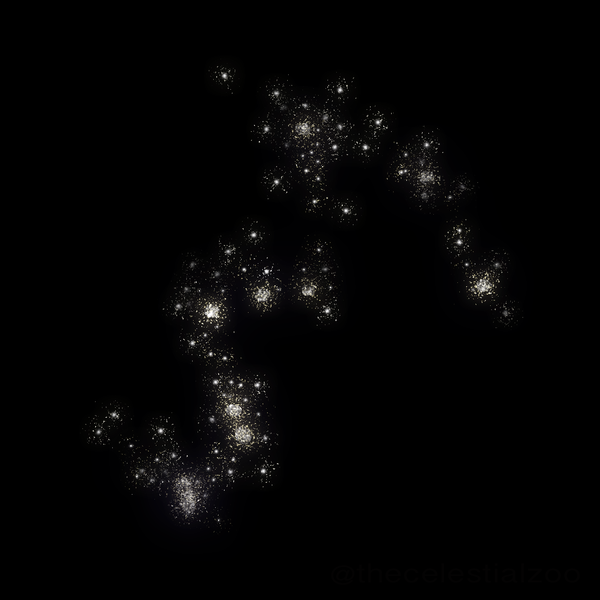
The largest galaxies in the local group are the Milky Way and Andromeda. Sizes and distances are to scale. The image is 6 million light years across. Color indicates the Z coordinate. Blue points have positive Z, red points have negative Z, and green points have Z=0.
 |
 |
 |
 |
|---|---|---|---|
 |
|---|
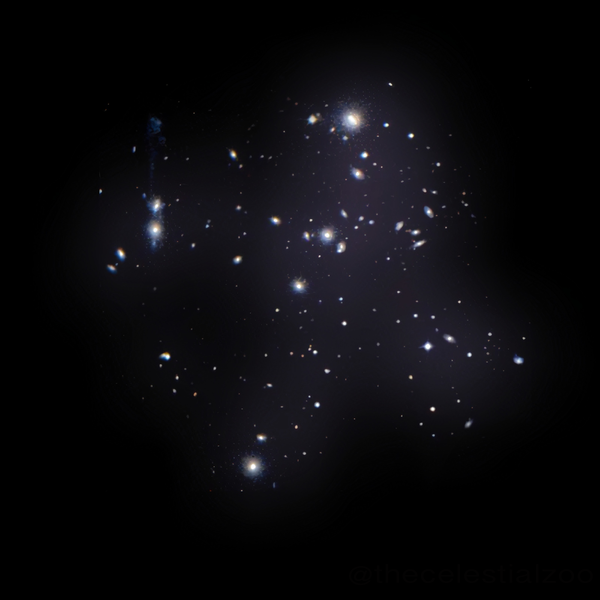
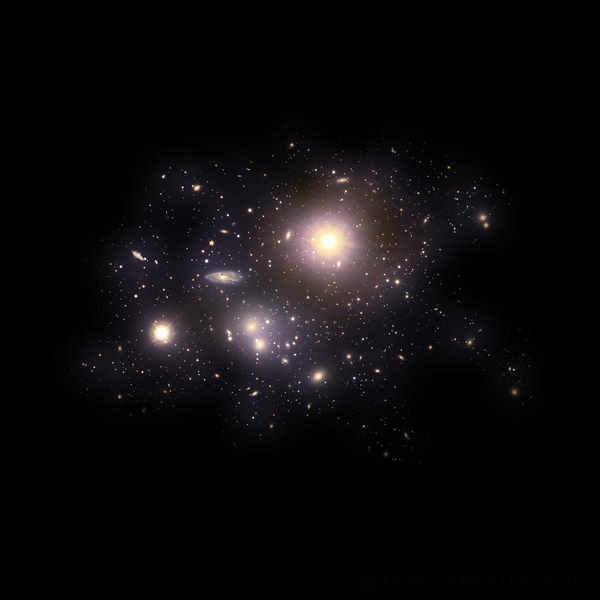
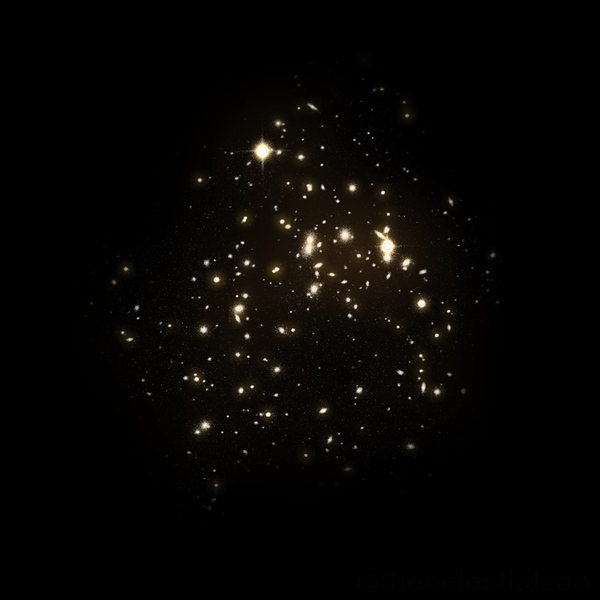
Most galaxies lie in a plane, the "supergalactic plane". This is why most of them are green. The plane Z=0 is aligned with the supergalactic plane.
 |
 |
 |
 |
 |
 |
 |
 |
 |
 |
 |
 |
 |
 |
|---|---|---|---|---|---|---|---|---|---|---|---|---|---|
 |
|---|
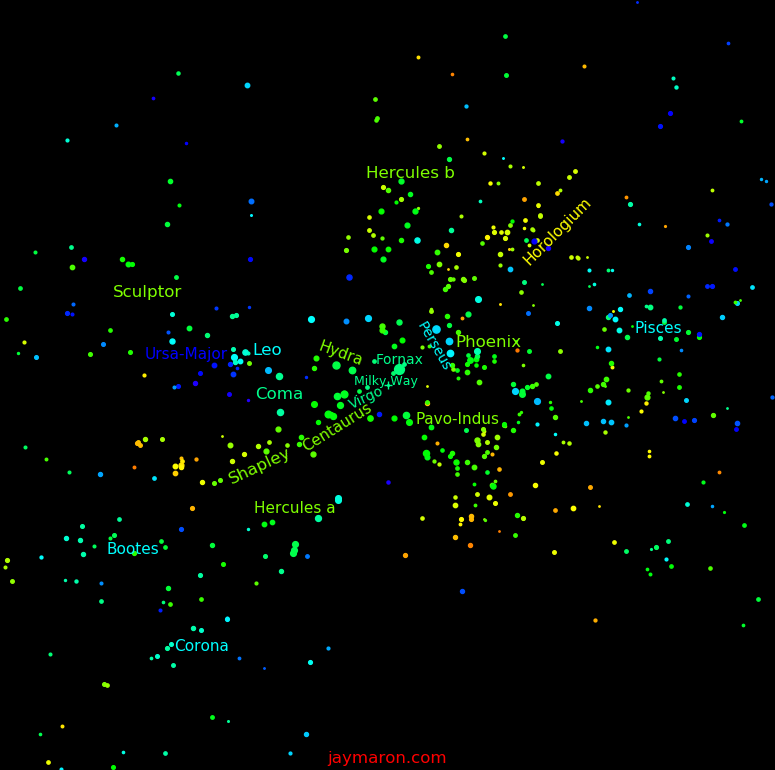
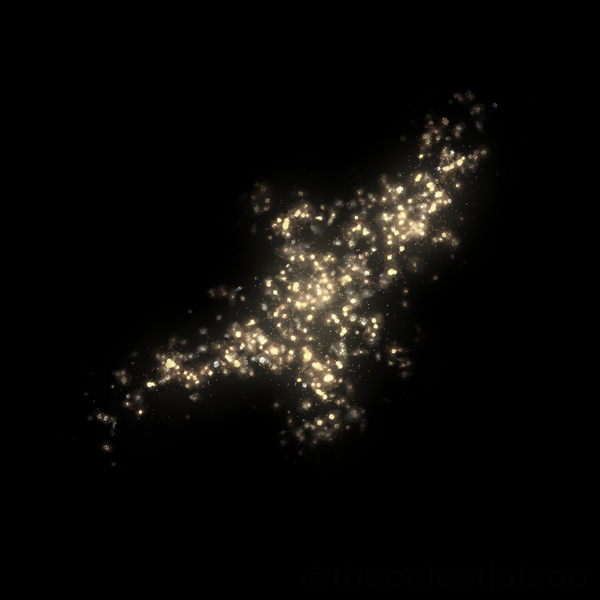
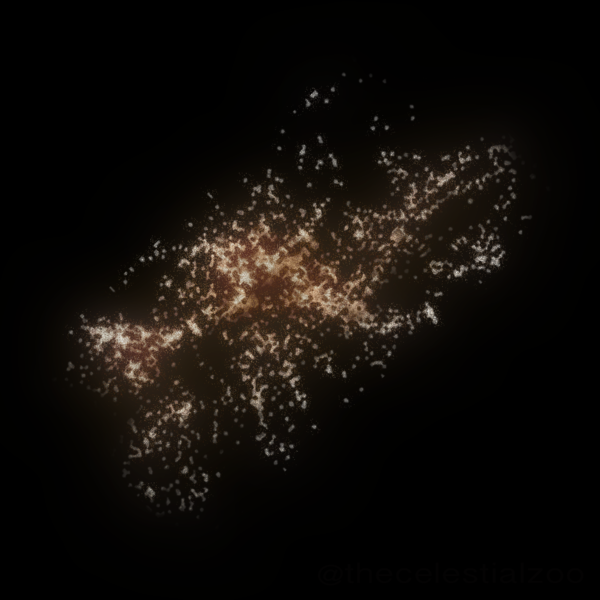
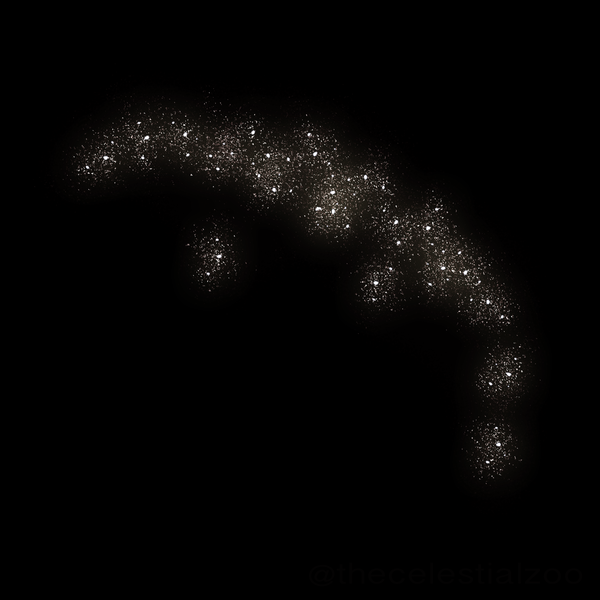
Dots are "Abell clusters", which are clusters of galaxies. Abell clusters are often grouped into superclusters.
The image is 2000 million light years across. Blue points have positive Z, red points have negative Z, and green points have Z=0.
Most superclusters lie in a plane, the "supergalactic plane". This is why most of them are green. The plane Z=0 is aligned with the supergalactic plane.
 |
 |
 |
 |
 |
 |
 |
|---|---|---|---|---|---|---|
 |
 |
 |
 |
 |
 |
 |
|---|---|---|---|---|---|---|
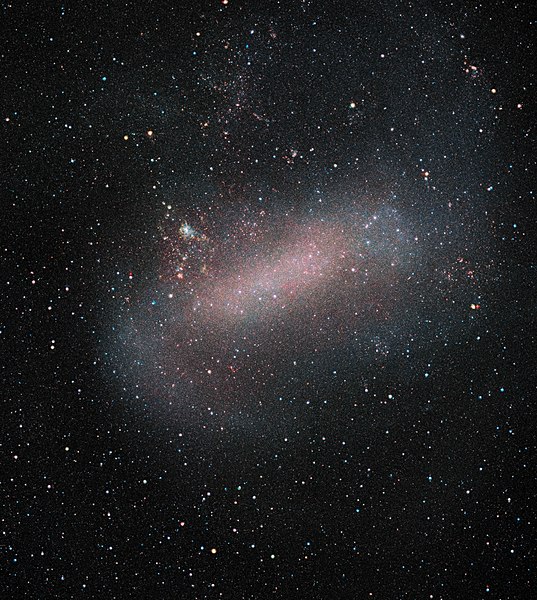
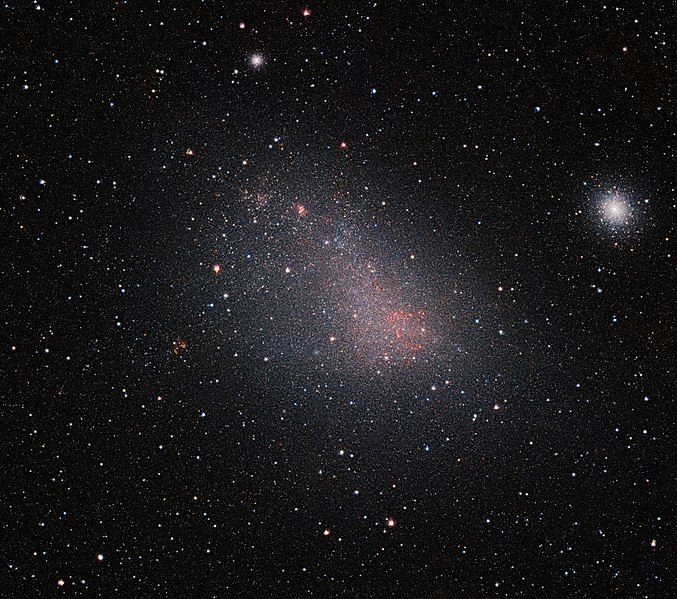
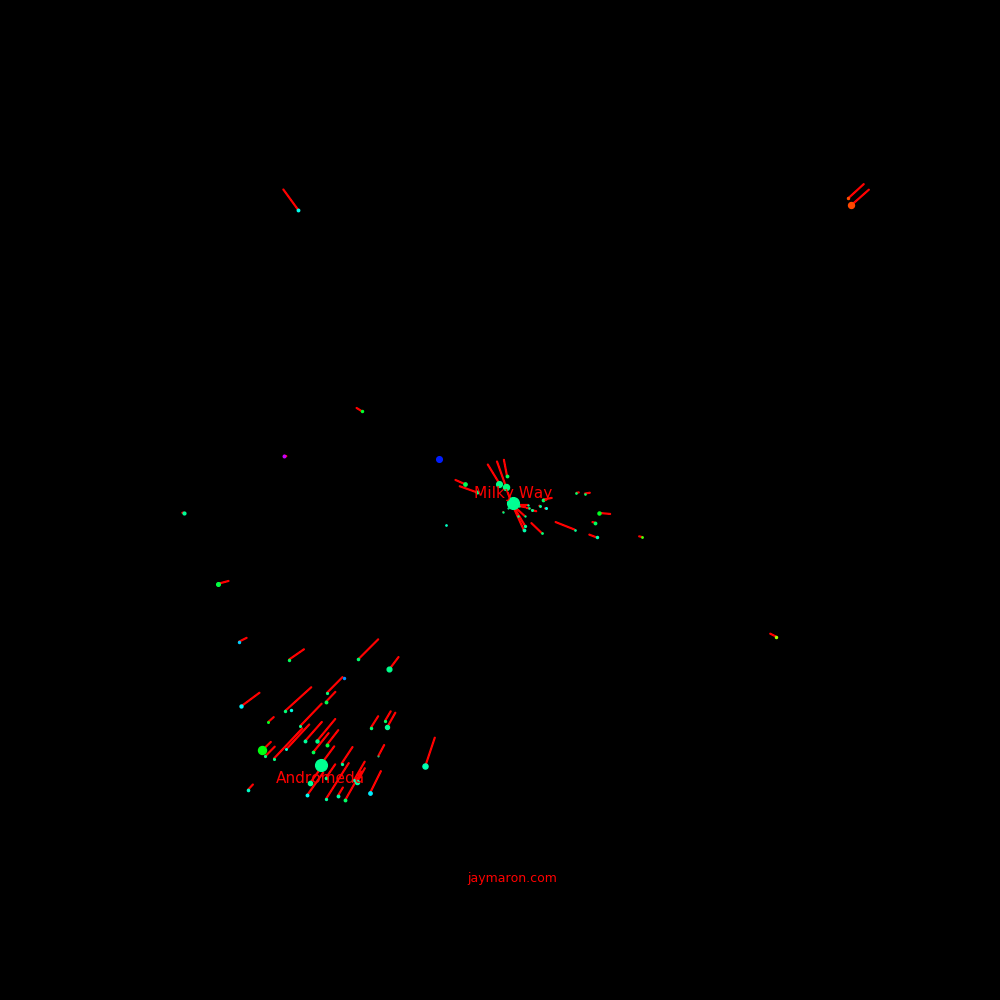
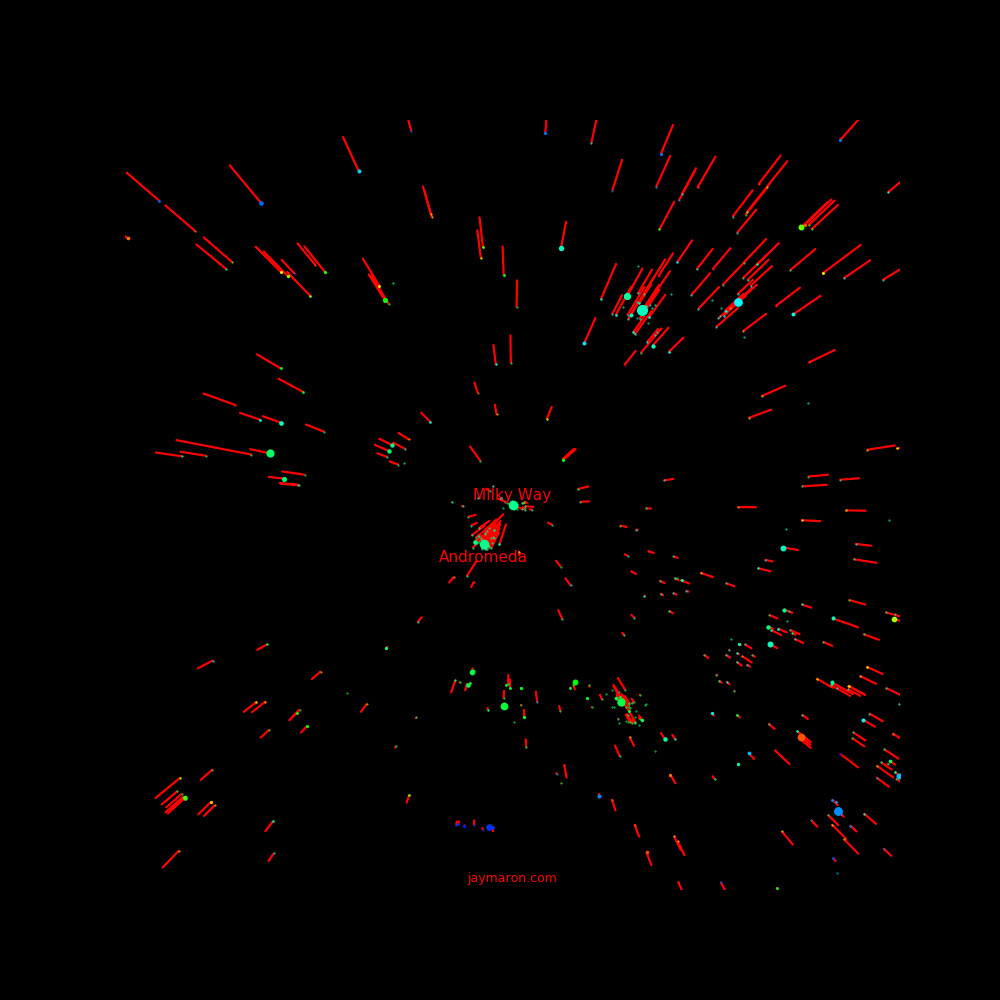
This shows the galaxies of the local group and their radial velocities. Most galaxies are heading in the direction of the Milky Way. Andromeda is headed for a collision with the Milky Way. The LMC and SMC are headed away from us but they will turn around and crash into the Milky Way.
 |
|---|
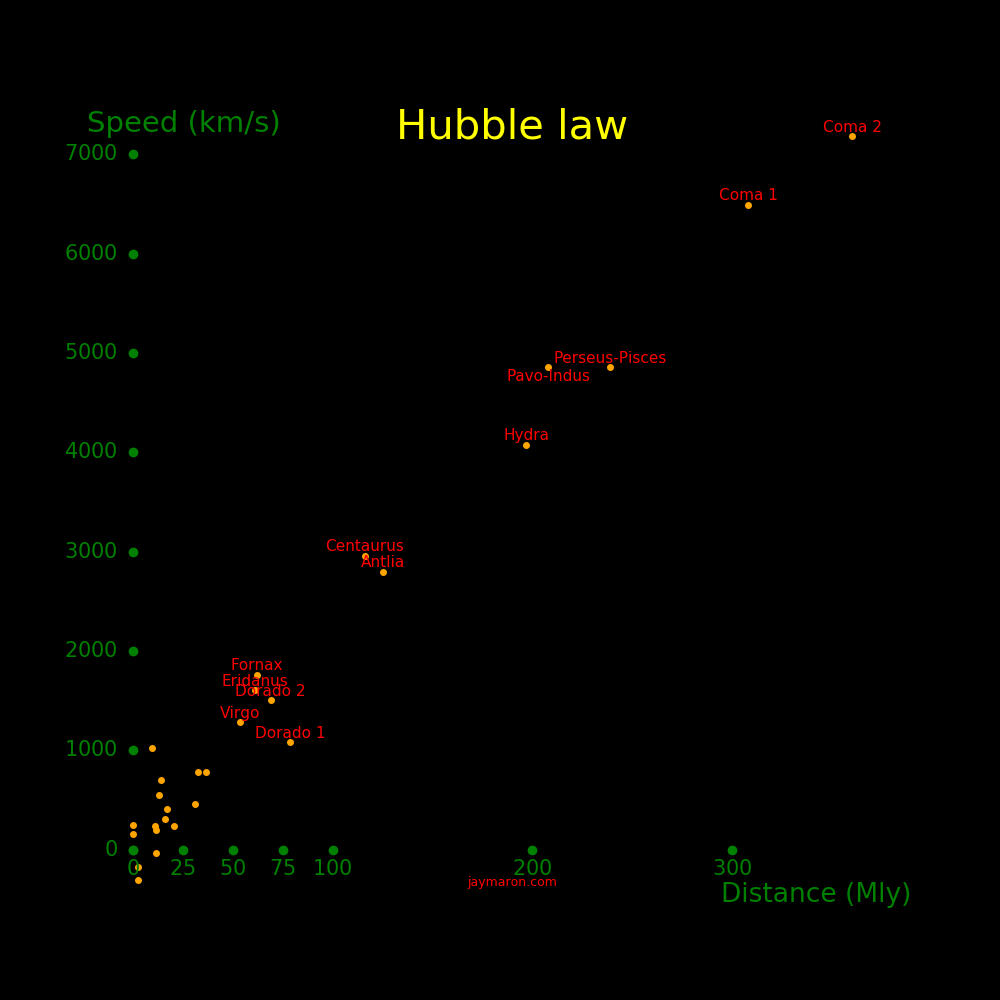
This shows the Hubble law. Nearby galaxies tend to be moving toward us and distant galaxes are always moving away from us. The farther the galaxy, the faster it tends to move away from us.
 |
|---|
The universe expands according to the Hubble law. If there were no gravity, all galaxies would fall on the Hubble line. Departures rom the Hubble law are due to gravity between galaxies.
For each cluster, we identified the largest galaxies and used these for the plot. Each point represents a galaxy, and the label denotes what cluster the galaxy belongs go.
 |
|---|
 |
|---|
 |
|---|
 |
|---|
 |
|---|
 |
|---|
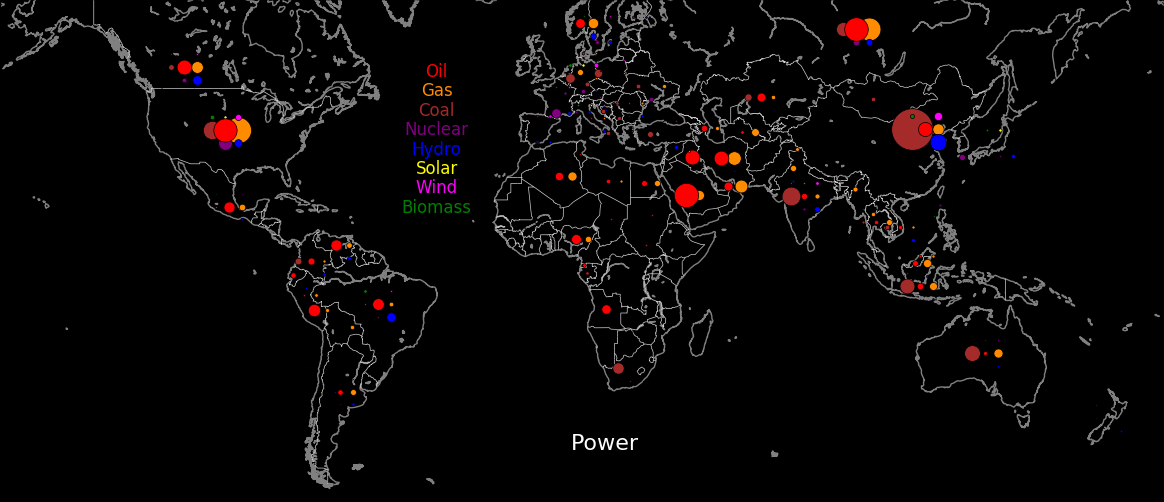
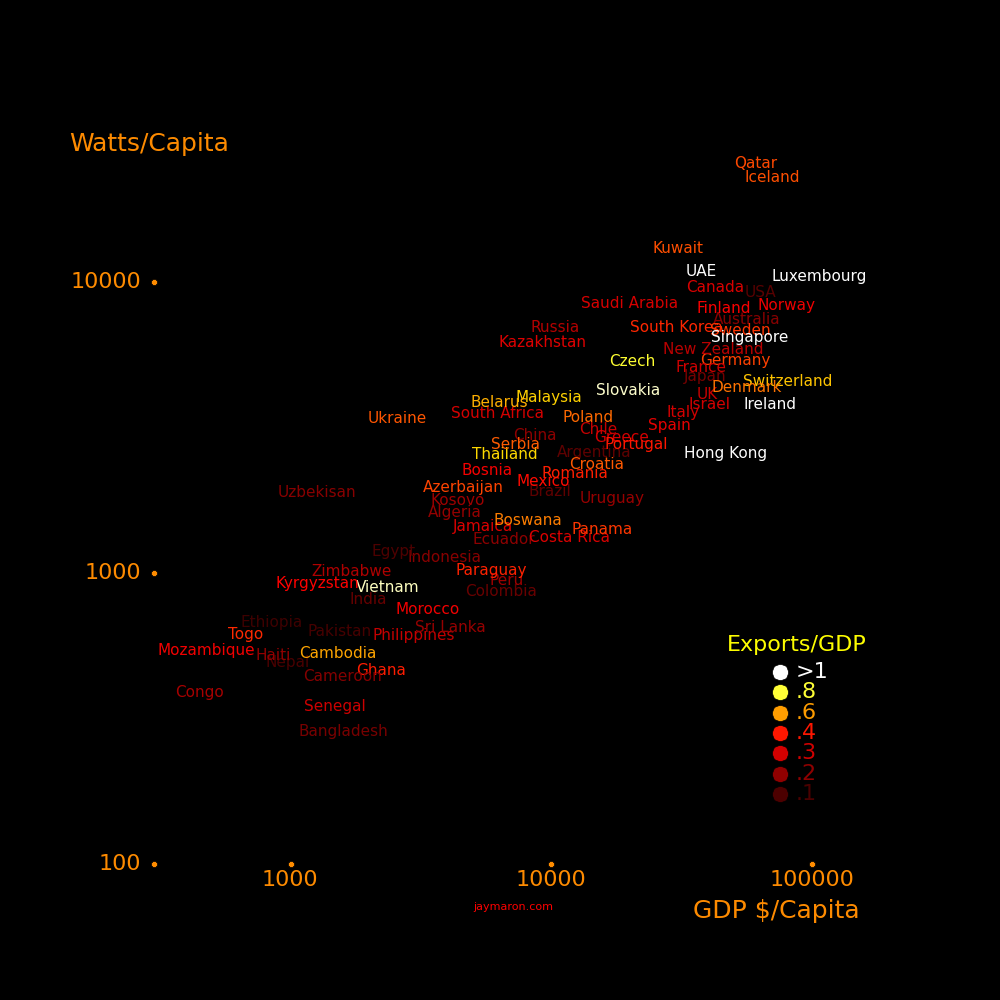
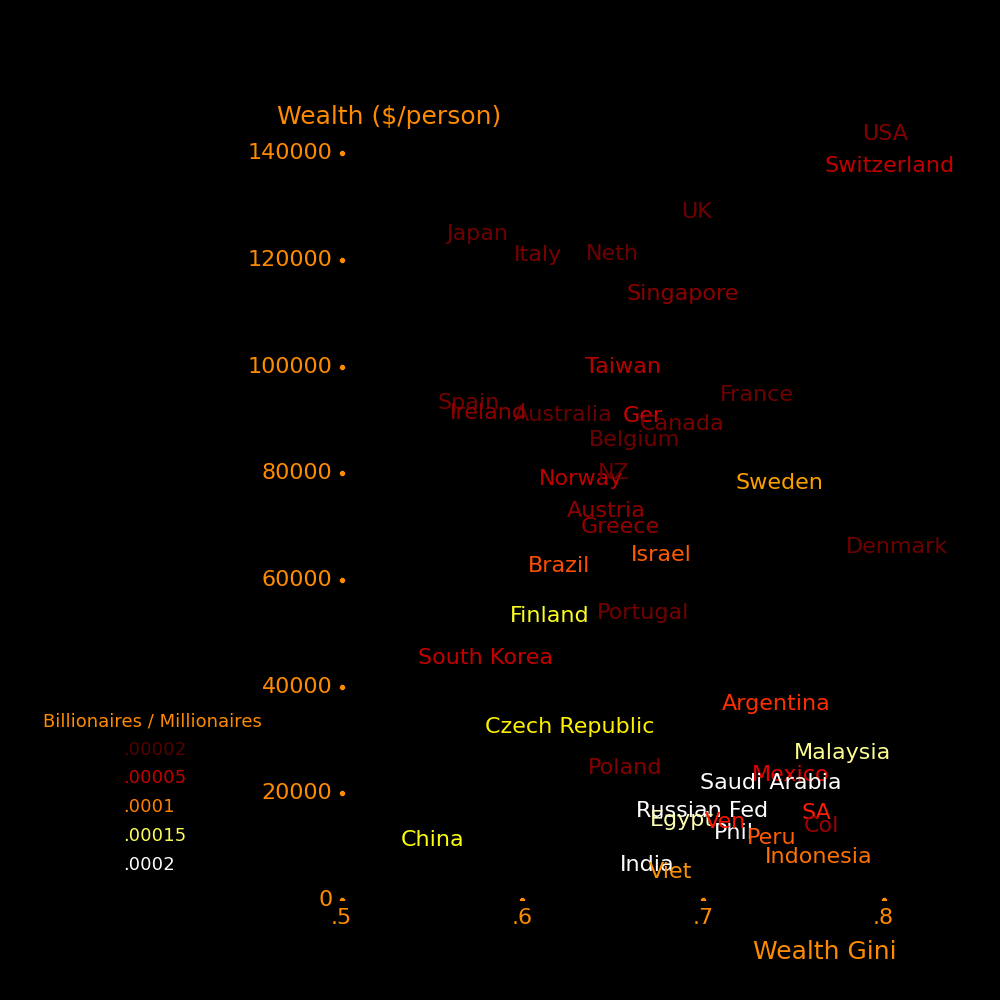
A nation's GDP and power consumption correlated.
 |
 |
The Gini coefficient characterizes a nation's wealth distribution. The larger the Gini coefficient, the more concentrated the wealth.
 |
 |
|---|
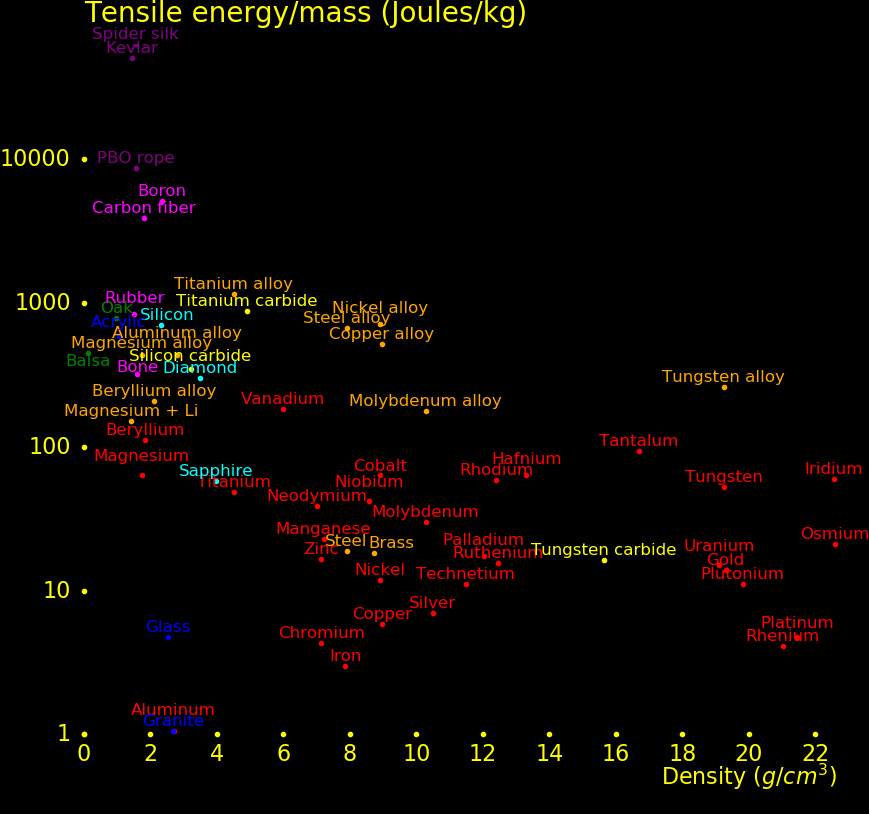
The plot shows the elastic strength of materials Alloys are much stronger than pure metals. Kevlar is substantially stronger than metals.
 |
|---|
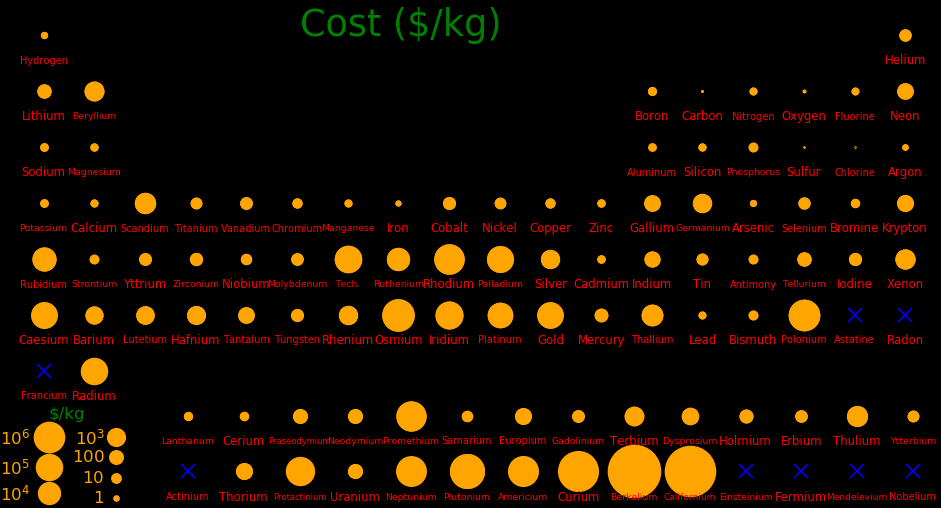
Appendix with more element plots
 |
|---|
 |
|---|
|
|---|
|
|---|
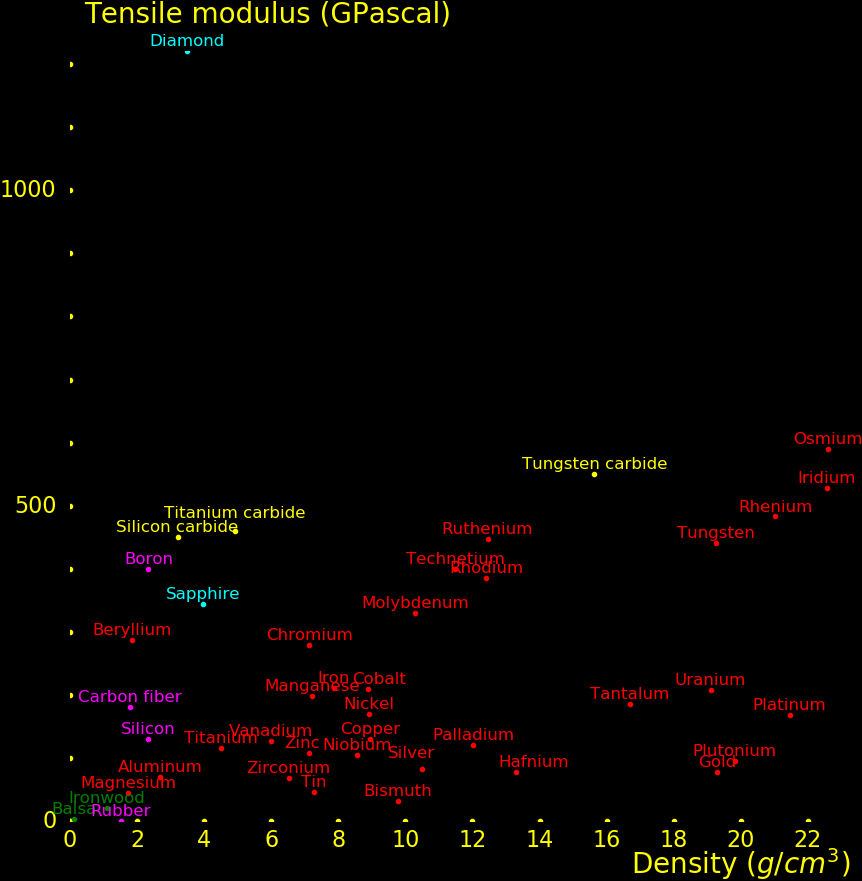
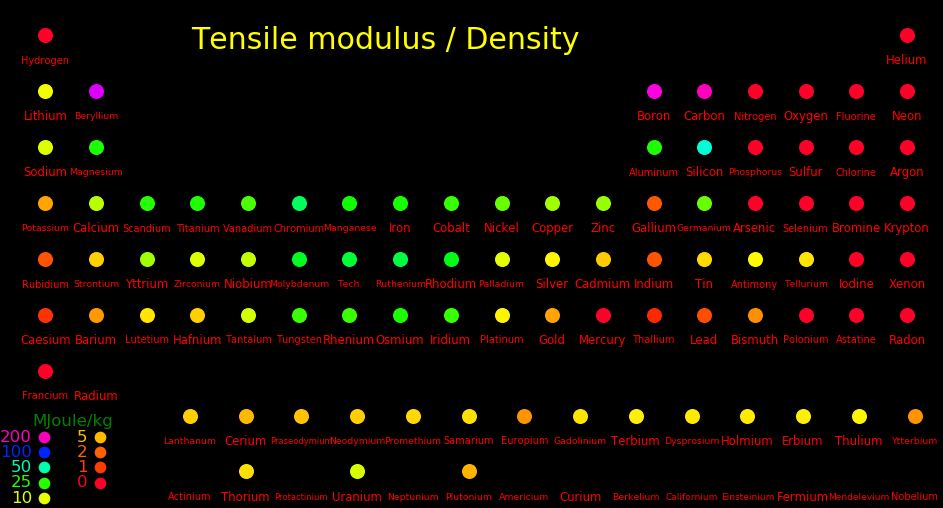
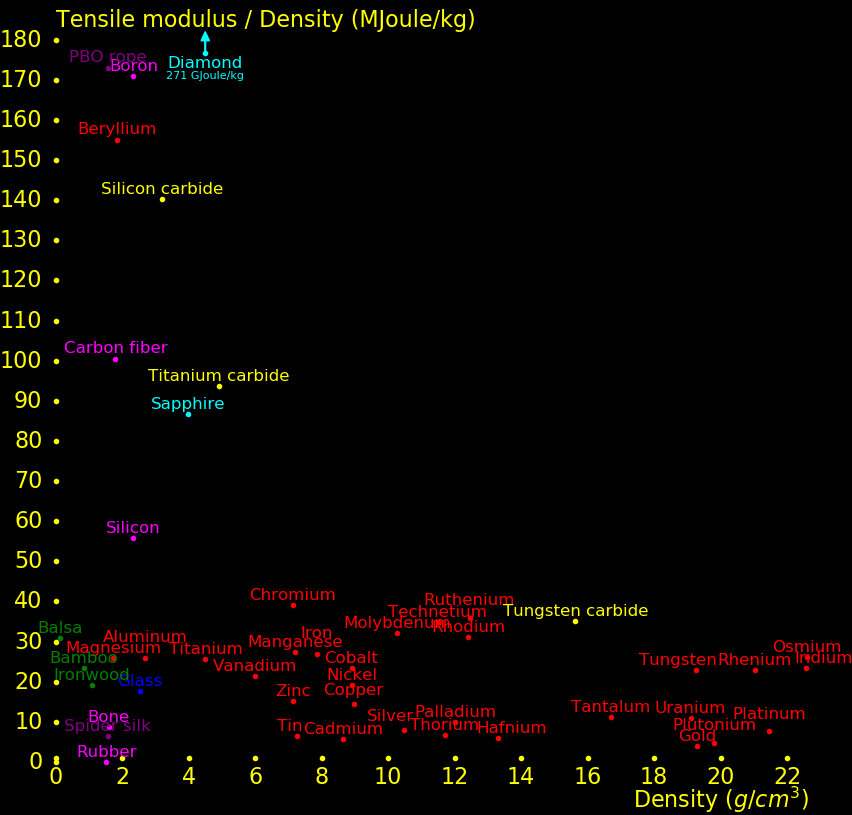
For a material, the "stiffness" is characterized by the "Tensile modulus". The stiffer a material, the more force it takes to stretch it.
 |
|---|
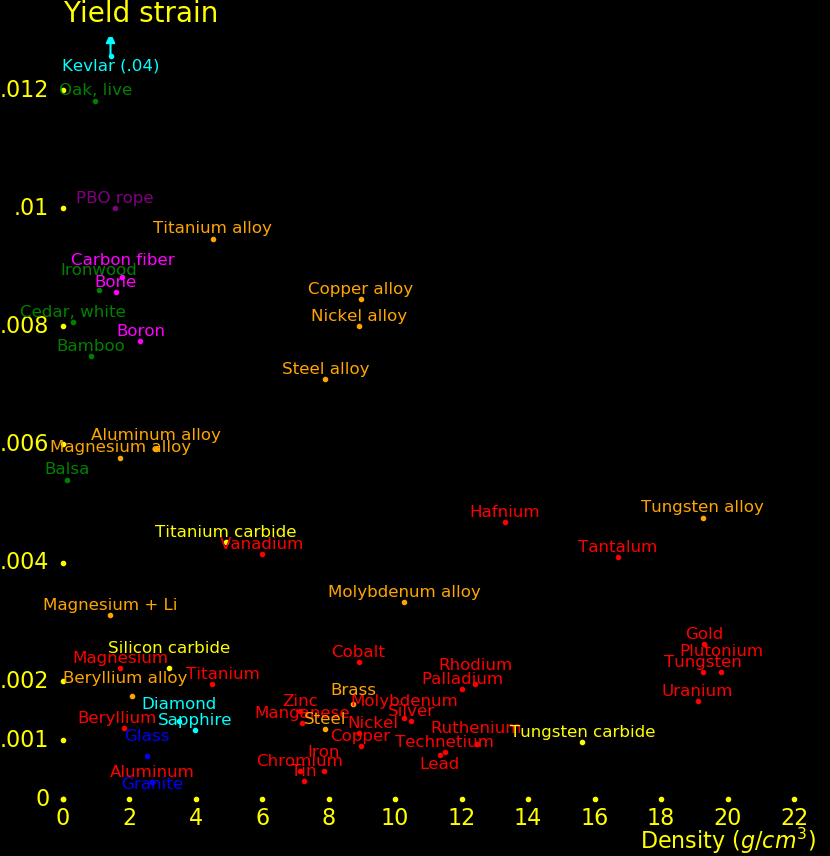
The plot shows the elastic energy per mass at the breaking point, divided by the density. Alloys are much stronger than pure metals. Kevlar is substantially stronger than metals.
Stiffness tends to go together with density.
 |
|---|
The following plot quantifies the elastic strength of materials.
Kevlar is stronger than metals.
Alloys are stronger than pure metals.
|
|---|
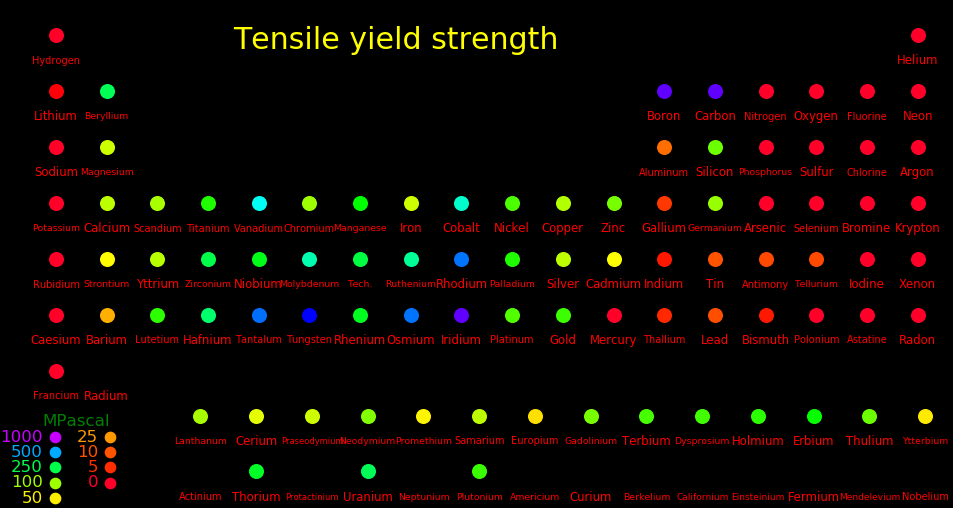
The "Yield strength" is the tensile force/area required to break it.
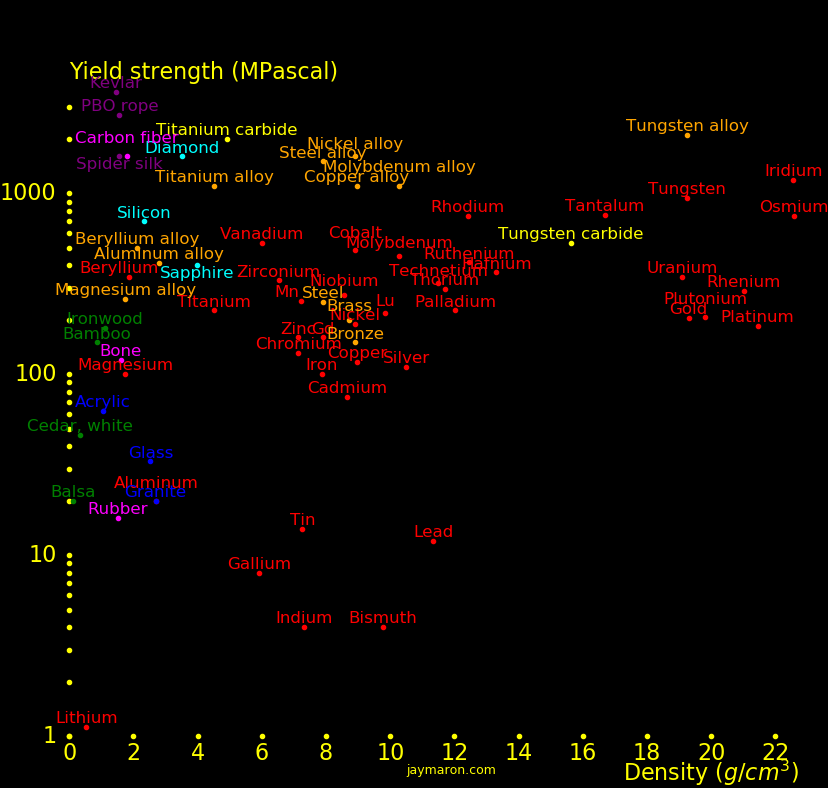 |
|---|
 |
|---|
 |
|---|
 |
|---|
 |
|---|
|
|---|
 |
|---|
|
|---|
 |
|---|
 |
|---|
 |
|---|
 |
|---|
 |
|---|
 |
|---|
 |
|---|
 |
|---|
 |
|---|
 |
|---|
 |
|---|
 |
|---|
 |
|---|